Genworth Renews CBA LMI Contract

Genworth Mortgage Insurance Australia has announced it has renewed its Supply and Service Contract with CBA to provide Lenders Mortgage Insurance from 1 January 2017. This contract represents 43% of Gross Written Premium in 1H16.

Chess-HusingThe contract will be for 3 years to 31 December 2019. Genworth will be the exclusive provider of LMI to CBA for a minimum specified percentage (determined by the number of funded applications for new loans) of new high LVR residential mortgage loans. The minimum LMI percentage is consistent with the level set in 2014 and is fixed for the duration of the renewed term.

You can read our recent post on LMI here.


ANZ FY16 Results – Back To Basics

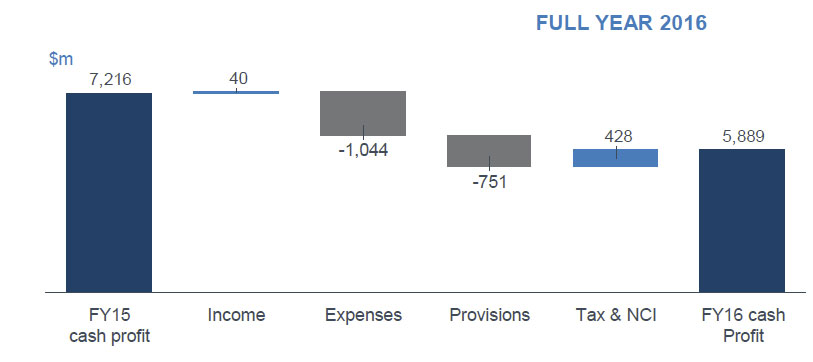
ANZ today announced a Statutory Profit after tax for the Financial Year ended 30 September 2016 of $5.7 billion down 24% and a Cash Profit of $5.9 billion down 18%. It is a complex picture thanks to restructuring,  re-balancing and rising provisions.

They are betting the bank on growing the Australian business, which now comprises 62% mortgage lending, as they exit areas of business in Asia, and restructure, to a simpler, and perhaps more profitable enterprise.

They say the FY16 result reflects a good performance in ANZ’s core domestic franchises and significant reshaping of the business driven by ANZ’s strategic focus to create a simpler, better capitalised and more balanced bank that produces better outcomes for customers and shareholders.

The result reflects an emphasis on delivering strong capital and cost management outcomes together with $1,077 million of charges (after tax) for specified items primarily related to reshaping the Group to position it for improved performance in future years.

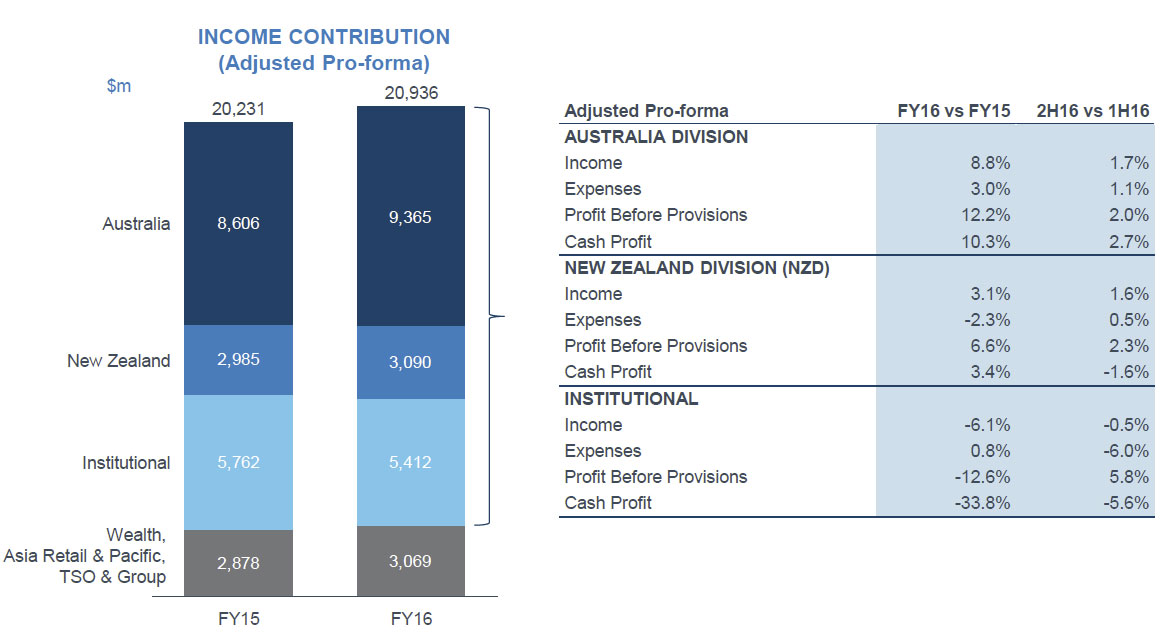
Adjusted Pro-Forma Cash Profit was $7.0 billion down 3%, while Profit before Provisions increased 6% as the benefits of simplification and re-balancing initiatives began to emerge.

Return on equity was stable in the second half of the financial year at 12.2% (adjusted Pro-forma Cash Profit basis). The Final Dividend of 80 cents per share is consistent with guidance provided at the Interim Profit announcement. The Total Dividend for FY16 is 160 cents per share fully franked down 12%.

At the 2016 Interim Result, ANZ advised that it was conducting strategic reviews of the Group’s Retail and Wealth business in Asia, and its Wealth businesses in Australia and New Zealand. The reviews considered each business within the context of the overall Group strategy including capital efficiency.

ANZ announced on 31 October 2016 that it had entered into an agreement with DBS to sell the Retail and Wealth businesses in Singapore, Hong Kong, China, Taiwan and Indonesia. ANZ intends to clarify plans for the remaining businesses in Retail and Wealth in Asia during FY17.

The strategic review of ANZ’s Wealth businesses in Australia and New Zealand concluded that while the distribution of high quality Wealth products and services should remain a core component of the Group’s overall customer proposition, ANZ does not need to be a manufacturer of Life and Investments products.

The initial focus will be on the Australian Wealth business where ANZ is exploring a range of possible strategic and capital market options that will maintain strong outcomes for customers. This includes the possible sale of the life insurance, advice and superannuation and investments businesses in Australia.

ANZ will pursue a disciplined approach to this process and will update the market as appropriate. The Wealth business in New Zealand will be considered separately during 2017.

Net Interest income was up 3%, to $15,095m from FY15, whilst other operating income fell 16% to $5,434m, so combined, operating income was down 3%.

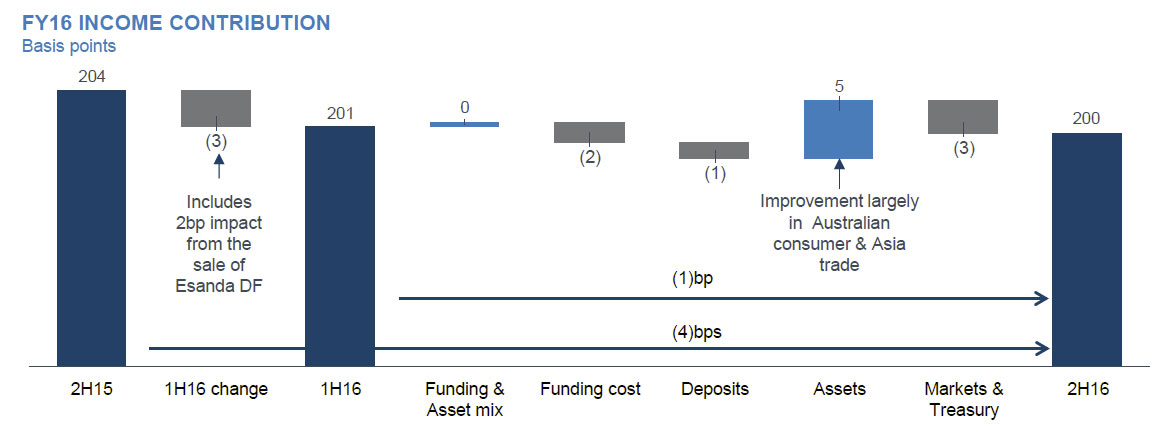
Operating expenses rose 11% to $10,422m, whilst credit impairment charges rose 64% to $1,929m. anz-fy16-6
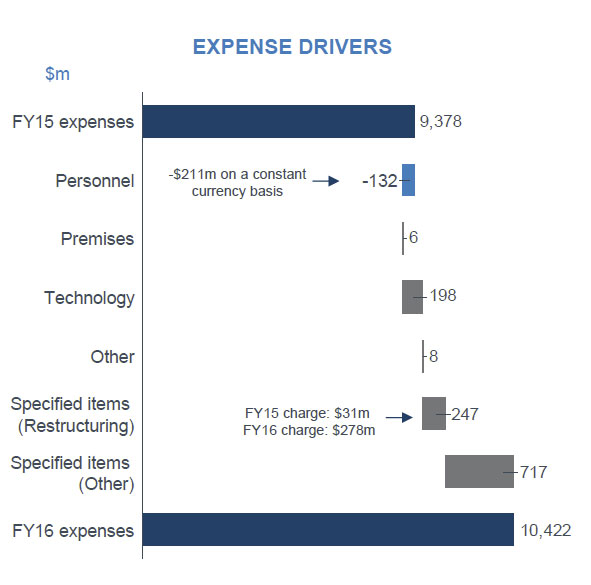
Group net interest income fell 4 basis points, and whilst there were falls in NZ, (down 9 basis points), Institutional rose 14 basis points and Australian nim was static, thanks to repricing in the book.

anz-fy16-5In FY16 ANZ recognised the impact of a number of items collectively referred to as Specified Items which form part of the Group’s Cash Profit. The items are primarily related to initiatives undertaken to re-position the Group for stronger profit before provisions growth in the future.

anz-fy16-1
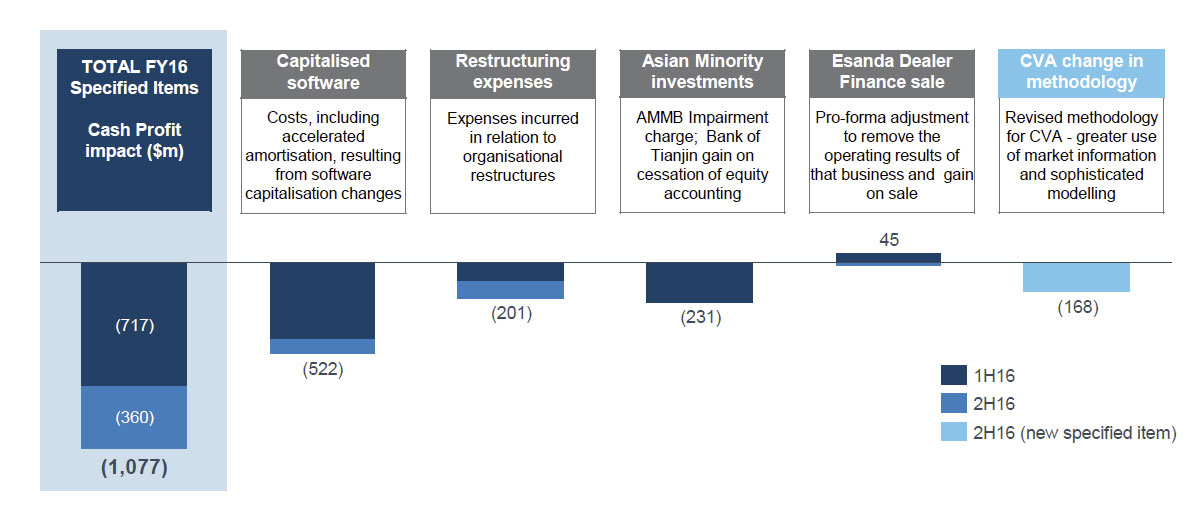
ANZ recorded $1,077 million (after tax) of specified items charges in Cash Profit during the Financial Year, of which almost half ($522 million) related to a change in the application of the software capitalisation policy. This change in policy effected a 24% reduction in the Capitalised Software
balance year on year.

One third of the specified items charges occurred in the second half, including an additional restructuring charge of $100 million (post tax) and a derivative credit valuation adjustment (CVA) of $168 million (after tax).
The restructuring charge supports the evolution of the Group’s strategy and will underpin further productivity through reshaping of the workforce to reduce complexity and duplication, and to align with the changing emphasis in Institutional. ANZ has refined the methodology for the calculation of CVA, a component of valuing derivative instruments in the Markets business. The updated methodology makes greater use of market credit information and more sophisticated exposure modelling and is in line with leading market practice.

Adjusted Pro-Forma Cash Profit information has also been provided to allow the market to better analyse the ongoing operations of the Group. Looking at a cash result basis (which excludes non-core items included in statutory profit), operating income was flat compared with last year at $20,577m, whilst expenses rose 11% to $10,422m and impairments rose 62% to 1,956m. This translated to a cash profit down 18% to $5,889m.

anz-fy16-2The total provision charge of $1.96 billion ($1.94 billion individual provision charge and a $17 million collective provision charge) equates to a loss rate of 34 basis point of which 3 bps is attributable to the recently announced settlement of the Oswal case. Gross impaired assets increased to $3.17 billion with new impaired assets up 3% compared to the prior half.anz-fy16-7
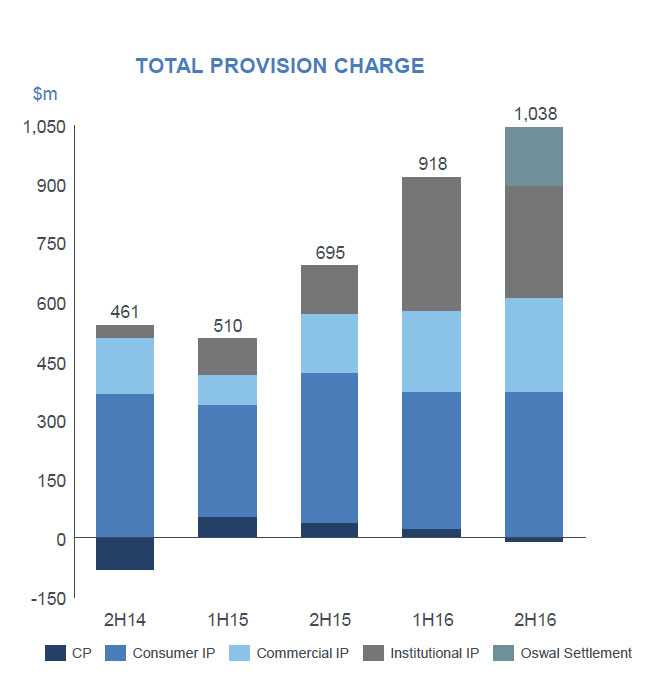
While in aggregate the credit environment is broadly stable, pockets of weakness continue to work their way through the economy, largely reflecting stress moving through the resources and resources related sectors. The stress appears to have now largely passed through the Institutional market and is progressively moving through the Commercial and Retail sectors. ANZ therefore expects provision charges to remain broadly the same in the 2017 Financial Year as a percentage of
gross lending assets.

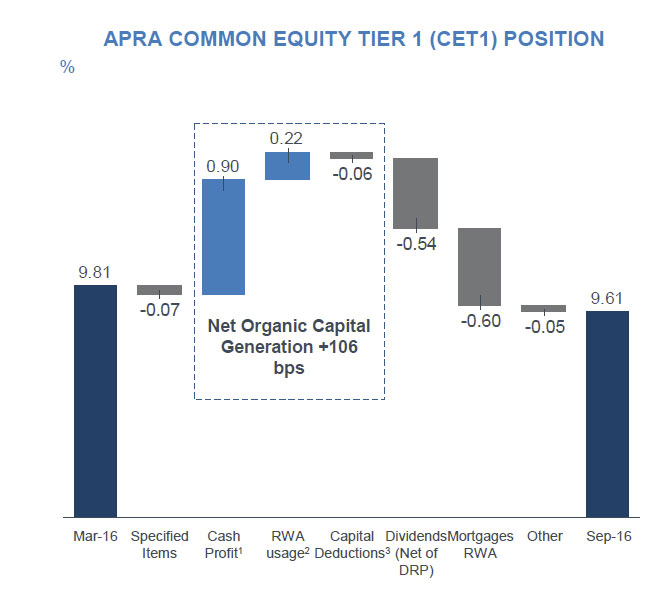
The APRA CET1 capital ratio at 30 September was 9.6% (14.5% on an Internationally Comparable basis). Organic capital generation of 106 basis points in the second half was 33 basis points higherthan the second half average of the past 4 years, primarily driven by Credit RWA reduction (excluding foreign exchange impacts) of $12 billion in the Institutional business.

anz-fy16-8The Final Dividend of 80 cents per share is the same as for the first half and is in line with guidance. The total dividend for FY16 of 160 cents per share represents a Dividend Payout Ratio of 81.9% on a Statutory Profit basis and 79.4%on a Cash Profit basis.

ANZ is gradually consolidating to its historical payout range of 60-65% of annual Cash Profit which ANZ believes provides a more sustainable base reflecting the greater demands for capital arising from increased regulatory requirements. On an Adjusted Pro-forma Cash Profit basis the Dividend Payout Ratio was 67.1%.

Looking at the segmentals, the Australian business grew income 8.8% to $9,365m, NZ 3.1% whilst the Institutional Bank income fell 6.1%.

anz-fy16-4
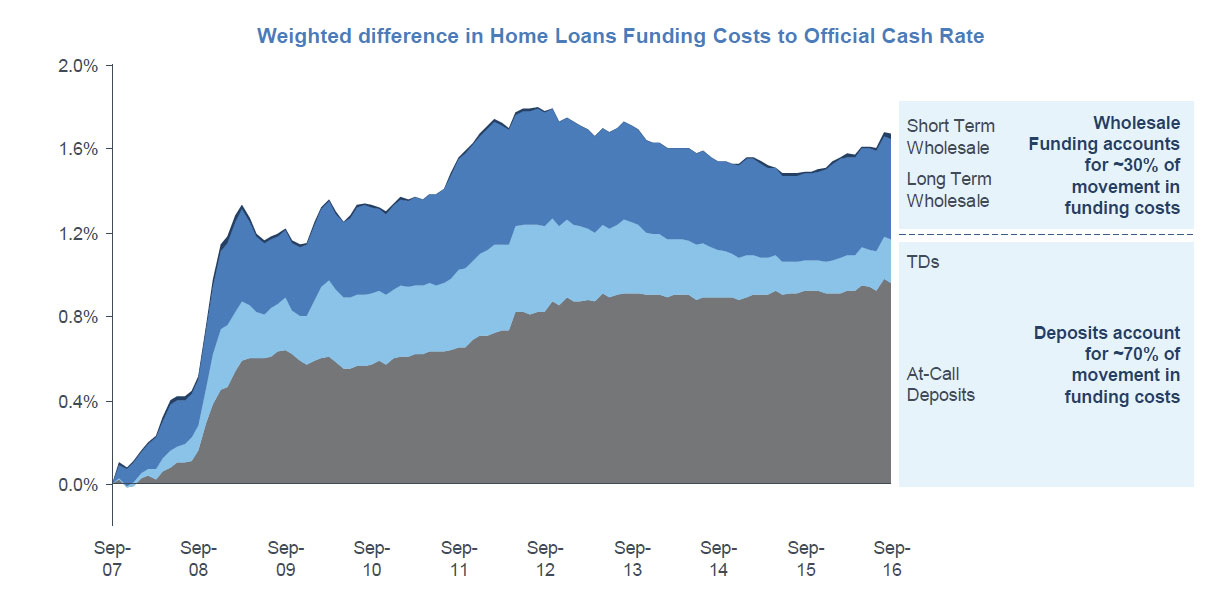
They highlight that mortgage funding costs rose, relative to the RBA cash rate, mainly thanks to increased competition for deposits.

anz-fy16-9
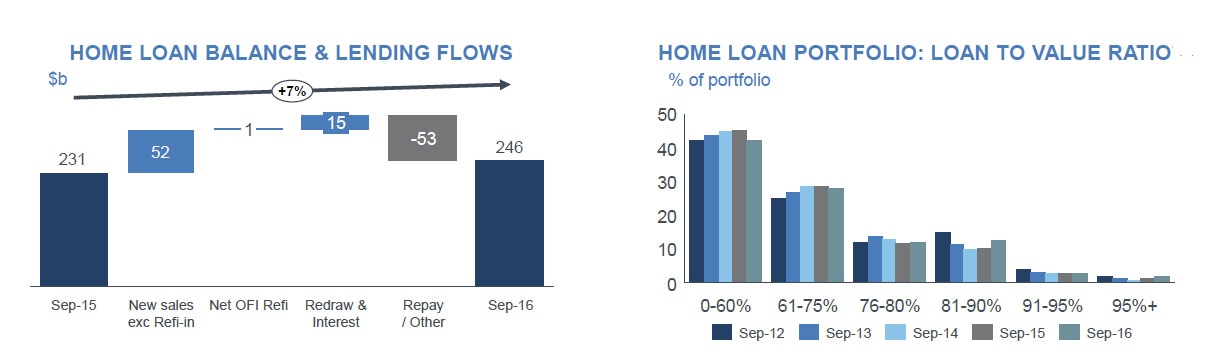
The Australian mortgage book grew 7%, but below system from $231bn in FY15 to $246bn in FY16. They increased their footprint in NSW and VIC, relative to WA and QLD. The mix of investor loans however fell, from 37% to 29% in FY16. 52% of loans are broker originated, up from 48% last year.  Mortgage lending now accounts for 62% of all Australian lending, up form 60% last year.

anz-fy16-10
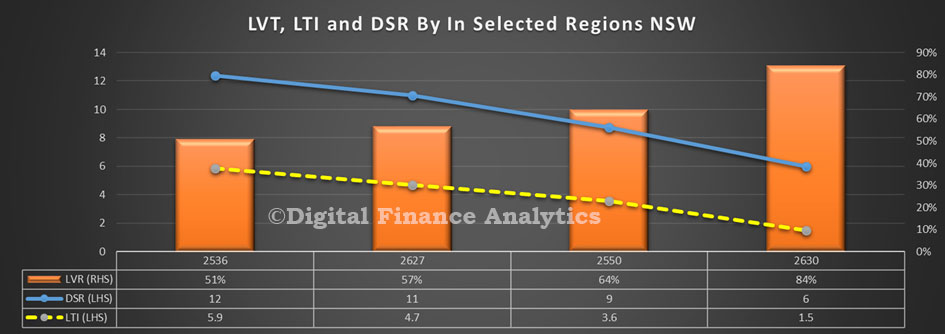
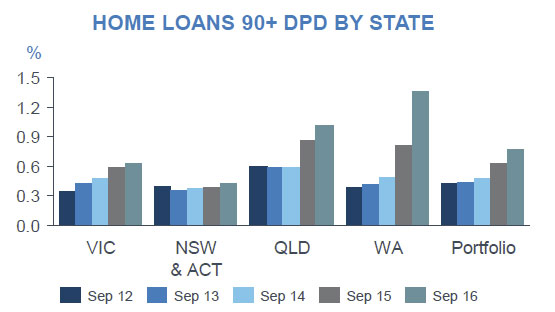
Looking at the mortgage portfolio, 39% of households are ahead with repayment, down from 42% last year. 37% are interest only loans (same as last year). Delinquencies vary by state, with a significant spike in WA and QLD.

anz-fy16-11They have made changes to their lending standards. In terms of serviceability, they now apply an interest rate floor to new and existing mortgage lending introduced at 7.25%. They introduced of an income adjusted living expense floor (HEM) and a 20% haircut for overtime and commission income, as well as increasing income discount factor for residential rental income from 20% to 25%

They changed their lending policy to include a LVR cap reduced to 90% for investment loans, LVR cap reduced to 70% in high risk mining towns, decreased maximum interest only term of owner occupied interest only loans to 5 years, withdrawal of lending to non-residents, limited acceptance of foreign income to demonstrate serviceability and tightened controls on verification and tightening of acceptances for guarantees.

[This of course won’t necessarily apply to loans already on book].

anz-fy16-123
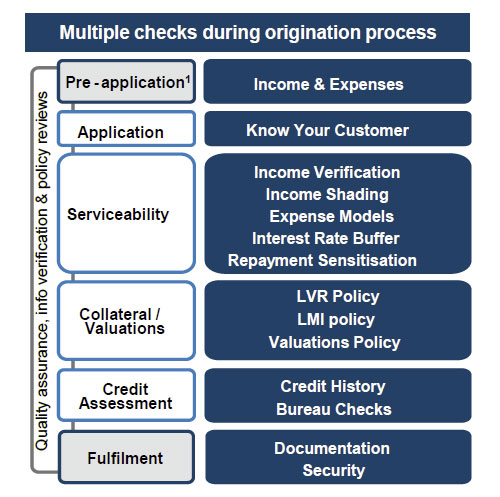
They say the end-to-end home lending responsibility managed within ANZ, they have effective hardship & collections processes, and ANZ assessment process apply across all channels.

Lack of cyber security knowledge leads to lazy decisions from executives

From The Conversation.

The numbers and size of cyber security attacks are increasing and Australia is one of the world’s largest targets. The Federal government noted the current impact of cyber attacks on the Australian economy is A$17 billion annually.

risk-pic-2

The reasons are many and include a lack of direction and commitment to understanding information security at the strategic level. Research from the Australian National University shows executive/board knowledge of cyber risks among medium sized businesses is inadequate and board-level governance of cyber security risks varies wildly between organisations. This is troubling given the ultimate accountability of board directors.

The report found that only 58% of cyber security professionals thought their board had a sufficient understanding of cyber risks. Less than half (46%) said their board discusses cyber security rarely or never. Almost a third (30%) even said their board does not receive reports of cyber threats to the company.

Research from Cambridge University and retail bank Lloyds, also shows this level of uncertainty is causing boards to realise they have no idea what they are dealing with and giving up. Boards are doing this by simply outsourcing the risk of a cyber attack through the purchase of cyber insurance. The report comments:

“The amount of cyber insurance being purchased in Australia [has] increased 168-fold (16,828%) in the last two years, as more and more businesses seek to protect their balance sheets from this emerging threat.”

The problem with this approach to cyber risk is that too little effort is being made to understand the value, control and cost of the information that an organisation holds.

Cyber insurance is a product that covers businesses for the risk of data breaches, employee errors in mishandling data and computer hacking attacks. It covers liabilities and the expense involved in responding to a cyber attack. For example, Sony estimated that it spent US$171 million in cleaning up after its PlayStation Network was famously hacked in 2011.

Simply outsourcing the risk of an attack by purchasing cyber insurance fails to protect an organisation’s reputation from repeated and sustained cyber attacks. Another problem is that the erosion of an organisation’s competitive advantage through the loss of trade secrets through cyber attacks, is difficult to measure and insure.

My research shows executives should be identifying the value and sensitivity of the information in their organisations. Only then can they make sensible decisions about what IT infrastructure should be used and whether to seek expert help by outsourcing.

However identifying all the information that an organisation holds is not as easy as it first sounds. For example, some business conversations take place on social media platforms such as LinkedIn. Businesses need to consider whether those conversations are within the realms of responsibility for employers and therefore if employees should be admonished or supported for holding these electronic conversations.

Organisations can sometimes hold vast pools of information that are secret. However holding sensitive, secret information that is non-strategic is costly and may be pointless. Consider for example a retail organisation that has an online ordering website. This sort of organisation shouldn’t be recording and holding the credit card details of customers, if it can be helped.

Outsourcing the payment for goods or services to finance service intermediaries makes good business sense. By not holding credit card details and effectively outsourcing that function, an organisation has made itself safer because it simply can’t end up on the front page of a newspaper for leaking credit card details.

Sometimes sensitive information is necessary for conducting business operations. If this is unavoidable, then organisations might need to ask whether the security controls they have in place to protect their sensitive information are enough. This might also extend to information being used by suppliers or customers.

If the assessment reveals that security controls are not enough, then a business case needs to be made for increased budget to the board. This may be costly, but if sensitive information is necessary for conducting business operations, then it must be protected and the security budget should be approved.

Retailer Target was affected by a point of sale cyber attack in 2013. Paul Miller/AAP

Organisations routinely fail to fully assess and protect against the risks introduced by storing or sharing information with other organisations. Examples include sharing with suppliers, customers, regulators and contract staff.

High profile cyber bungles from supplier-side attacks include the Target attack in December 2013, where the point-of-sale machines, supplied and operated by a third-party supplier, were infected with a virus that siphoned off all the credit card details of customers.

Board directors not taking the time to understand information security strategy can lead to a blanket approach of mitigating all risk of a cyber security attack by simply purchasing cyber insurance. This clumsy approach is not sustainable and consumers should be demanding more from our business leaders.

Author: Craig Horne, PhD candidate, Chairman of the Australian Computer Society in Victoria, University of Melbourne

Mortgage Delinquencies Continue To Rise

From The NewDaily

Stress cracks are starting to appear in the housing market with mortgage delinquencies rising to the highest level in three years. And in some states the number of people falling behind on payments has reached record levels.

The figures come from research produced by ratings agency Moody’s Investor Services and demonstrates that, despite record low interest rates, home buyers are facing an increasingly impossible stretch.

“The proportion of Australian residential mortgages that were more than 30 days in arrears rose to 1.50 per cent at 31 May 2016 compared to 1.34 per cent at 31 May 2015,” the report found. The agency warned investors that “the increase raises the risk of mortgage defaults and is therefore credit negative”.

WA, Tasmania and the Northern Territory have been hardest hit as their incomes have declined with the end of the mining boom. Delinquency rates there “climbed to the highest levels since our records began in 2005, while in South Australia, the delinquency rate was just 0.1 percentage point below the state’s record-high reached in April 2013”, Moody’s said.

1103delinquencyWA fared the worst with the delinquency rate increasing 0.69 percentage points to 2.33 per cent. In the epicentres of the housing boom, NSW and Victoria, things deteriorated, but more slowly.

Victorian arrears rates rose 0.08 percentage points to 1.4 per cent, while NSW saw delinquency up 0.04 percentage points to 1.05 per cent, the country’s lowest outside the public service bubble of the ACT.

Here's the delinquency deal.Here’s the delinquency deal

The fragility of the housing equation has been underlined by Moody’s research which highlights the yawning gap between income and house prices.

Home prices in Australia have risen 30.69 per cent over the three years to 31 August 2016 while average weekly earnings have increased only 5.06 per cent.

“The large differential between home price and wage growth – particularly in Sydney and Melbourne where home prices have increased the most – means that households have had to take on more debt to fund home purchases,” Moody’s warned.

Regulators look worried

The prospect of cracking what looks like an increasingly fragile property market has regulators worried and seemingly fearful about interest rate rises. The Australian Prudential Regulation Authority (APRA) recently delivered the banks what looks like a ‘get out of jail free’ card with its implementation of international rules around balanced funding.

The definition of the newly introduced Net Stable Funding Ratio, a measure designed to ensure banks rely more on deposits and less on volatile international bond markets for their funding, has been watered down by APRA in recent times.

Initially, APRA’s definition would have seen banks dramatically boost their reliance on customer deposits to fund their mortgage lending. But this reliance has been reduced by the final definition of the ratio, released after consultation with the banking industry, taking a less hardline stance against some assets.

“In particular, APRA has modified its proposed required stable funding for certain self-securitised assets and certain higher quality liquid assets in offshore jurisdictions,” the regulator said.

That means the change “will lift funding costs a little. But we will not see the strong hikes we were expecting to see three months ago”, analyst with Digital Finance Analytics, Martin North, told The New Daily.

It’s mortgage rates, stupid

Had that original hike taken place then mortgage rates would have risen on the back of hikes in deposit rates. And that is a much greater danger to the property market than the moderate rises in unemployment in the mining states.

“Those rises in mortgage arrears are not something we need to worry too much about at this stage. We would have much more to worry about if interest rates started to rise,” said Nicki Hutley, chief economist with Urbis group.

The fragile cocktail of rising house prices and ballooning personal debt levels has another ratings agency, S&P Global, worried. It has cut the ratings outlook from stable to negative on 25 Australian financial institutions, largely due to growing risks from the housing sector.

Household debt growth.

Those hit include larger institutions – such as AMP Bank, Macquarie, Bendigo and Adelaide, and Bank of Queensland – through to smaller credit unions, building societies and mutual banks.

“In our opinion, economic risks facing all financial institutions operating in Australia are rising due to the strong growth in private sector debt and residential property prices in the past four years, notwithstanding some signs of moderation in growth in recent months,” S&P said.

Household Debt Still Higher

In the latest edition of the RBA’s Chart Pack, we get an update of household finances to end October 2016. The debt to income ratio rose again, from 186 in June 2016, reinforcing the piles of debt household have. A record. How will this all get repaid given the current low levels of income growth?  Whilst low interest rates mean repayments are manageable at the moment, this will change if rates rise.

household-finances-nov-2016

Building Approvals Fall Again

The momentum of building approvals continued to ease in September especially in Sydney and Melbourne, indicating the massive construction bulge in residential building – especially apartments –  may be shrinking.

The latest data from the ABS show that building approvals to end September 2016 fell again. The trend estimate for total dwellings approved fell 0.6% in September and has fallen for four months. The seasonally adjusted estimate for total dwellings approved fell 8.7% in September and has fallen for two months.

Moreover, in seasonally adjusted terms, whilst private house approvals rose by 2.3% to 9,605, dwellings excluding houses, i.e. apartments, crashed by 16.3% to 9,166. Unit counts have been very volatile. In trend terms we are still building more units than houses nationally.

building-approvals-sept-2016Looking at the approvals (in original terms) across the main urban centres, in Greater Sydney approvals fell 16%, in Great Melbourne they were down 21%, in Great Brisbane they rose 12%, in Adelaide they were up 9%, whilst they fell in Perth.

building-approvals-sept-2016-stateThe trend estimate of the value of total building approved rose 2.1% in September and has risen for 10 months. The value of residential building fell 0.1% and has fallen for two months. The value of non-residential building rose 6.0% and has risen for eight months.

The seasonally adjusted estimate of the value of total building approved rose 29.9% in September following a fall of 7.7% in the previous month. The value of residential building fell 4.4% after rising for two months. The value of non-residential building rose 118.9% after falling for two months.

Where You Buy Matters

We did some specific research for a slot on ABC Radio in South Eastern Regional NSW, covering the regions around Cooma, Bega, Jindabyne, and Batemans Bay. Using data from our surveys we were able to pull out some insights into the property markets in these locations. Given the fixation elsewhere on capital city prices, it is worth remembering that the property market actually consists of a series of micro-markets, with very different characteristics and outcomes. Our research shows this nicely.

So, looking at the four markets, lets start with average home price trends.

south-pricesAt Cooma, the Capital of the Snowy Mountains, prices are on average around $240,000, though they have slipped a bit in the past year, with a fall of around 10%.

Bega, in the rural heartland of the Sapphire Coast, has an average price of around $300,000 with a small fall in the last year of around 3%.

Jindabyne which overlooks Lake Jindabyne near the Snowy Mountains has an average price of $430,000, and has seen a strong rise this year after a small fall last.

Finally, Batemans Bay, in an area surrounded by understated natural beauty, attracting everyone from watercolour artists and rock fishermen, keen surfers and fishing enthusiasts to families on holiday, has an average price of $330,000 up about 3% this year.   Units here rose around 1.3% to around $230,000.

The types of families vary across the region. For example, Jindabyne has many younger families, including those with growing kids, whereas Batemans Bay has an older population including many edging towards, or in retirement. Households in Bega and Cooma tend to be in the middle, with an average age of 51.

So now we look at the mortgage metrics for these areas. The loan to value ratio is highest in Cooma at 84%, reflecting some price falls, and larger mortgages. But the loan to income and debt servicing ratios are quite healthy, so there is little mortgage stress at current interest rates. It rates were to rise, that could change. Many of the properties here have been held for several years, so some capital value has been locked in, but capital growth remains limited.

Compare this with Batemans Bay. Here the LVR is significantly lower, at around 51%, but the DSR and LTI are higher. This reflects the more limited incomes many older households now have, despite the fact they still have an outstanding mortgage. There is more sensitivity to rising rates.  There have been more recent property transfers, and loan refinances.  We also see growth in the number of apartments in the region.

southHouseholds in Jindabyne have a higher debt service ratio, reflecting the larger mortgages required to purchase here compared with incomes. Again there is sensitivity to rising rates. The loan to income ratio is 4.7 on average.

We also found that demand along the coast is being supported by those from the cities buying a second property for holiday, or investment purposes, including the scenario where they grab equity from an existing Sydney property to fund the purchase. This illustrates the spillover effects of high Sydney prices.

So overall, property momentum in these regions does not mirror the growth rates in Greater Sydney, though there are some spillover effects. Property on the coast is in greater demand, including from investors, and many prospective local buyers are being priced out of the market. Some mortgage holders have quite a high debt burden, in terms of meeting repayments, and would be sensitive to rising rates.


Commonwealth Bank and Alipay to develop innovative payments solutions

Commonwealth Bank and Alipay, the world’s largest mobile and online payment platform, operated by Ant Financial Services Group, have signed a landmark Memorandum of Understanding (MOU) to deliver payment solutions that will benefit Australian and Chinese consumers and retailers.

cba-atm-pic

Under the terms of the MOU, the two companies will work together to make it easier for Australian consumers to pay for purchases made through Alibaba Group’s e-commerce websites, supported by Ant Financial’s payment infrastructure, including AliExpress, a platform for Chinese merchants to sell to global consumers.

Commonwealth Bank and Alipay will also work together on a simple payment solution that allows Chinese tourists and Chinese students to use Alipay in-store payments at Australian retailers.  This agreement allows both companies to leverage the strengths of their collective e-commerce capability and Commonwealth Bank’s Albert smart payment tablet, powered by the Pi platform.

Mobile payments in China have increased exponentially in recent years. Last year, China overtook the United States as the world’s largest market in mobile payments with a transaction volume of US$235 billion, and China is expected to process $6.3 trillion in mobile payments by 2020. Approximately 19,000 Chinese tourists visit Australia every week and spend almost $8,000 per person.

“Australia is a popular destination for Chinese travellers and Chinese students studying overseas. We want Alipay users to enjoy the kind of convenience they are used to at home. We are working with regional and global partners like CBA to make this happen,” said Douglas Feagin, Senior Vice President of Ant Financial Services Group and Head of Alipay International.

Kelly Bayer Rosmarin, Group Executive, Institutional Banking and Markets, Commonwealth Bank said “We are thrilled to be the first Australian bank to collaborate with Alipay in building an innovative payments solution that leverages our leading e-commerce and point of sale platforms. We are constantly working on payment solutions that offer flexibility and choice for our customers so the prospect of bringing them closer to a globally leading mobile payments provider, and its 450 million active users, is truly exciting.”

A Recipe To Tackle Housing Affordability

KPMG has released a brief report “Housing Affordability: What can be done about the Great Australian Dream? They exhibit greater joined up thinking than recent Government outings, because they include tax reform, supply of affordable housing and shared equity options as part of a reform package. It also shows how complex the issues are.  They say it should be a focus of public policy.

The missing piece of the puzzle though for me is property price sentiment. In a rising market, expectations of future price rises drive prices higher, and when two thirds of voters have direct interests in property and the wealth effect these price rises create, it would be a courageous politician who rocks the “magic pudding” boat! Rather they will tinker ineffectively at the margins.

There is no doubt that Australia is experiencing a worsening problem regarding housing affordability, a fact highlighted this week (24 October 2016) by the Federal Treasurer in a speech to the Urban Development Institute of Australia.

kpmgThe driver of reduced affordability has clearly been the rapid increase in the price of housing, relative to a more benign adjustment in household incomes.

Many of the drivers of house price increases and affordability pressures on some households are occurring globally, are largely macroeconomic and are the product of a complex interaction of demand and supply side factors, and no single policy intervention will address the entire issue.

About a decade ago KPMG Economics completed a detailed review into housing affordability in Australia. At the time we found that the change in median house prices were mostly influenced by the underlying strength of the economy, the performance of the share market, and the proportion of housing being purchased by investors relative to owner occupiers.

We have just re-investigated the relationship of median housing prices in Australia to the key drivers identified a decade ago and found GDP and investor activity remain key influences, but the share market no longer had such an influential role. However, wages, interest rates and housing supply are factors whose influence on house prices have strengthened over the past decade.

Average access to intergenerational equity – being the average amount of time a generation has access to potential wealth via inheritance from the immediately preceding generation – is anticipated to be greatest for ‘Baby Boomers’, and least for ‘Generation X’.

We are now seeing a change in behavior by current generations regarding home purchasing which is new compared to previous generations. That is, some young people are now collaborating to buy, some are assisted by parents, while others are simply choosing not to buy because they don’t want to be committed to a location for 30 years of a mortgage.

Low income households are only able to afford housing stock that is located on the fringe of cities, and even then this has become more difficult. However, this outwards push of the urban fringe also creates broader issues for society around provision of infrastructure into these ‘greenfield locations’, and the false economies associated with cheaper housing but more expensive private and public transport.

KPMG recognises the challenges associated with resolving the problem of housing affordability are complex and they involve a range of both supply and demand side factors. We have offered a number of solutions that provide a way forward for housing affordability to be improved on a permanent basis.

These include:

1. CGT reduction: reducing the capital gains tax discount from 50% to 25%, thereby making property investment marginally less attractive
2. Aggregate property tax: abolish stamp duty on the transfer of residential property and conflate rates, land tax, insurance taxes and emergency service levies into a new Property Services Tax
3. Systemic reforms aimed at maintaining the supply and diversity of land and housing in established and growth areas, through:
a) Set targets: a stronger role for target setting for “net additions to stock” to drive Local and State Government planning schemes;
b) Affordable product: target setting would also focus on encouraging greater diversity of housing stock and deliberately encouraging smaller, well designed affordable products;
c) Streamline planning: making further improvements to the planning system to capitalise on the Government’s planned use of structure plans as a means of reducing the holding costs associated with planning delays – and providing developers in both the private and public sector with greater capacity and incentives to bolster supply at times when the market is under substantial demand pressure;
d) Empower public supply: supporting a stronger role for government land authorities to focus on housing affordability for middle income households within the context of a broader sustainability agenda.
4. Targeted Reforms aimed at improving access to those groups who are the most excluded from affordable home ownership. This package would focus on:
a) More low cost housing: the production of a greater volume of more sustainable, well-designed, lower cost house and land packages;
b) Improve assistance: better targeting of existing State first home owner assistance to increase the overall value and impact of that assistance;
c) Promote shared equity: the introduction of a shared equity program with a percentage of that equity exempt from rental interest charges for the life of the loan or a part of it to be provided by Government and/or the private sector.

KPMG also believes that the solution for Australia must involve all levels of Government working together, given the factors driving the problems are not under the remit of any one level of government. It should be a priority area of public policy.

Housing risk a ‘credit negative’ for banks

As reported in InvestorDaily, high residential property prices and private debt levels have driven S&P Global Ratings to revise the credit outlooks for 25 Australian banks to ‘negative’.

short-fuse-pic

The credit ratings agency said that economic risks facing all financial institutions operating in Australia are rising due to the strong growth in private sector debt and residential property prices in the past four years, notwithstanding some signs of moderation in growth in recent months.

“Our base-case scenario remains that the growth in property prices and private sector debt will moderate and remain at relatively low levels in the next two years,” S&P said.

“However, in our alternative case, we assess that there is a one in three chance that the strong growth trend will resume and economic balances will continue to build, which in our view would increase the risks that a sharp correction in property prices could occur.

“In that event, credit losses incurred by all financial institutions operating in Australia would be significantly greater.”

If risks in the economy continue to grow – other things equal – the ratings agency expects to lower its assessment of the stand-alone credit profiles (SACPs) of all financial institutions operating in Australia.

S&P said it is revising its rating outlooks on 25 financial institutions in Australia to negative as it now sees a one in three chance that it would lower these ratings in the next two years. Outlooks on three Australian banks have also been revised from ‘positive’ to ‘developing’ for the same reason.

“The rating actions reflect S&P Global Ratings’ view that the trend in economic risks facing financial institutions operating in Australia has become negative,” S&P said.

The agency pointed to strong growth in private sector debt (to about 139 per cent of GDP in June 2016 from 118 per cent in 2012, or an annual average increase of 5.2 percentage points) coupled with an increase in property prices nationally (average inflation-adjusted increase for the past four years was 5.3 per cent nationally) as the key drivers of a potential increase in “imbalances” in the Australian economy.

“Consequently, we believe the risks of a sharp correction in property prices could increase and if that were to occur, credit losses incurred by all financial institutions operating in Australia are likely to be significantly greater; with about two-thirds of banks’ lending assets secured by residential home loans,” S&P said.

“The impact of such a scenario on financial institutions would be amplified by the Australian economy’s external weaknesses, in particular its persistent current account deficits and high level of external debt.”

However, S&P’s base case considers that the growth in private sector debt and property prices will moderate and remain relatively low in the next two years.

Increasing apartment supply in Sydney and Melbourne, regulatory pressures on lending practices and capital, and recent trends (including declining sales volumes in the secondary market) should help moderate the growth in property prices and household debt, according to the ratings agency.

“Nevertheless, in our alternative case, we consider that there is a one in three chance that the strong growth trend will resume within the next year, because in our view several other important factors that have supported the past trend are likely to persist,” S&P said.

“[These include] low interest rates, a relatively benign economic outlook, and an imbalance between housing demand and supply; in addition, Australian banks could possibly target higher lending volumes to offset pressures on their earnings growth.”