Mortgage Reclassification Still An Issue

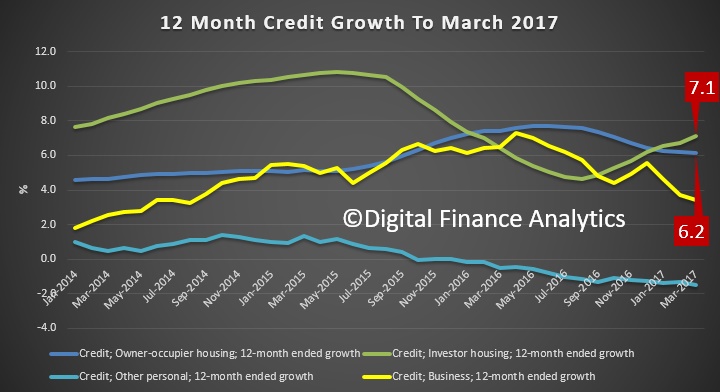
The RBA said recently, when they released their credit aggregates to end March, that $51 billion of loans have been switched from investor to owner-occupier, with $1.2bn in March.

Following the introduction of an interest rate differential between housing loans to investors and owner-occupiers in mid-2015, a number of borrowers have changed the purpose of their existing loan; the net value of switching of loan purpose from investor to owner-occupier is estimated to have been $51 billion over the period of July 2015 to March 2017, of which $1.2 billion occurred in March 2017. These changes are reflected in the level of owner-occupier and investor credit outstanding. However, growth rates for these series have been adjusted to remove the effect of loan purpose changes.

With the current balance of investor loans sitting at a record $577 billion, nearly 10% of the book has been switched to lower owner occupied rates. We of course cannot tell if this switching is legitimate, or opportunistic to get a lower interest rate and helpfully reduce the bank exposure to investor loans. The RBA data shows strong “corrected” investor growth of 7.1%, higher than owner occupied loans.

According to a report in the Australian today:

Responding to questions on notice from a Senate economic committee hearing, APRA said the switching “highlighted that some (lenders) have not had ­sufficiently robust practices” for monitoring the status of their borrowers and the data previously submitted to the regulator was “incorrect”.

APRA forced several banks to upgrade their reporting capabilities and, as a result, “some have strengthened their procedures”.

Tasmanian senator Peter Whish-Wilson, who asked APRA if its data was accurate, said the ­reclassification of loans was “concerning, whether it’s deliberate or not”.

He said: “I’d be loathe to see if any sort of systemic changes by the banks to loan classification were made to continue to grow loans to investors when it’s clear APRA is trying to crack down on what is potentially a very serious issue.”

Mortgage Stress On The Radio

I had the chance to discuss our latest mortgage stress research with Jon Faine on ABC Radio Melbourne today.

The ABC also did an on-line segment based on the interview:

Almost 52,000 Australian households are at risk of defaulting on their mortgages in the next 12 months and a quarter of home owners are under home loan stress, a data analyst has said.

Key points:

  • Mortgage stress now spreading to more affluent areas, researcher says
  • Half of people under financial strain don’t have a budget, survey finds
  • WA, Victoria and Queensland leading the way on default risk

According to Digital Finance Analytics (DFA), 767,000 households were in mortgage stress in April, meaning they had little leeway in their finances, up from 669,000 the previous month.

Of those, it said 32,000 were in severe stress and unable to meet repayments with their current income.

It estimated almost 52,000 households were at risk of defaulting in the next year.

“It’s a concerning trend, and it’s a growing trend, and essentially there’s quite a smattering [of households under stress] across the country,” DFA’s principal Martin North told ABC Radio Melbourne.

    “What’s significant about the research is it isn’t just in the usual suspects, in other words the mortgage belt, the battling areas you might expect.

“We’re seeing households in all sorts of different areas now experiencing quite some difficulty in just managing their mortgage repayments.”

Traditionally well-off suburbs like Hornsby in Sydney, Brighton in Melbourne and Mount Claremont in Perth were also seeing high levels of stress.

The data was drawn from household surveys conducted by DFA, data from the Reserve Bank, the Australian Bureau of Statistics and APRA.

WA, Victoria lead the way on default risk

Of the 20 postcodes with the most risk of default, the majority fell in WA, followed by Victoria and Queensland.

Mr North said in New South Wales mortgage stress was spread out in a number of different areas, compared to Victoria’s, which was more concentrated in its booming growth suburbs.

Postcodes with high default risk:

  • WA – Mandurah, Wanneroo, Canning Vale, Beeliar
  • VIC – Derrimut, Point Cook, Werribee, Cranbourne, Craigieburn
  • QLD – Mackay, Carrara, Nerang, Hervey Bay, Toowoomba

    In those states, and around Brisbane, stress was related to flat incomes, big mortgages and rising costs of living exacerbated by investors.

    “While the economic indicators are reasonably good in Victoria, if you actually look at real incomes, they are actually not great. The cost of living is growing faster in Victoria than elsewhere,” he said.

In NSW, high home values have pushed up repayments. Mr North also highlighted high childcare costs as a particular problem.

“In WA, we’ve got prices falling significantly and unemployment rising. It’s pretty scary what’s happening there,” he said.

In some parts of Queensland it’s a similar story to the west. Home values, employment and incomes are falling in the resource-heavy areas like Mackay and the Bowen Basin.
What should you do if you’re in mortgage stress?

Mr North said there were a few things you could do if you were struggling, or to avoid getting into trouble.

Set out a clear budget so you know what you’re spending on
Prioritise what you spend money on
Go to the bank for help

“Only half the households we surveyed actually have a formal household budget, so they know what they’re spending and what they’re earning, and some people don’t want to look and some never bother,” he said.

“Make some choices about where to spend your money. Some people would say things like high-speed internet connectivity on your phone and all those sorts of things are really critical. But is it as critical as paying that mortgage?”

He said banks were obligated by law to help those struggling with their repayments.

    “Many people think it’ll be OK and just muddle on through, what I would say is if you’re in difficulty have a conversation with your bank and see what can be done,” he said.

“But many people muddle along for too long and get to a point where they have no choice but to sell.”

Big loans, flat wages driving financial troubles

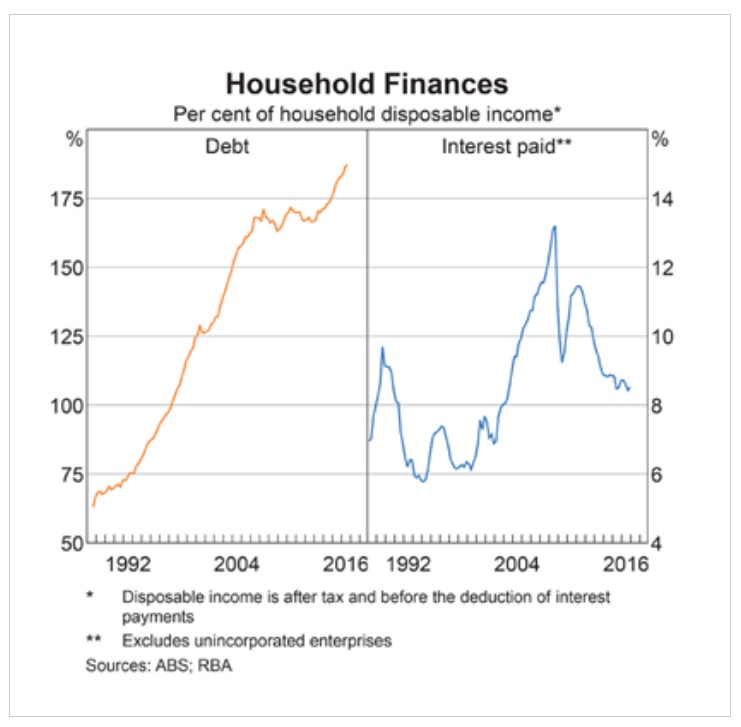
Mr North said household debt in Australia was higher than ever before, combined with the growing cost of living.

“Prices have been rising significantly and people have been reaching for ever-larger mortgages to get into the market, so people have fundamentally bigger debts than previously,” he said.

“What we’re finding is things like childcare costs, school fees, rates, all those things have gone up a lot and then the fact that these larger mortgages, because prices have gone up, are being impacted by interest rate rises.

“Don’t underestimate the small, incremental interest rate rise translating into quite a big dollar-a-month increase when you’ve got a big mortgage.”

Mr North said the issues stemmed from the combination of underemployment and stagnant wages.

“In the early 2000s when we had very strong property price growth and mortgage growth we had very, very strong income growth to match, so essentially things worked OK,” he said.

“But this time around we’ve got a combination of very large mortgages, but income [is] static or falling in real terms and that’s the difference.

“What that means is this is not going to get worked out anytime soon, so all this talk about housing affordability and helping new people get into the market are missing the key point.

“These are people in the market now with their properties, dealing with these mortgages, dealing with the day-to-day issues of trying to manage their finances and it’s really tough.”

The Affordability Conundrum

We have highlighted the rise in mortgage stress. We identified rising mortgage rates, underemployment, higher costs of living and flat incomes as causes of stress. But we need to stop and ask how come more households are under mortgage pressure than ever?

After all, lenders should have been operating with at least a 2.5% buffer between the mortgage rate offered and the rate they use for affordability assessment, and they should be looking at the household spending to ensure they can afford the loan. Failure to do this would make the loan “unsuitable” and under the lending provisions if loans were not made in compliance with the responsible lending provisions, the borrower can dispute the loan.

Mortgage stress should just not be as high as it is these guidelines were followed. Whilst interest rates have moved from their lows, thanks to out of cycle rises, (which in sum for owner occupied borrowers amount to around 30-40 basis points, whereas interest only loans, and investor loans are now 75-100 basis points) are still well within the 2.5% mortgage affordability rate buffer.

To try and unpick this, we have been looking at real household expenditure budgets from our core market model (using our surveys and other data), and comparing this with the standard Household Expenditure Measure (HEM) used by the banks.

HEM is based on more than 600 items in the ABS Household Expenditure Survey (HES). The HEM is calculated as the median spend on absolute basics (food, utilities, transport, communications, kids’ clothing) and the 25th percentile spend on discretionary basics, which includes expenses like alcohol, eating out and childcare. Non-basic expenses, for example overseas holidays, are excluded from calculations.

The National Consumer Credit Protection Act regulations say that whilst banks may use a HEM to guide the analysis, they must still do more complete analysis and validate the expenditure profile by looking at statements and other evidence. Relying on HEM is not sufficient.

Whats interesting about this is that APRA said last year:

On the expense side, the major differences across ADIs seen in the original exercise related to whether the ADI used a benchmark living expenses measures, such as the Household Expenditure Measure (HEM), the customer’s own reported expenses, or a more targeted calculation of the benchmark.   Most people have a hard time actually estimating their own living expenses, so the customer-declared figure may not be particularly accurate. However, the basic benchmark measures are also simplistic; scaling expense assumptions to the borrower’s income level (and potentially other factors including geography) is a more realistic and prudent approach.

About half of the ADIs in our exercise were still using the basic HEM, but others have moved to implement more sophisticated approaches or are in the process of doing so. At a minimum, all ADIs now reflect the customer’s declared living expenses where these are higher than the benchmark.

A strong alignment between the HEM calculation and the final expenses assessment might be a warning of expenses being understated.

Regulators said recently that there was often a “coincidental” alignment between HEM and actual costs, especially for more affluent purchasers.

So we obtained some HEM data for a typical household in our survey, and compared the HEM output with the data on real expenditure, using the same basis of calculation as HEM.

We found that in all states except SA, the standard HEM understated household expenditure significantly, net of mortgage payments, many were more than 10% higher. ACT, WA and NSW had the highest divergence. So did lenders make sufficient allowance to actual spending in the current low growth, higher cost of living environment?
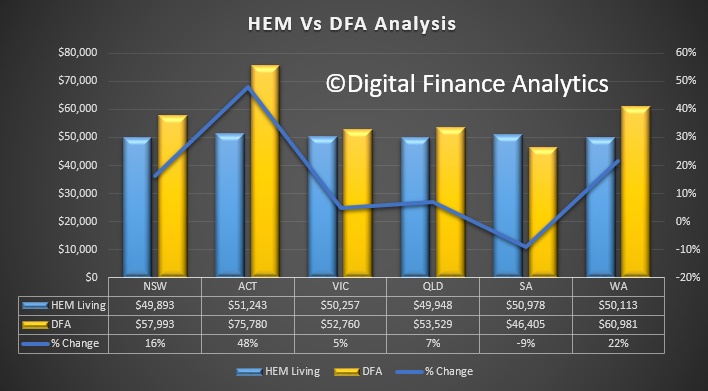
If not, or if HEM had been used, households might have obtained a larger mortgage than could comfortably be serviced.

So, we need to ask – why the variation between HEM and reality? We suggest it may be a combination of:

  1. Households incomes being squeezed as costs rise and underemployment rises (households are not generally reassessed in flight by the banks)
  2. Banks were too generous in their initial affordability assessments and did not take actual spending sufficiently into account.
  3. Households did not fully disclose costs and banks did not fully check them out. HEM became the default.

Finally, we also looked across our household segments, and found that (no surprise) expenses of more affluent households were significant higher.
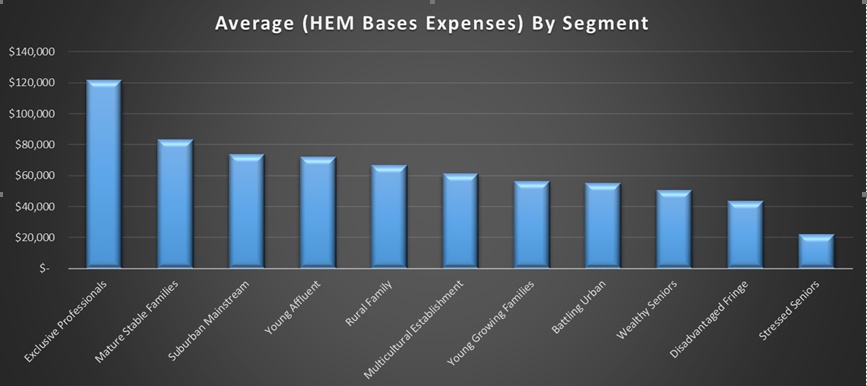
This helps to explain why we are seeing more affluent households getting into mortgage stress territory.

Should banks be obliged to review household spending patterns on a recurring basis, rather than at mortgage underwriting time? Is there  merit in the regulators looking in more detail at the extent to which all lenders (including non-banks) are compliant. We suspect some lenders have been too willing to operate on lower spending buffers to enable a deal to be done.

Borrowers of course should not borrow just because the bank says they are willing to lend to a certain level. Households should prepare their own budgets and include allowance for higher mortgage rates and rising living costs. They may get a smaller loan as a result, but they will be more secure in a rising market.

Our industry contacts suggest that many lenders are reviewing their spending assessment, and that more details and granular information is now been used. However, this may nor help those who got bigger loans in easier conditions as affordability bites.
Personal Insolvencies Higher

According to The Australian Financial Security Authority, Total personal insolvencies increased by 10.8% in the March quarter 2017 compared to the March quarter 2016.

All types of personal insolvency increased:

  • bankruptcies increased by 2.5%
  • debt agreements increased by 20.8%
  • personal insolvency agreements increased by 139.5%.
  • All states and territories experienced increases in total personal insolvencies. The largest absolute increase was in Western Australia (197 personal insolvencies) and the largest proportional increase was in Australian Capital Territory (32.6%).
  • Total personal insolvencies are the highest on record in Western Australia, with 928 personal insolvencies in the March quarter 2017.
  • Debt agreements in the March quarter 2017 are the highest on record at 3,584 for the quarter. This follows the largest quarterly increase ever (548 compared to the December quarter 2016). Debt agreements reached record highs in Victoria, Queensland, South Australia and Western Australia.

Total personal insolvency activity

The number of personal insolvencies in the March quarter 2017 (7,900) increased by 10.8% compared to the March quarter 2016 (7,129). The March quarter 2017 is the eighth consecutive quarter in which total personal insolvencies have risen year-on-year.

Total personal insolvency activity in Australia: % change compared to same quarter in previous year

MQ17 Total personal insolvency activity in Australia % change compared to same quarter in previous year

MQ17 Total personal insolvency activity in Australia % change compared to same quarter in previous year

All states and territories recorded year-on-year increases in total personal insolvencies in the March quarter 2017. The largest absolute increases were in Western Australia (197 personal insolvencies), Queensland (170 personal insolvencies), New South Wales (127 personal insolvencies) and Victoria (124 personal insolvencies). The largest proportional increases were in Australian Capital Territory (32.6%), Northern Territory (29.8%) and Western Australia (26.9%).

The quarterly increase of 845 personal insolvencies in the March quarter 2017 (compared to the December quarter 2016) is the first since the June quarter 2016. The quarterly total remains below the peaks reached in 2008–09 and 2009–10 (above 9,000 personal insolvencies).

Bankruptcies

The number of bankruptcies increased by 2.5% in the March quarter 2017 (4,225) compared to the March quarter 2016 (4,123), and also increased by 6.3% compared to the December quarter 2016 (3,976). The quarterly increase in bankruptcies in the March quarter 2017 is the first since the June quarter 2016.

The increase in bankruptcies in the March quarter 2017 compared to the March quarter 2016 was the result of increases in the states and territories of:

  • Australian Capital Territory (41.5%)
  • Northern Territory (30.0%)
  • Western Australia (14.9%)
  • Tasmania (8.0%)
  • South Australia (6.6%)
  • Queensland (1.3%).

These were offset by decreases in:

  • New South Wales (-1.9%)
  • Victoria (-0.5%).

Bankruptcies in Australia: % change compared to same quarter in previous year

MQ17 Bankruptcies in Australia % change compared to same quarter in previous year

MQ17 Bankruptcies in Australia % change compared to same quarter in previous year

Debt agreements

The number of debt agreements increased by 20.8% in the March quarter 2017 (3,584) compared to the March quarter 2016 (2,968), and also increased by 18.1% compared to the December quarter 2016 (3,036).

The rise in debt agreements in the March quarter 2017 compared to the March quarter 2016 was the result of increases in all states and territories:

  • South Australia (41.7%)
  • Western Australia (39.1%)
  • Tasmania (35.7%)
  • Northern Territory (25.0%)
  • Victoria (19.5%)
  • Australian Capital Territory (18.8%)
  • New South Wales (15.9%)
  • Queensland (15.6%).

The increase in debt agreements in the March quarter 2017 is the seventh consecutive year-on-year rise.

Debt agreements in Australia: % change compared to same quarter in previous year

MQ17 Debt agreements in Australia % change compared to same quarter in previous year

MQ17 Debt agreements in Australia % change compared to same quarter in previous year

Personal insolvency agreements

Quarterly personal insolvency agreement levels fluctuate proportionally more than those of bankruptcies and debt agreements as levels are relatively small.

The number of personal insolvency agreements increased by 139.5% in the March quarter 2017 (91) compared to the March quarter 2016 (38), and also increased by 111.6% compared to the December quarter 2016 (43).

The rise in personal insolvency agreements in the March quarter 2017 compared to the March quarter 2016 was the result of increases in all states and territories:

  • Western Australia (240.0%)
  • Northern Territory (200.0%)
  • Victoria (162.5%)
  • New South Wales (100.0%)
  • Queensland (100.0%)
  • Tasmania (100.0%)
  • South Australia (50.0%)
  • Australian Capital Territory (increase to 3 personal insolvency agreements from 0).

The rise in personal insolvency agreements is the third consecutive year-on-year rise.

Personal insolvency agreements in Australia: % change compared to same quarter in previous year

MQ17 Personal insolvency agreements in Australia % change compared to same quarter in previous year

MQ17 Personal insolvency agreements in Australia % change compared to same quarter in previous year

Wealthy feel pinch of housing costs as one in four Australians face mortgage stress

From The Guardian Australia.

The burden of housing costs is biting even in Australia’s wealthiest suburbs as an unprecedented one in four households nationally face mortgage stress, according to the latest in a 15-year series of analyses.

Households in Toorak and Bondi, prestigious pockets of affluence in Australia’s biggest cities, have made the list of those struggling to meet repayments amid rising costs and stagnating wages, research firm Digital Finance Analytics has found.

The firm’s principal, Martin North, said it was surprising new evidence showed that financial distress from property price surges reached beyond “the battlers and the mortgage belt” and was a “much broader and much more significant problem”.

The survey, which analyses real cash flows against mortgage repayments, finds more than 767,000 households or 23.4% are now in mortgage stress, which means they have little or no spare cash after covering costs.

This includes 32,000 that are in severe stress, meaning they cannot cover repayments from current income.

The firm predicts that almost 52,000 households will probably default on mortgages over the next year. Risk hotspots include Meadow Springs and Canning Vale in Western Australia, Derrimut and Cranbourne in Victoria, and Mackay and Pacific Pines in Queensland.

Overall, New South Wales and Victoria, whose capital cities have seen a recent surge in home prices, accounted for more than half the probable defaults (270,000) and households in mortgage distress (420,000).

North said the numbers were “an early indicator of risk in the system”.

The underlying drivers were “flat or falling wage growth”, much faster rising living costs and the likelihood mortgage interest payments would only go up.

Widespread mortgage burdens were limiting spending elsewhere and “sucking the life out of the economy”, and the problem should be addressed to head off a housing crash and its repercussions, North said.

“If we start seeing house prices slipping then this can turn into a US 2007 scenario rather quickly,” he said.

North is not alone in highlighting household vulnerability. The Reserve Bank of Australia’s financial stability review last month observed one-third of Australian borrowers had little or no mortgage “buffer”, which North said was “the first time they’ve ever admitted it”.

Finder.com last week found 57% of mortgagees could not handle a rise of $100 or more in monthly repayments.

“The surprising thing is that people in Bondi in NSW, for example, or even young affluents who have bought down in Toorak in Victoria are actually on the list [of mortgage stressed],” North said.

“The reason is they’ve bought significantly large mortgages to buy a unit, modified or brand new.

“They’ve got bigger incomes than average but essentially they are highly leveraged so they have little wiggle room and of course any incremental rate rise, because they’ve got such big mortgages, slugs them pretty heavily.”

Semi-retirees who moved to central coast NSW but are still exposed to large mortgages while their incomes were falling away were another atypical snapshot of those in financial distress, North said.

“And the people at the top, the most affluent households, the ones who’ve got really big properties, have the lifestyles to match. So again, their spare cash is not huge.

“And that point – it isn’t just the mortgage belt, it isn’t just the typical battlers who are actually exposed here – shows is a much broader, more significant problem.”

Genworth Under Pressure

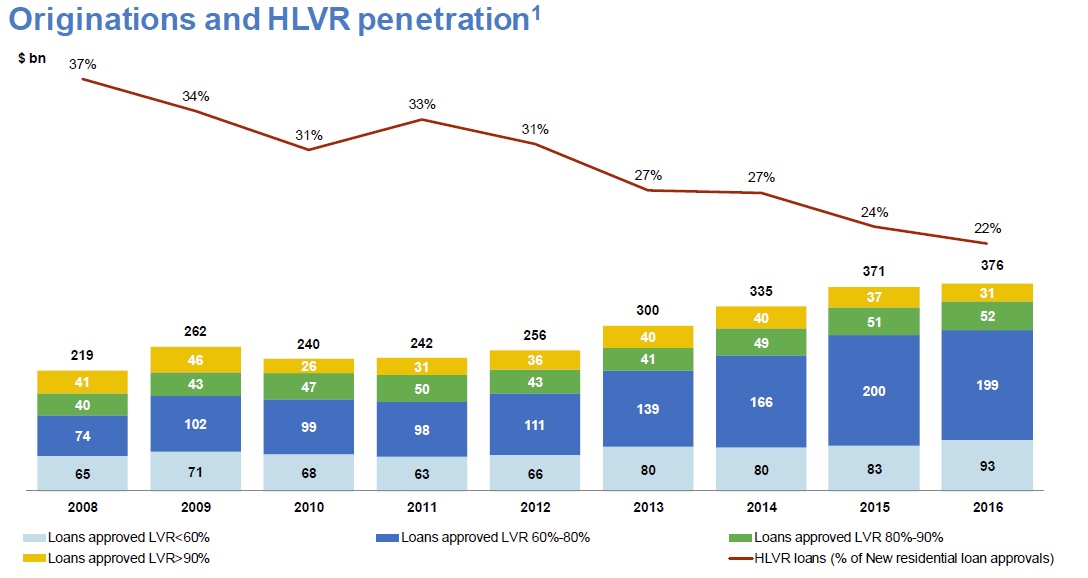
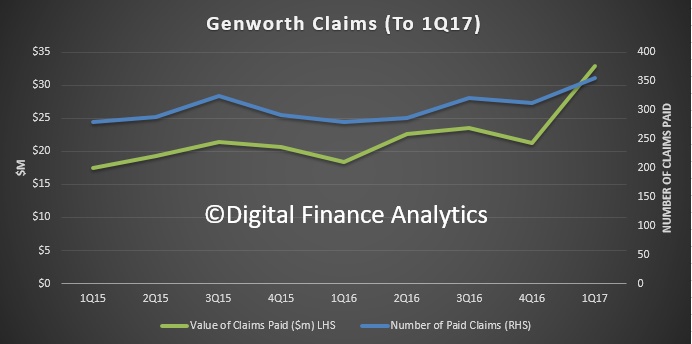
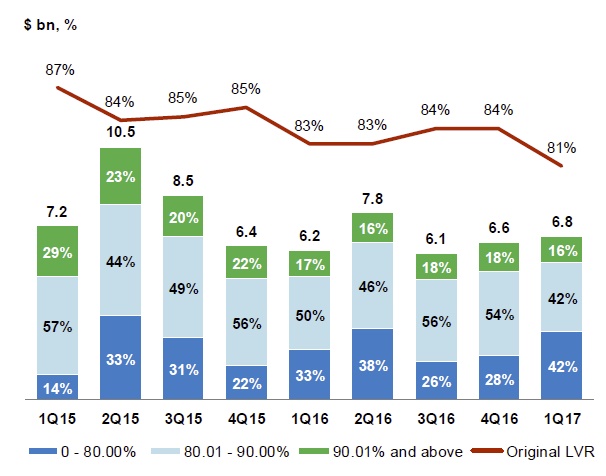
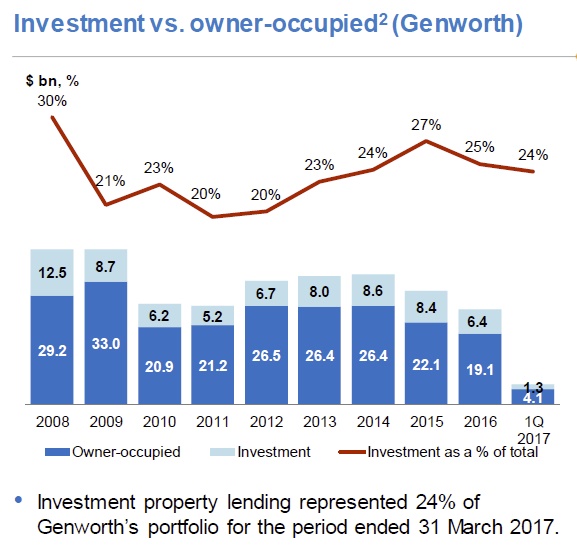
Lender Mortgage Insurer Genworth reported today, and gives a good snapshot of what is happening in the mortgage market.  The volume of new higher LVR loans (HLVR) is falling.  Claims are rising.  But capital ratios remain strong, they have lifted premiums and are exploring new business opportunities.

They showed that claims volumes and value paid rose.

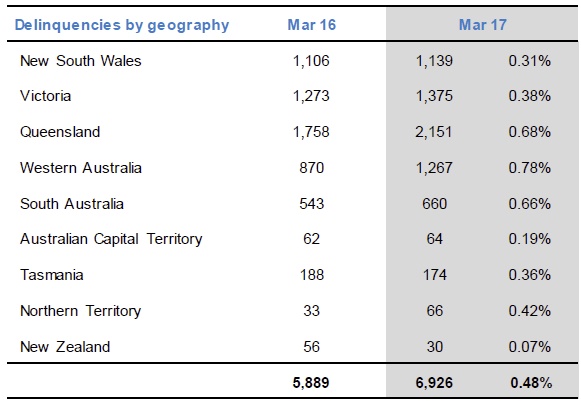
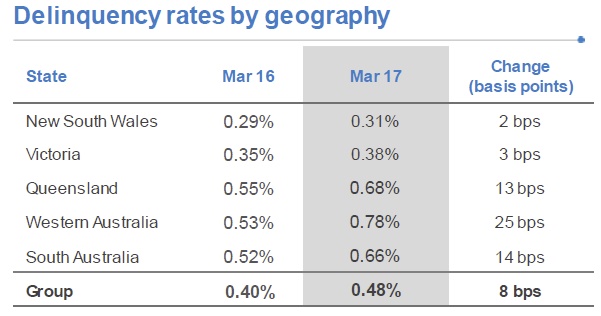
Within their book, delinquencies were at 0.78% in WA, whilst QLD had the largest number, and 0.68% of book.

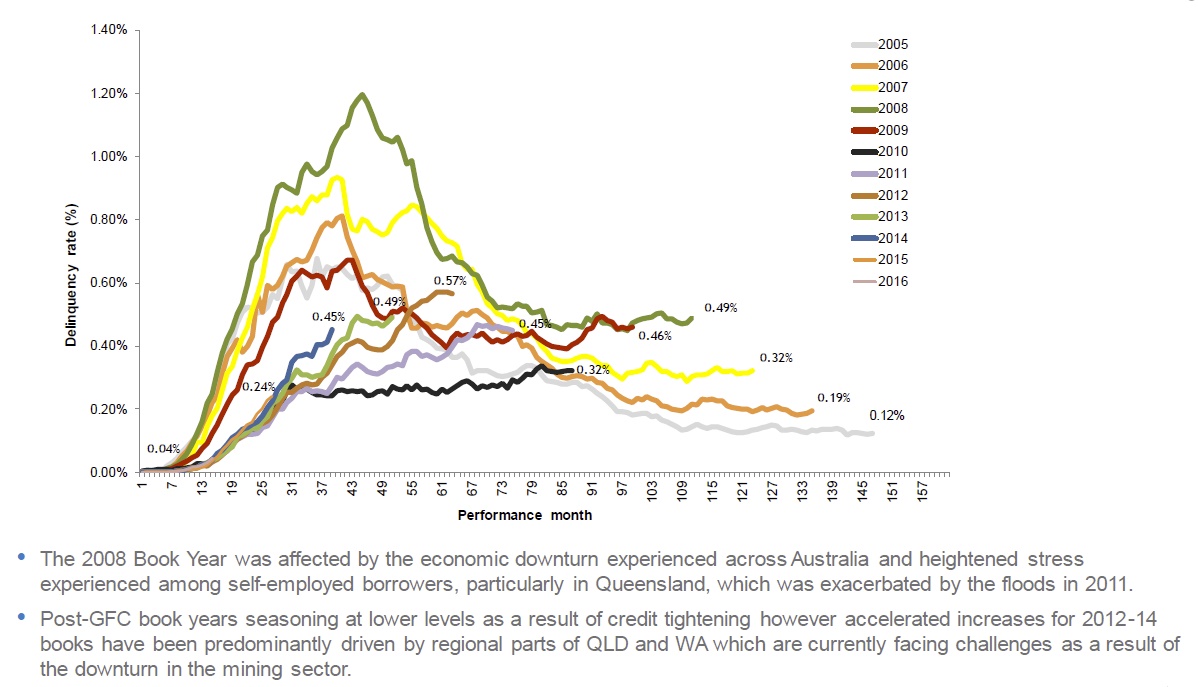
They make the point that 2008 is a problem year.

Genworth Mortgage Insurance Australia Limited (Genworth) has reported statutory net profit after tax (NPAT) of $52.2 million down 22.4% on 1Q16, and underlying NPAT of $68.3 million for the quarter ended 31 March 2017, up 10.7% on 1Q16.

New business volume, as measured by New Insurance Written (NIW), increased 9.7 per cent to $6.8 billion in 1Q17 compared with $6.2 billion in 1Q16. The result included $1.3 billion in bulk portfolio transactions.

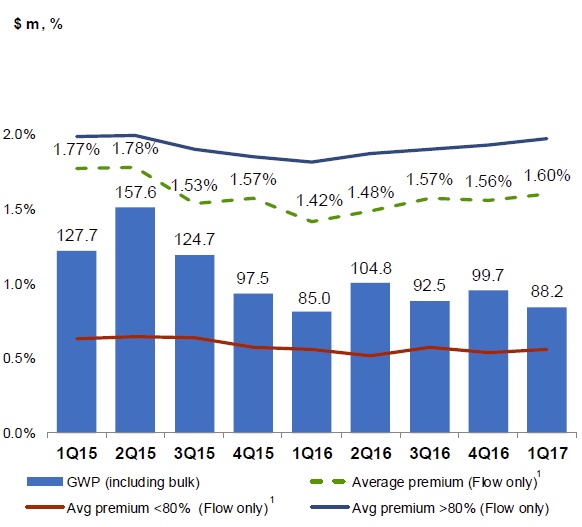
GWP increased 3.8 per cent to $88.2 million in 1Q17. This reflects a higher LVR mix of business compared with the same quarter in 2016 and the impact of the premium rate actions taken in 2016.

Reported NPAT includes after-tax mark-to-market loss of $16.1 million on the investment portfolio.

Net Earned Premium (NEP) of $107.9 million in 1Q17 decreased 4.9 per cent compared with $113.5 million in 1Q16 reflecting lower earned premium from recent book years.

The expense ratio in 1Q17 was 25.2 per cent compared with 23.4 per cent in 1Q16.

The loss ratio was 34.8 per cent in 1Q17, up from 27.0 per cent in 1Q16, due to lower NEP, an increase in the number of delinquent loans relative to a year ago and a higher average paid claim amount.

New South Wales and Victoria continue to perform strongly. However, the performance in Queensland and Western Australia remains challenging and delinquencies are elevated due to the slowdown in those regional and metropolitan areas that have been previously benefited from the growth in the resources sector.

As at 31 March 2017, the Company had invested $207 million in Australian equities in line with the previously stated strategy to improve investment returns on the portfolio within acceptable risk tolerances. After adjusting for the mark-to-market movements, the 1Q17 investment return was 3.14 per cent per annum, down from 3.55 per cent per annum in 1Q16.

Genworth previously announced that the exclusivity agreement for the provision of LMI with its second largest customer was terminated in April 2017. The Company has been successful in entering into new business with that customer that assists them in managing mortgage default risk through alternative insurance arrangements.

Genworth also advises that its customer, the National Australia Bank, has issued a Request For Proposal relating to its LMI requirements. The Company has submitted its proposal and will provide updates as to the outcome of its proposal.

Genworth continues to pursue other profitable opportunities in the market that meet its risk appetite and return on equity profile.

Overall, the Company expects GWP in 2017 to be below 2016 levels, down between 10 per cent and 15 per cent, subject to the timing and extent of any changes in the customer portfolio. Genworth expects 2017 NEP to decline by approximately 10 to 15 per cent and for the full year loss ratio to be between 40 and 50 per cent. The Board continues to target an ordinary dividend payout ratio range of 50 to 80 per cent of underlying NPAT.


Murray slams Medcraft for “political agenda”

From Australian Broker.

The head of the financial systems inquiry, David Murray, has publicly criticised chairman of the Australian Securities & Investments Commission (ASIC) Greg Medcraft for overreaching in what Murray phrased as bank bashing.

In an interview on Sky News Business, Murray responded to comments made by Medcraft welcoming tighter controls on banks to limit cross-selling.

These recommendations were “outside the intent” of the inquiry’s original product intervention power with Medcraft “well and truly” exceeding the mandate set for him, Murray said.

“By attacking vertical integration of the banks, he’s picking up a political agenda and running with it. For the regulators, that is the wrong thing to do.”

The topic of bank bashing was also raised after Medcraft’s comments of the Australian banking oligopoly were raised.

“I think we should put in context what the banks actually do,” Murray said. “Whilst the structure is oligopolistic, that’s not uncommon in Australia. We have two major airlines, we have a small number of [major] retail landlords, we have a small number of integrated transport companies, and on it goes.”

There is a need to “start building and stop bashing,” Murray said.

“You cannot have a large number of small, badly rated banks borrowing in foreign markets to intermediate the current account deficit. We need a small group of strong banks to do that.”

The act of bank bashing leads to systemic risk as this can lead to a fall in bank ratings, he said.

“If there’s a political agenda for a Royal Commission – that is a Royal Commission that you have to have when you don’t really need one – the Commission can go searching for solutions that we don’t really need either.”

The current environment had already put a number of “dark clouds” on the banks that need not be there, including the present housing issue, Murray added.

“If foreign investors in banks and foreign lenders to our banks believe that that’s an added layer of risk and their credit ratings could slide further than the Commonwealth government, we are then inducing a price spiral which will hurt the economy deeply.”

“This bank bashing is really helping people think that a Royal Commission is necessary. It’s not necessary.”

Brokers have ‘important role to play’ for stressed households

From The Adviser.

Mortgage brokers have an important role to play for the increasing number of households experiencing mortgage stress, as they are a “very good source of advice” according to a market analyst.

Around 52,000 households are now at risk of default in the next 12 months, according to mortgage stress and default modelling from Digital Finance Analytics for the month of April.

The modelling revealed that across the nation, more than 767,000 households are now in mortgage stress (669,000 in March) with 32,000 of those in ‘severe’ stress. Overall, this equates to 23.4 per cent of households, up from 21.8 per cent on the prior month.

Speaking to Mortgage Business, Digital Finance Analytics principal Martin North remarked that mortgage brokers have a role to play for stressed households in terms of helping them “find their way through the maze”.

“Maybe that’s a restructure, maybe it’s a different type of loan… I think [brokers] are a very good source of advice for households and for people who come and seek guidance [for example] refinancing may help,” Mr North said.

In saying this, Mr North noted that when it comes to identifying an appropriate loan for customers, brokers should remain “conservative” in their estimation of what households can afford.

“Don’t encourage households to borrow as big as they can. That 2 to 3 per cent buffer is really important, and those spending and affordability calculations are really important.

“There’s an obligation both on brokers and on lenders to do due diligence on borrowers to make sure that they’re not buying unsuitably, and that includes detailed analysis of household expenditure.

“My observation is that some of those calculations don’t necessarily get to the real richness of where households are at, so I think that all those operating in the market need to be aware of the fact that how we look at spending becomes really important on mortgage assessments.”

Mr North added that brokers should operate on the assumption that rates and the cost of living will continue to rise, while incomes remain static.

“So, don’t try and flog that bigger mortgage,” he recommended. “I would say be conservative in your advice and the structure of the conversation you have.”

The latest results of Digital Finance Analytics’ mortgage stress and default modelling are “not all that surprising”, Mr North said, considering that incomes are static or falling, mortgage rates are rising, and the cost of living remains “very significant” for many households.

“All those things together mean that we’ve got a bit of a perfect storm in terms of creating a problem for many households,” he said, adding that for many households, any further rises in mortgage rates or the cost of living would be sufficient to move them from ‘mild’ to ‘severe’ stress.

“It doesn’t take much to tip people over the edge. It takes about 18 months to two years between people getting into financial difficulty and ultimately having to refinance or sell their property or do something to alleviate it dramatically, so I think we’re in that transition period at the moment as rates rise… over the next 12 to 18 months my expectation is that we would see mortgage stress and defaults both on the up.”

According to Mr North, Digital Finance Analytics’ data uses a core market model, which combines information from its 52,000 household surveys, public data from the RBA, ABS and APRA, and private data from lenders and aggregators. The data is current to the end of April 2017.

The market analyst examines household cash flow based on real incomes, outgoings and mortgage repayments. Households are “stressed” when income does not cover ongoing costs, rather than identifying a set proportion of income, (such as 30 per cent) directed to a mortgage.

Talk of a property slowdown is just ‘propaganda’

From The New Daily.

A senior property data expert has warned Australians not to fall for “propaganda” claiming the Sydney and Melbourne housing markets have already cooled.

Louis Christopher, head of SQM Research, said all available data contradicted rival firm CoreLogic, whose numbers last week sparked dire headlines and talk of a market crash.

Even Treasurer Scott Morrison cited CoreLogic’s numbers on Friday to argue the housing market needed a “scalpel, not Labor’s chainsaw”.

“The concern here is that we’ve actually had the Treasurer refer to the index, basically to imply that he doesn’t really need to do that much more on affordability,” Mr Christopher told The New Daily.

“It couldn’t be further from the truth. Our opinion is that the market continues to boom and APRA [Australian Prudential Regulation Authority] will likely have to step into the market later this year.

“This is being used as propaganda, as an excuse for people to hold back from taking real action in the market.”

Unlike CoreLogic, SQM Research calculated that asking prices for houses rose over the last month by 1.1 per cent in Melbourne and 2.2 per cent in Sydney, coupled with steadily falling property listings and strong auction clearance rates around 80 per cent.

Falling listings were probably a sign that vendors were “holding back” because they expected prices to rise even higher, Mr Christopher said.

asking-prices-syd-melb-sqm

This is in stark contrast to CoreLogic, which estimated that Sydney’s dwelling values fell 0.04 per cent last month, while Melbourne grew by just 0.5 per cent. According to its index, combined price growth in the capital cities was the slowest month-on-month since December 2015.

CoreLogic is the most widely cited property pricer, at least among journalists, because it reports dwelling values daily and weekly. Its data formed the basis of most headlines reporting a ‘slowdown’ or ‘peak’.

However, CoreLogic’s own research director, Tim Lawless, urged “caution” last week about over-interpreting the company’s April numbers. He told The New Daily “potentially there is some seasonality creeping into these numbers”, as the index is generally moderated in April and May.

The Reserve Bank dumped CoreLogic as a data source last year over concerns about its methodology.

corelogic dwelling values

Mr Christopher said while the data continued to paint a picture of a booming market, he did not rule out a “slowdown” later in 2017, especially if regulator APRA cracks down further on bank lending.

By “real action” on affordability, he meant a temporary cut to immigration; incentives for migrants to move to regional areas; and the replacement of state-imposed stamp duties with a federal land tax.

Dr Stephen Koukoulas, an economist, warned that calling the end of the boom now would be “extremely premature and arguably a bit hazardous”.

He admitted he had been caught out “badly” in years past by making too much of month-to-month CoreLogic fluctuations, and urged others not to repeat the mistake.

“If we get another month of zero, well, the story builds. But so far I don’t think we’ve seen enough concrete evidence to say definitively this is the end of the boom,” Dr Koukoulas told The New Daily.

He also warned that vested interests could use CoreLogic’s numbers for their own ends.

However, the economist agreed the markets would eventually cool, perhaps as early as the second half of 2017.

“Look, it is going to cool, it is going to slow down, because it can’t keep going at that pace. There’s the APRA changes, many rate hikes by the banks, an oversupply in Brisbane apartments and Perth’s still looking dreadful,” Dr Koukoulas said.

“But to say there will be minus signs and a genuine ‘bust’, ‘correction’ or ‘slump’, that’s not going to happen. Or at least, I’d want to be see more evidence.”

An ideal scenario would be for price growth to stagnate at zero per cent in Sydney and Melbourne for the next five years while wages grow by 2 or 3 per cent (up from the current 1.2 per cent), he said.

“There is a problem in house prices in Sydney and Melbourne – there’s no question, I don’t think. Saving a deposit is difficult, even though once you’ve got the deposit you’re okay.”