Interesting post from the Federal Reserve Bank of ST. Louis, shows that Counties with severe declines in housing net worth during the 2007-09 recession experienced larger declines in employment.
The U.S. national labor market has recovered from the effects of the 2007-09 recession. The national unemployment rate was 10 percent at the end of 2009 but now stands at only 4.7 percent, which the Federal Open Market Committee considers close to the rate’s long-run value.1 Despite the national labor market recovery, significant regional variation remains. Recent economic research highlights links between regional labor and housing markets. This essay examines the recent recession and recovery by plotting county-level unemployment rates and changes in houses prices and finds a negative correlation between the two.
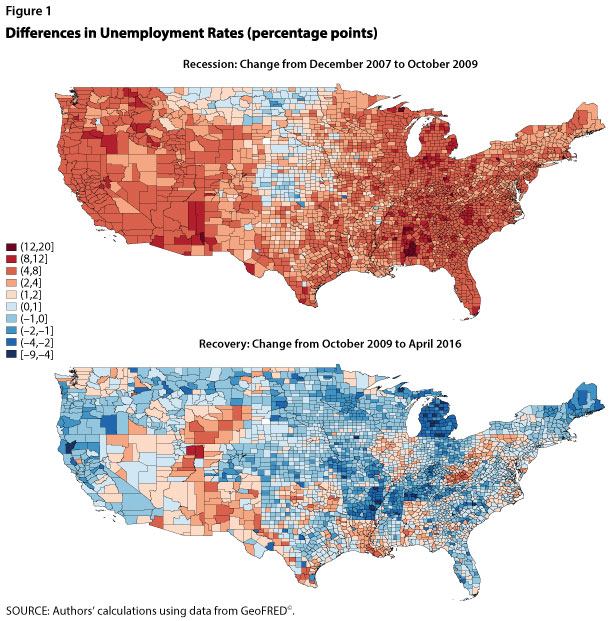
National unemployment reached its pre-recession low in December 2007, with the unemployment rate in 1 in 3 counties below 4 percent. Regions with higher unemployment rates included the West Coast, Central South, and Upper Peninsula of Michigan. The Midwest and South, from Minnesota to Texas, had the lowest unemployment rates—below 3.5 percent in most counties. As the recession deepened, unemployment rates rose until only 1 in 15 counties remained below 4 percent. Figure 1 shows the percentage-point changes in county-level unemployment rates from the pre-recession low to the peak of the U.S. unemployment rate (December 2007 to October 2009) and from the peak to the most recent data (December 2007 to April 2016). Shades of red (blue) indicate increases (decreases) in county unemployment rates.2 As shown in the top panel, by October 2009, the unemployment rate in most counties increased between 4 and 20 percentage points. The areas with higher unemployment rates before the recession experienced larger increases in unemployment during the recession. For a strip of counties in the Midwest, the unemployment rate remained low, increased only slightly, or even declined.
As shown in the bottom panel of Figure 1, although some county-level unemployment rates remain slightly above their pre-recession levels, most have recovered to or below those levels. As prior to the recession, the unemployment rate in about 1 in 3 counties is below 4 percent. The unemployment rates in most counties in Arizona, New Mexico, Nevada, and Utah remain above their pre-recession levels, while counties in the Midwest remain mostly below their pre-recession levels.
Why did unemployment rise so severely in some areas but stay low in others? One explanation may be related to the elasticity of the housing supply. Gascon, Arias, and Rapach (2016) argue that areas with an inelastic housing supply (i.e., the supply does not respond much to changes in house prices) are more vulnerable to recessions and experience worse downturns than areas with a more elastic supply. An inelastic housing supply leads to larger house price drops and declines in net worth during downturns, leading to larger declines in local consumption spending that further depress the local economy. Mian and Sufi (2014) show that counties with severe declines in housing net worth during the 2007-09 recession experienced larger declines in employment.3
We illustrate this correlation using county-level house price data from the CoreLogic Home Price Index. The scatter plots in Figure 2 show for the two periods noted above, respectively, the percent change in county house prices relative to the percentage-point change in the county unemployment rate, weighted by the county population in 2007.4 The size of each dot represents the county population. The figure shows a strong negative correlation between changes in house prices and changes in the unemployment rate: During the recession, counties with larger decreases in house prices experienced larger increases in the unemployment rate (left panel), while during the expansion the opposite has been true (right panel).
Notes
1 For Federal Open Market Committee projections, see https://www.federalreserve.gov/monetarypolicy/fomcprojtabl20160316.htm.
2 We downloaded county-level unemployment data from GeoFRED® and then applied the Census Bureau’s X-13 ARIMA seasonal adjustment program to look at percentage-point changes in the unemployment rate from peak to trough and from peak to peak.
3 Mian and Sufi (2014) show that housing net worth mostly affects nontradable employment, or employment in industries that are not tradable outside the local labor areas. For example, restaurants and retail shops are nontradable, while agriculture production is tradable.
4 Because county-level house price data are not as available as unemployment rate data, fewer counties are included in Figure 2 than Figure 1. House price data were also seasonally adjusted using the Census Bureau’s X-13 ARIMA seasonal adjustment program. April 2016 is the most recent month for which county-level house price data are available.


