
The CBA have released their full year results to June 2016. They announced a statutory net profit after tax (NPAT) up 2% to $9,227 million, Cash NPAT up 3% to $9,450 million, Cash return on equity of 16.5%, down 170 basis points and cash earnings were $5.55 per share, same as last year. All pretty much as expected, so no surprises, but some signs of stress ahead.
The Fully franked final dividend is $2.22 per share, taking the full year dividend to $4.20, flat on the prior year, and representing a cash dividend payout ratio of 76.5%.
However, looking below the hood, operating income was up 5%, helped by volume growth, and trading income, but hit by a 2 basis point NIM fall.
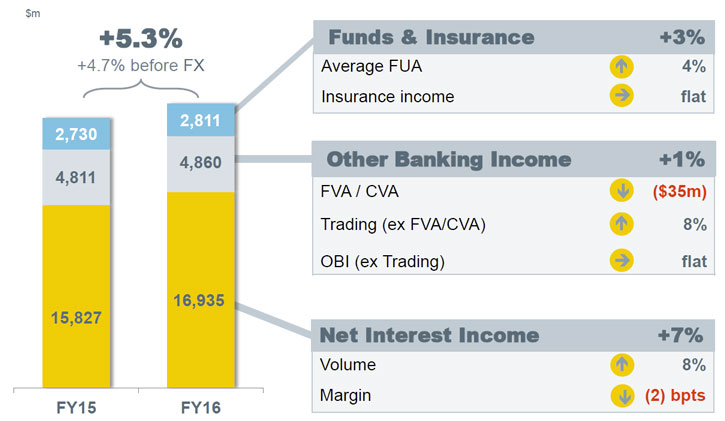 Net interest income was up 7% to $16,935m, net interest margin was down 2 basis points to 2.07%.
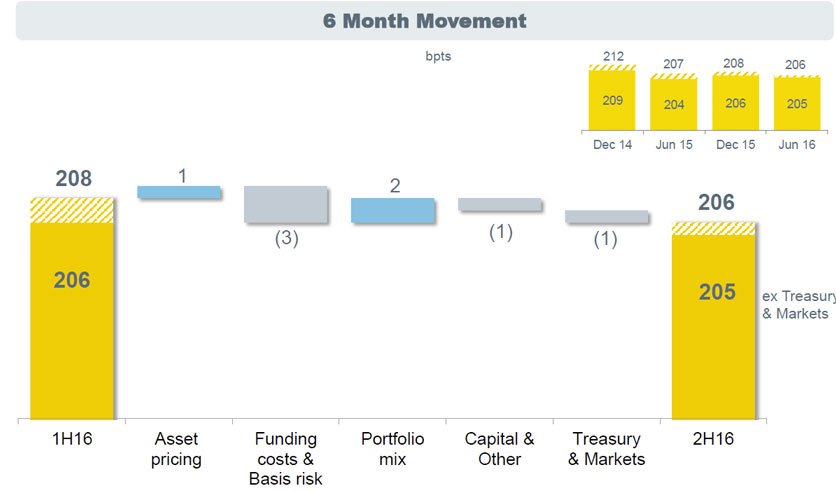
 Comparing the two half years, asset pricing was up 1 basis point, reflecting keen competition in the mortgage sector, funding costs rose, thanks to elevated short term costs, the portfolio mixed helped, thanks to savings growth, and capital and treasury fell thanks to the impact of lower rates. The last six months is the better indicator of future trends.
 Customer deposits were $518 bn, up 8%, and represents 66% of total funding, up 1% from last year. They have 11.3 million deposit customers.
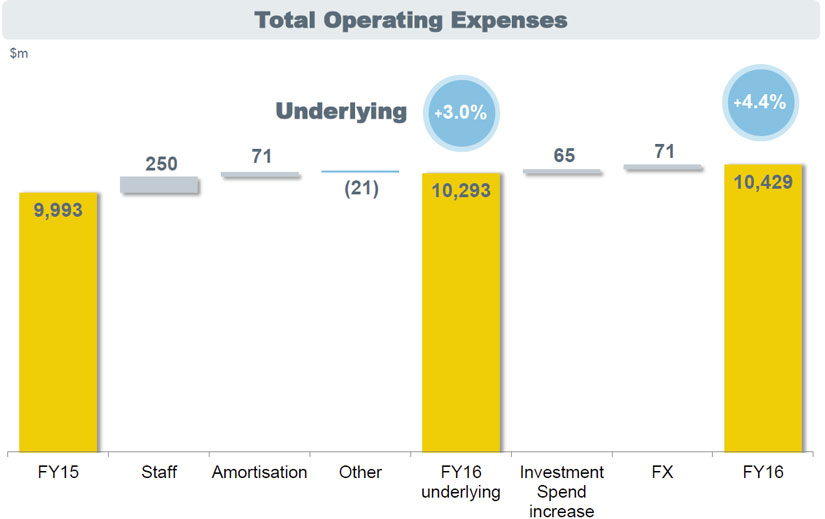
Operational expenses rose 4% to $10,429m, with an improved cost to income ratio of 42.4%, down 40 basis points.
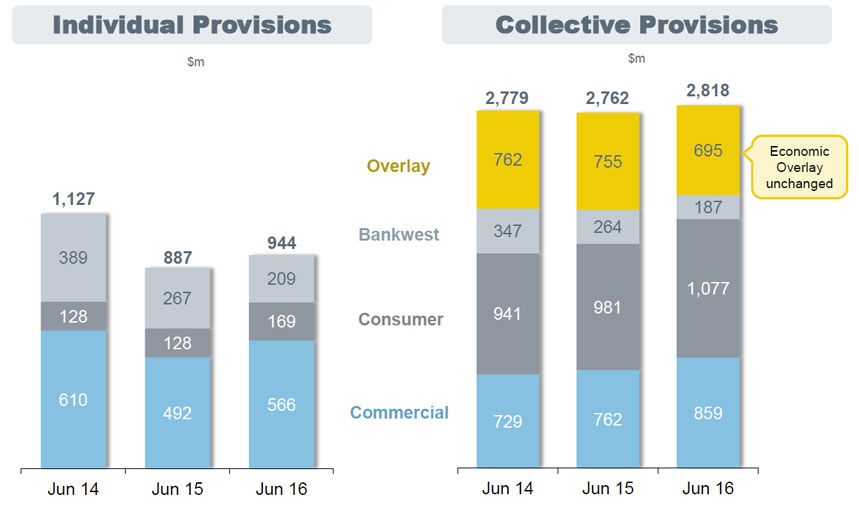
 Loan impairments were up 27%, thanks to higher provisioning for resource, commodity and dairy exposures.
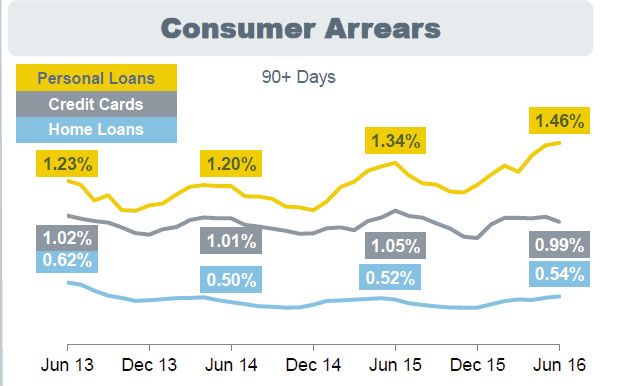
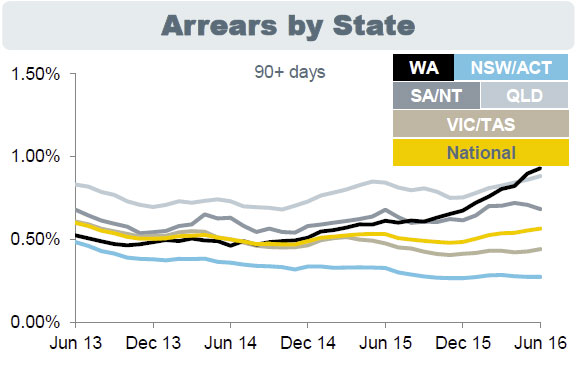
 Home Loan arrears were stable year on year. WA and QLD portfolios continue to experience stress, mainly due to mining towns, while NSW improved. Personal Loan arrears remain elevated mainly due to economic worsening in WA and QLD.
 The state differences are clear – here is the home loan book arrears by state.
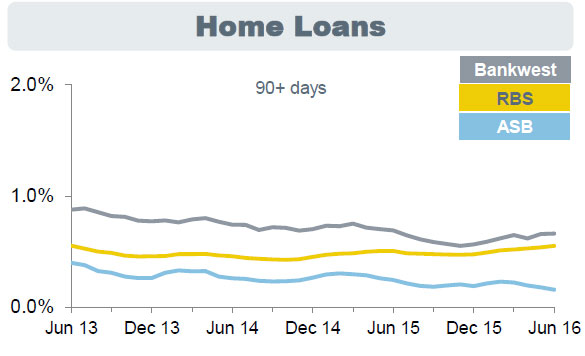
 Bank West has the higher delinquency rates.
 Investment loans are performing better than other mortgage loans.
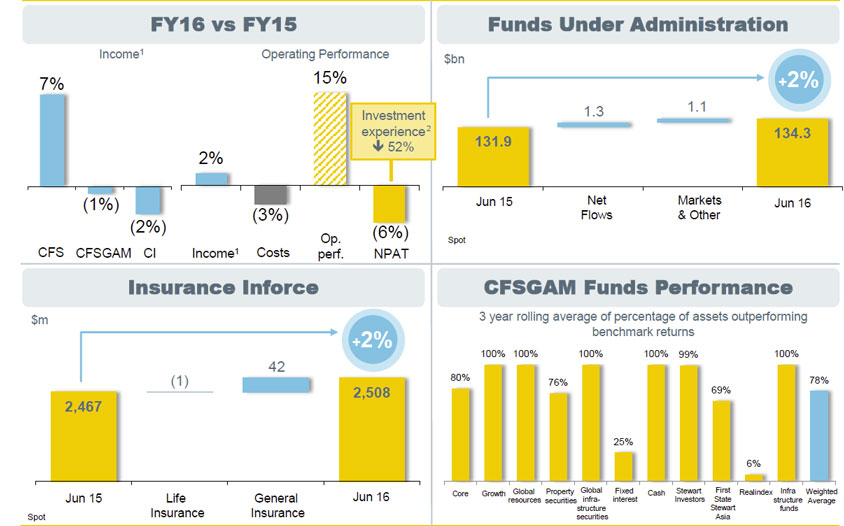
Wealth, showed a rise in funds under management, but compared with FY15, investment experience fell.
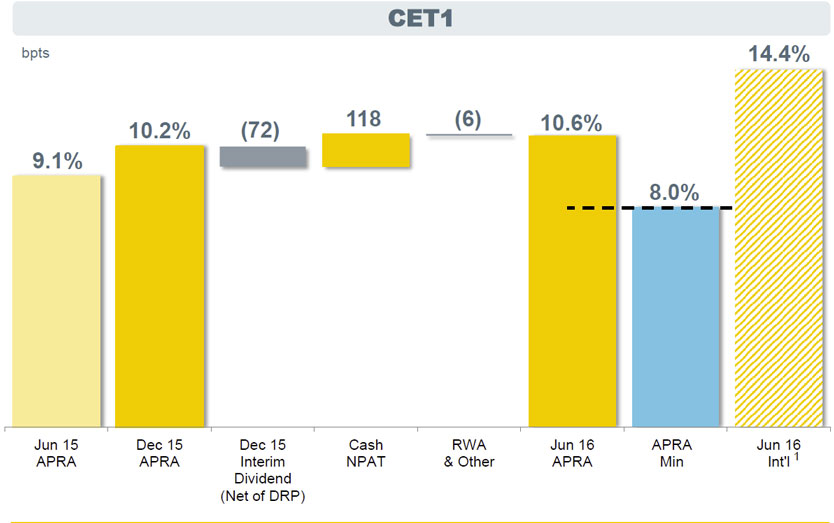
During the financial year, the Group responded to increased regulatory capital requirements and raised $5.1 billion through an entitlement offer for all shareholders. As at 30 June 2016, the Group had a CET1 capital ratio of 10.6% on an APRA basis, up from 9.1% as at 30 June 2015; and a CET1 capital ratio of 14.4% on an internationally comparable basis up from 12.7%. They claim to be well within the APRA top quartile.
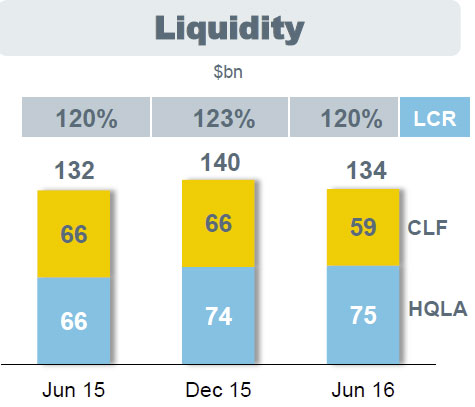
 The larger capital base impacted return on equity which was down 170 basis points to 16.5%. Liquid assets of $134 billion and a Liquidity Coverage Ratio of 120%.
 The APRA leverage ratio is calculated at 5%.