From the Bank Underground Blog.
Uncertainty is in the spotlight again. And the MPC believe it is an important factor influencing the slowdown in domestic demand (August 2017 Inflation Report). Previous work by Haddow et al. (2013) has found a composite aggregate indicator of uncertainty combining several different variables that does appear to have explanatory power for GDP growth; but as Kristin Forbes notes these measures correlate better with consumption than investment. So in this blog post, we look at firm-level data to explore measures of uncertainty that matter for how firms invest in the United Kingdom. Our aggregate measure of uncertainty has a better forecast performance for investment than the composite aggregate indicator does.
Uncertainty is difficult to define, and since it is unobservable, it is hard to measure. It is correlated with other factors that drive an economy but it is unclear whether movements in uncertainty simply reflect the influence of those factors or indicate an independent change in uncertainty (see, for example, Bloom (2014)). This makes it challenging to distinguish its direct effect on the economy. Various approaches have been adopted in recent literature both to measure it and to capture its effects on macroeconomic variables, like GDP, consumption and investment. Jurado et al. (2015) have emphasised certain desirable features of uncertainty measures. First, these measures should be forward-looking since we are interested in uncertain events in the future. Second, they should measure variation in future outcomes (i.e., the width of the probability distribution) rather than specific future outcomes (like a mean or a median). And third, they should not include a component that can be systematically forecast in advance; we are not typically uncertain about outcomes that we can forecast!
One potentially useful measure of uncertainty is based on UK firms’ stock price volatility, inspired by a similar measure introduced for US firms by Gilchrist et al. (2014). The intuition behind the stock market uncertainty (SVU) measure is that we would expect those firms facing a more uncertain environment to have a more volatile stock price. This is because investors are less certain about the value of the company and hence the value of the shares they hold in the company. We use this measure to construct an estimate of UK firms’ uncertainty that has all three of the desirable features mentioned above.
To calculate the SVU measure we use a sample of 622 firms listed on the stock exchange in the UK. To do this, we first estimate the daily variation in individual stock prices that cannot be explained by general market variation in a capital asset pricing model (CAPM) (see, for example, Sharpe (1964)). Then, we calculate the quarterly firm-specific standard deviation of the daily unexplained returns from the first step. The outcome is a firm-specific and time-varying SVU measure. Finally, we estimate a common component of these measures over time, which we interpret as an aggregate-level measure of the SVU.
Because the SVU measure already reflects the expected variation in the stock price based on general market variation in the first step, this measure picks up the unforecastable variation in the price. That helps achieve the desirable features of uncertainty measures discussed above; it is forward-looking (stock prices should include information about future prospects of a firm), it measures variation rather than means or medians, and it makes an attempt to exclude the forecastable component of uncertainty.
Chart 1 shows what the resulting aggregate SVU measure looks like. It also shows how it compares across large firms (over 250 employees) and small and medium-size firms (about 20% of firms in our sample).
The aggregate uncertainty measure is fairly volatile, and there is a large spike during the financial crisis. The SVU measure for small and medium-size firms is even more volatile than for larger firms, probably reflecting the more uncertain environment facing smaller firms. When compared to the Haddow et al. uncertainty indicator, the measures generally move in the same direction. More recently, both increased in anticipation of the EU Referendum, but after it, the SVU measure fell while the Haddow et al. indicator remained elevated (Chart 1).
Chart 1: Different measures of uncertainty
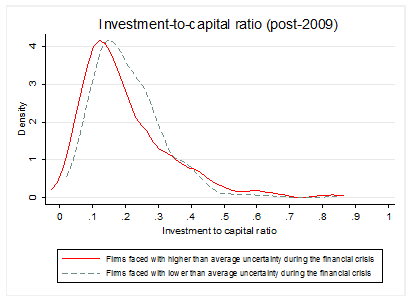
So, what might be the effect of uncertainty on investment? Chart 2 shows that firms which experienced higher uncertainty during the crisis, on average, have subsequently tended to report lower investment (in other words, the distribution for these firms is, on average, more to the left than for the other group of firms). This is in contrast to firms which experienced less uncertainty during the crisis, on average, and have tended to invest more since the crisis. The difference between two groups of firms is statistically significant and suggests that investment dynamics might be negatively affected by uncertainty.
Chart 2: Distributions of firm-level investment-to-capital ratios split by increases in uncertainty during the financial crisis
The chart shows sample distributions for investment-capital ratios since 2009 by the size of an increase in uncertainty during the financial crisis.
But Chart 2 is only suggestive. It does not prove any form of causality. To get a better idea of how uncertainty might actually affect investment, we model investment at the level of the firm. We also control for other relevant drivers of investment, as well as variation in investment across time and across firms. More specifically, we regress firm-level investment-to-capital ratios on variables like firm-specific sales, a proxy for future investment opportunities, and different measures of the cost of capital. We find that firm-specific SVU is a very significant explanatory variable for firms’ investment rates in all specifications of the model that we tried, as well as when we include different measures of the cost capital and firm-specific risk premia. We also find that the SVU measure has only been important, in a statistical sense, after the financial crisis.
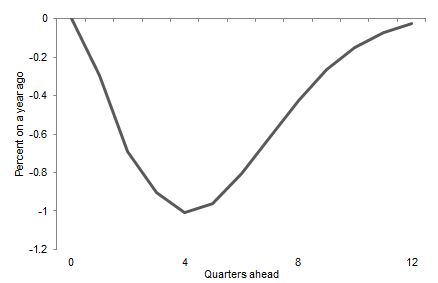
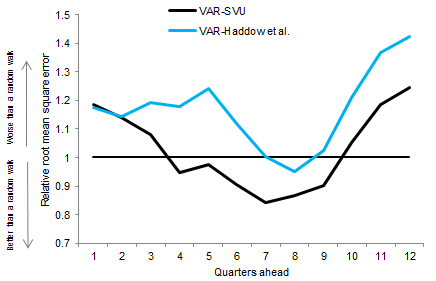
Given there is evidence that firms’ investment behaviour is correlated with our measure of uncertainty, we can use that insight to study aggregate business investment in the UK. We model uncertainty in a multivariable time series model that also includes other relevant aggregate level variables (GDP, interest rates and inflation). In this framework, an increase in uncertainty produces a relatively persistent effect on investment (Chart 3). This effect peaks after one year and then gradually dies out over the next two years. And a model with our SVU measure forecasts business investment dynamics better over the past than a model with the Haddow et al. uncertainty measure (Chart 4).
Overall, there is evidence that our measure of firm-specific uncertainty can help explain investment behaviour both at the level of the firm and in aggregate. Whereas the work by Haddow et al. suggested that the uncertainty is an important driver of GDP fluctuations, our work provides complementary analysis, using a different measure of uncertainty, to suggest that uncertainty is a crucial factor in firms’ investment decisions.
Chart 3: Impulse response of business investment to an uncertainty shock
The chart shows percentage changes to a one-standard deviation shock to the uncertainty variable. The impulse response has been identified with a Choleski ordering of the variables (see here for more detailed definitions), where investment reacts with a lag to exogenous shocks in the other variables.
Chart 4: Relative forecast performance of different uncertainty measures on business investment
The chart shows the root-mean square error (RMSE) relative to a random walk forecast for annual changes in business investment at different forecast horizons, where random walk = 1. The lower the RMSE, the better the forecast.
Marko Melolinna works in the Bank’s Structural Economic Analysis Division and Srdan Tatomir works in the Bank’s Macro Financial Analysis Division.
Note: Bank Underground is a blog for Bank of England staff to share views that challenge – or support – prevailing policy orthodoxies. The views expressed here are those of the authors, and are not necessarily those of the Bank of England, or its policy committees.


