Today we continue the discussion of the latest findings from our rolling household surveys. Yesterday we over-viewed the segments, and trends, and looked at relative demand. Today we go deeper. The accompanying video explains our findings in more detail.
Want To Buy.
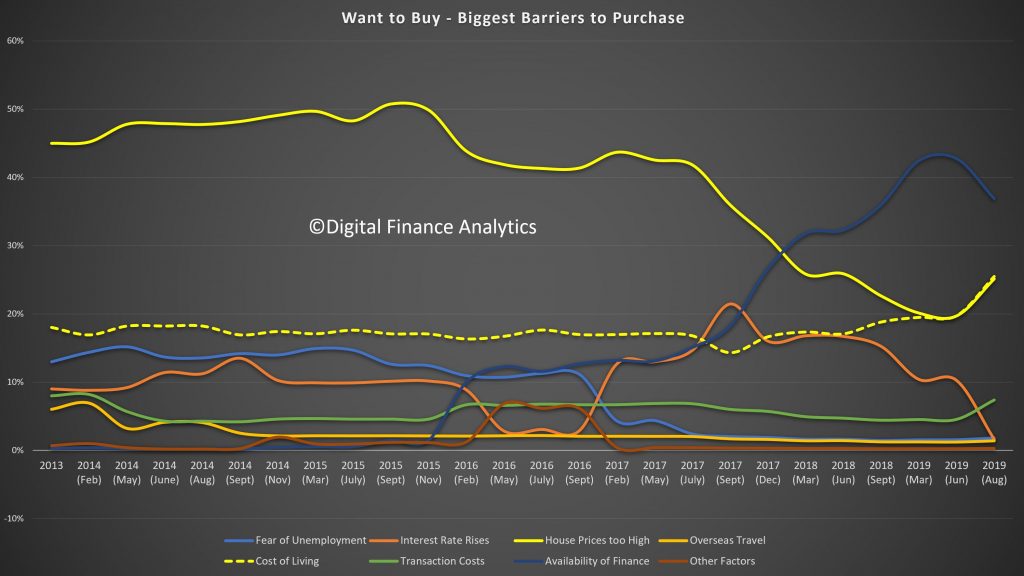
The 1.6 million Want To Buys are not able to progress because finance is not available (37%). This is been a growing issue in recent times, though has eased back, as pressure from cost of living (25%) and high home prices (25%) bite. Many therefore remain in rental property or in other living arrangements.
First Time Buyers.
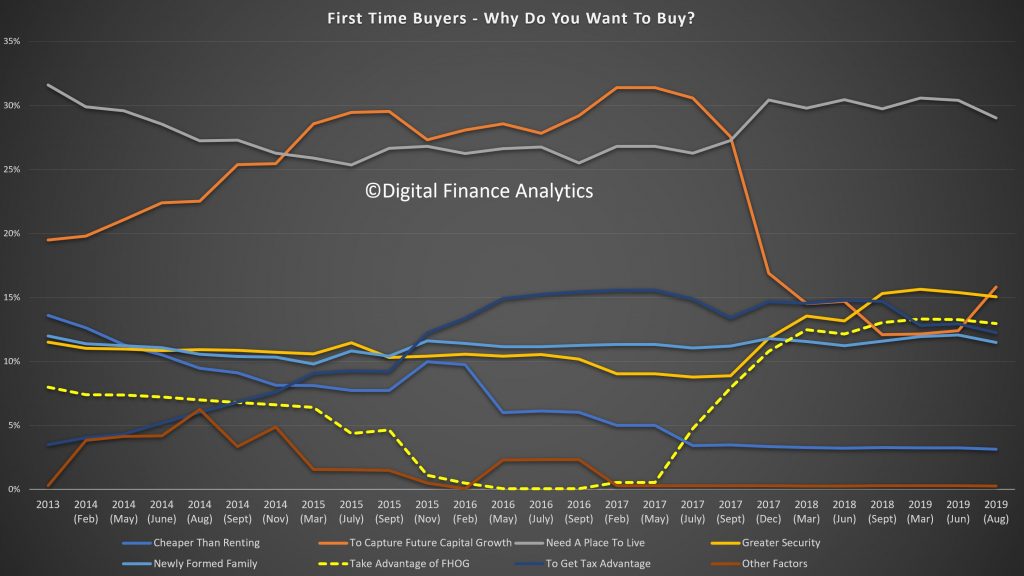
There have been some changes in the drivers of purchase by the 350,000 first time buyers. Needing a place to live is high on the agenda (29%), but the expectations of future capital growth have dropped to 15%, while greater security remains around 15%. There is a rise in the use of First Owner incentives (13%).
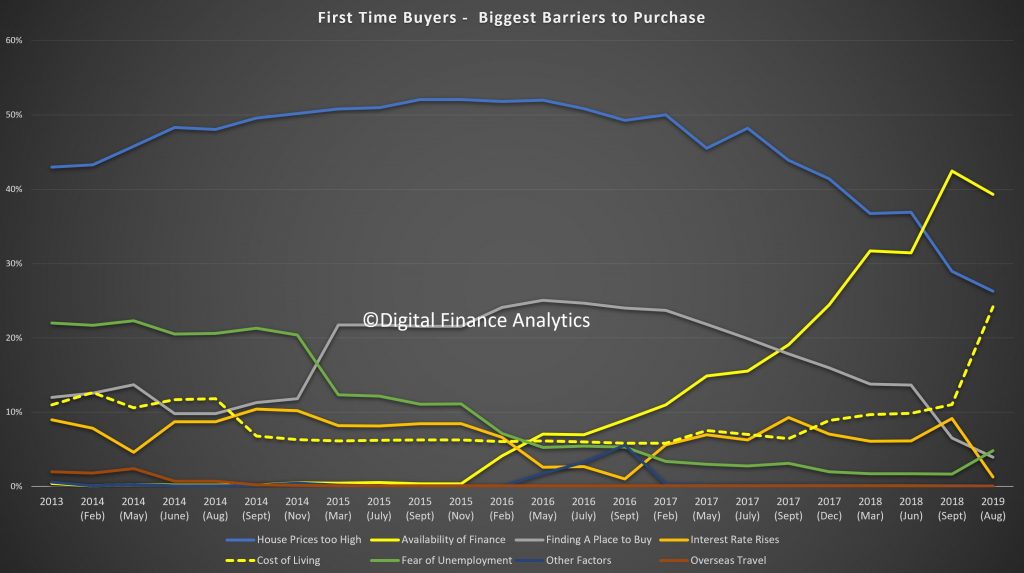
However, availability of finance remains a significant barrier (39%) – though it dropped a little in response to lower rates and changed underwriting standards, along with high home prices (26%) and costs of living (24%). Fear of unemployment is on the rise (5%).
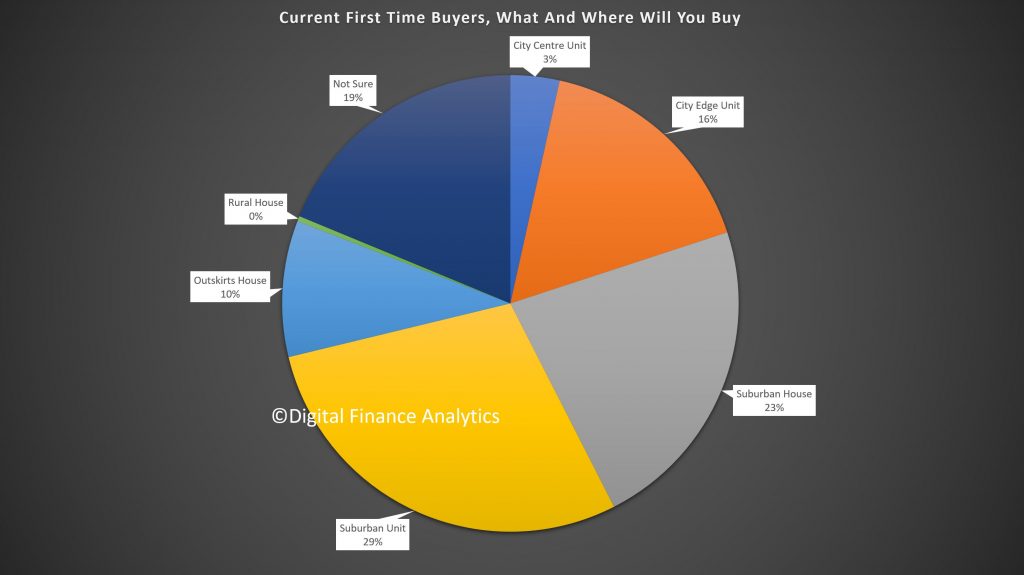
There has been a reduction in demand for units relative to houses, partly in response of the coverage of poor quality high-rise construction. We expect this to continue.
Refinancers.
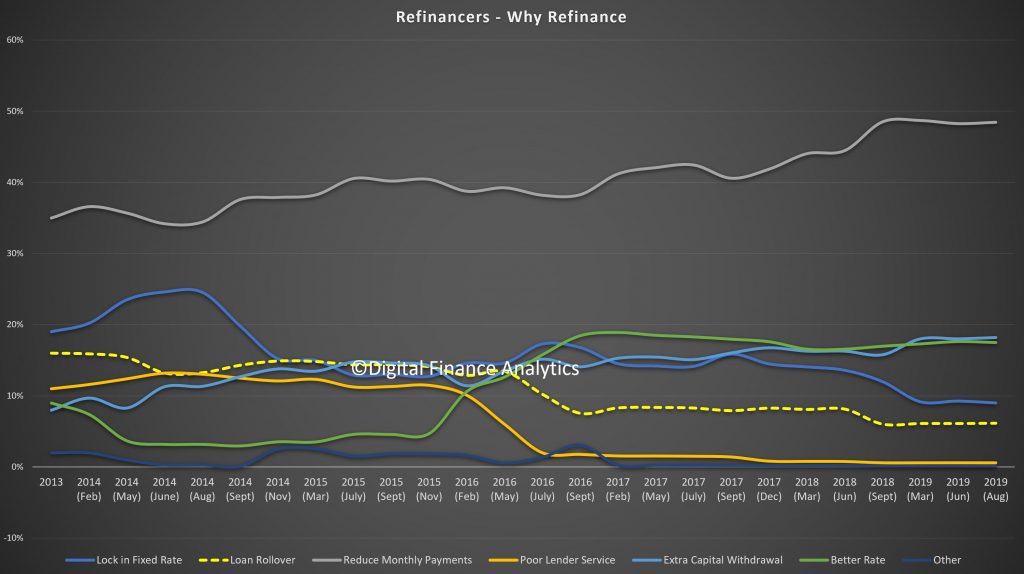
There is a significant demand from those seeking to refinance an existing loan. The main aim is to reduce monthly repayments (48%), a factor which have become more important as financial pressures and mortgage stress build, helped by lower rates (18%). Around 18% are seeking to withdraw capital to repay other debts or improve their finances. Fixed rates are becoming less attractive (9%). Poor lender service is not a significant factor; price is.
Up-Traders.
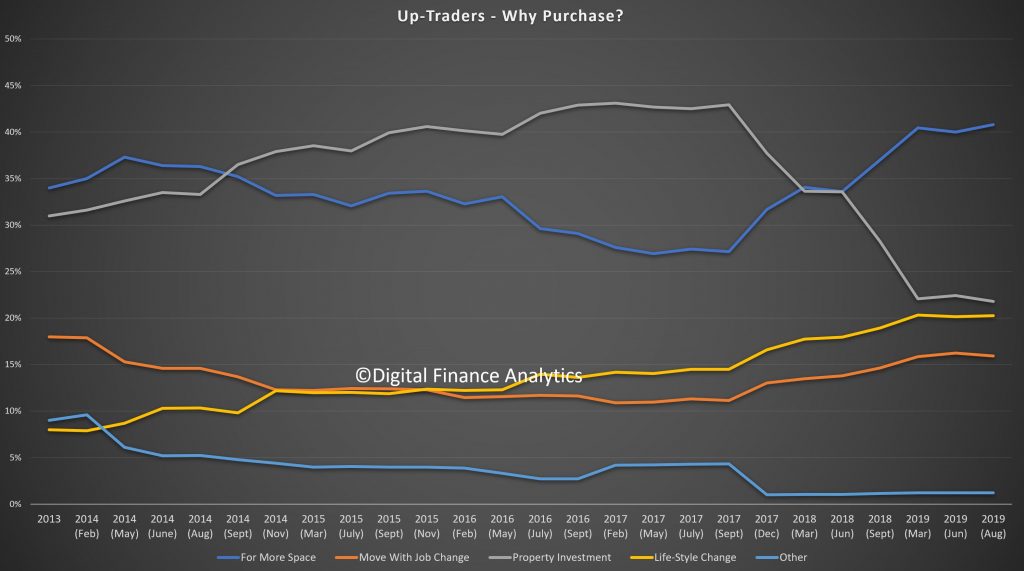
Households looking to buy a larger property are driven by the desire for more space (41%), job move (16%), life-style change (20%), or property investment (22%), the latter dropping from recent highs of 43%.
Down Traders.
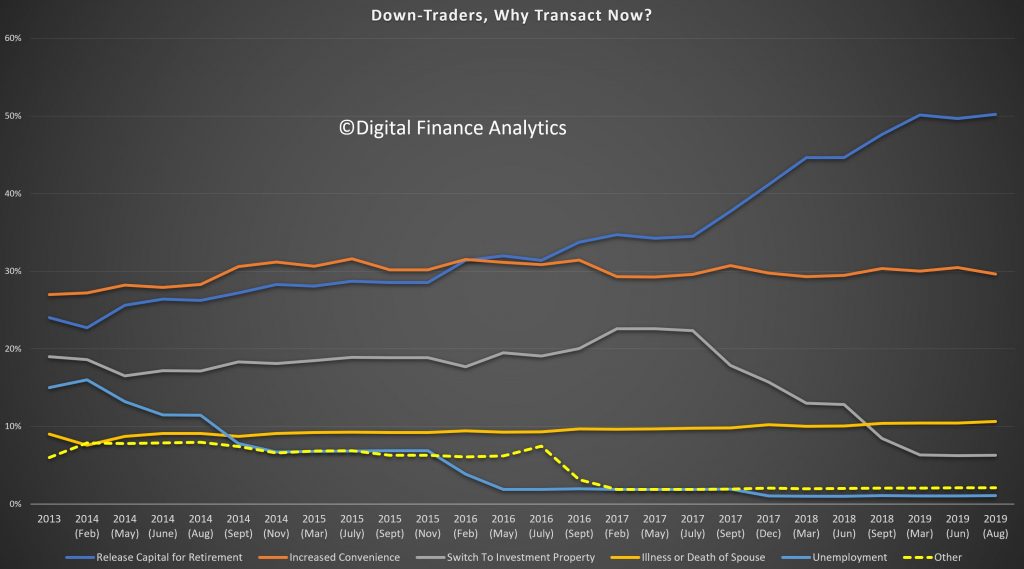
Those seeking to down size are mainly driven by the need to release capital, often for retirement, or supporting the “Bank of Mum and Dad” (50%). Around 30% are driven by increased convenience – either by changing location or to a more manageable property. A switch to an investment property has faded to 5% from a peak of 22% in 2017.
Property Investors.
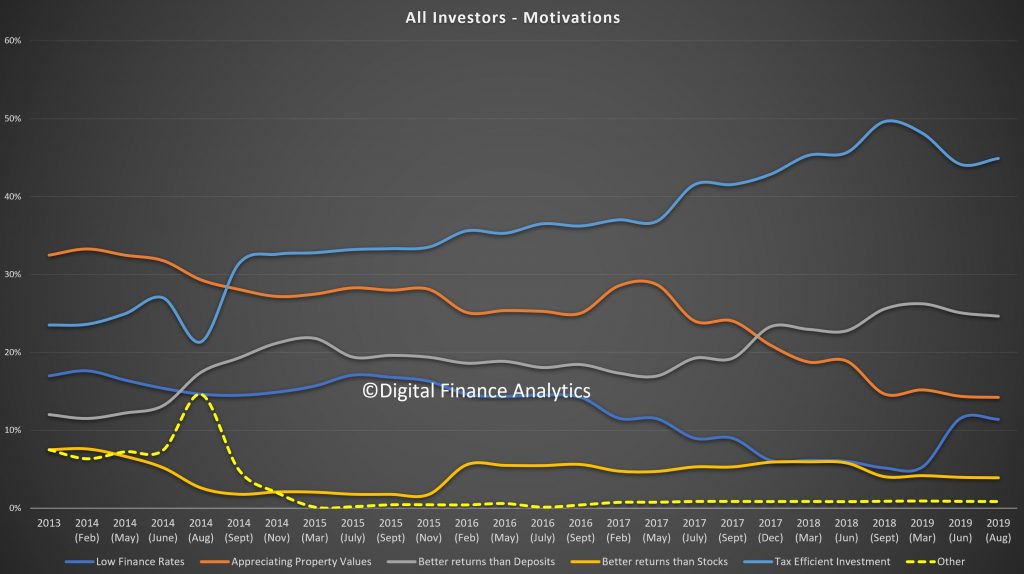
Tax efficiency remains the strongest driver for investors (45%), while appreciating property values have dropped from more than 30% down to 15% now. Low finance rates have risen to 12% thanks to the recent changes and better returns than bank deposits registered at 25%. So investors believe the tax breaks make investing a reasonable proposition (though many would find in net cash flow terms they are underwater, without significant capital gains).
The main barriers are difficulty in obtaining finance (40%), have already bought (30%), and changes to regulation (15% – and falling now). Fears of interest rate rises have dropped from 11% in March 2019 to 1% now and the local and international economic scene has changed.

In the accompanying video we look in more detail at the differences between Solo Investor, Portfolio Investor and Super Investor motivations.
Finally, its worth noting that across the segments, when choosing a mortgage, price remains the main driver, though some segments rate other features a little more significant than others.

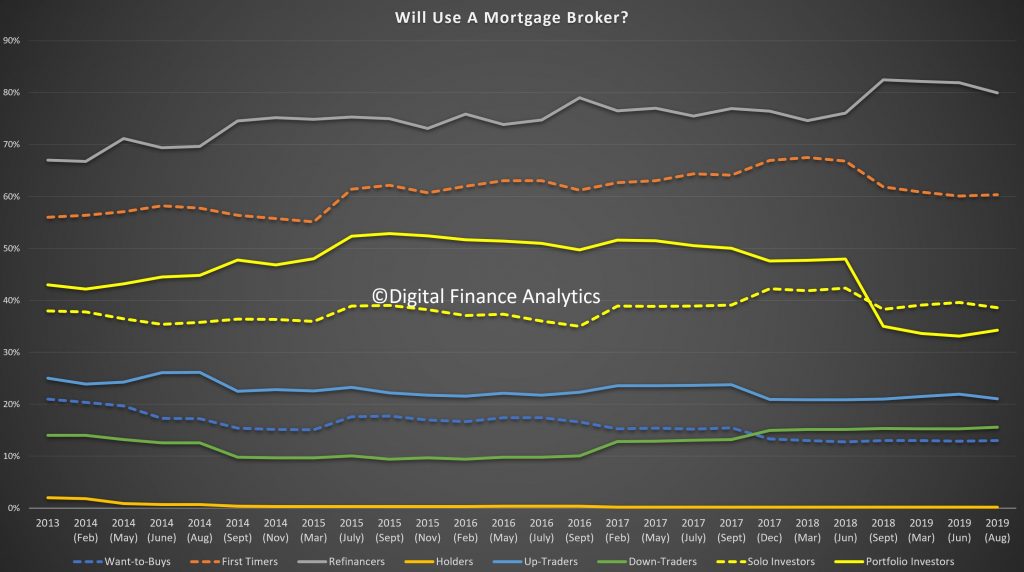
Prospective use of mortgage brokers also varies across the segments, with refinancers and first time buyers the most likely to use an adviser.
So, in summary, households are reacting to the changing market and economic conditions. However there is little here to suggest a significant upswing in demand.
