APRA released their monthly banking stats for ADI’s to end July 2015 today. Looking in detail at the data, we start with home loans. Total ADI loan portfolios grew in the month by 0.4% to $1.37 trillion. The RBA data, already discussed gave a total growth of 0.6% to $1.48 trillion, so this suggests the non-banking sector is growing faster than ADIs. There are lags in the non-bank data streams, so we need to watch future trends carefully. Investment lending grew more than 11% in the past 12 months.
Looking at the mix between owner occupied and investment home lending, we see that owner occupied loans were static, ($827,905, compared with $827,700 in July), whilst investment loans grew (from $827,905 to $827,700 million) with a rise of $5,799 million, or 1.1%. However, we think the data is corrupted by further restatements of loans as they are reclassified between owner occupied and investment categories.
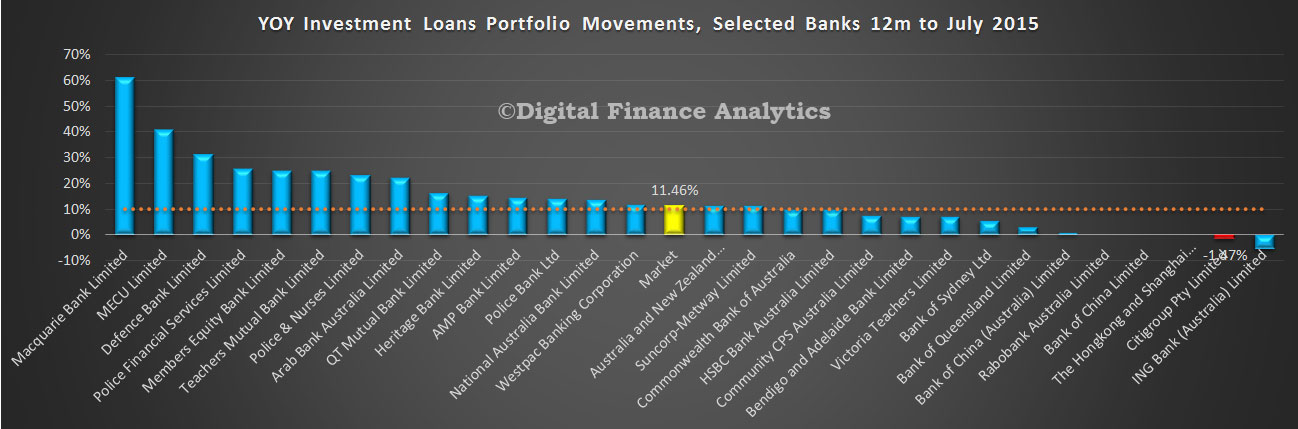
Looking at the lender data, we start with the all important year on year portfolio movements. Depending on how you calculate this (sum of each month movement, last 3 month annualised, etc) you can make the number move around. We have adopted a simple approach. We sum the portfolio movement each month for 12 months. This gives a market growth average for the year of 11.46%. We also see that many banks – including some of the majors, are still well above the speed limit of 10%. Regulatory pressure does not seem to be having much impact, despite the rhetoric, and repricing. Our thesis appears proven.
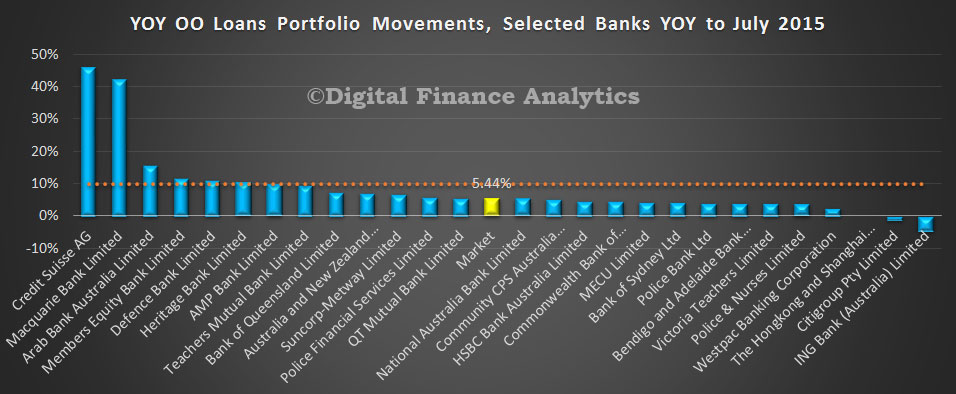
 For completeness, we show the same picture for owner occupied loans – though there is of course no formal speed limit as we think currently competitive action is focussed here.
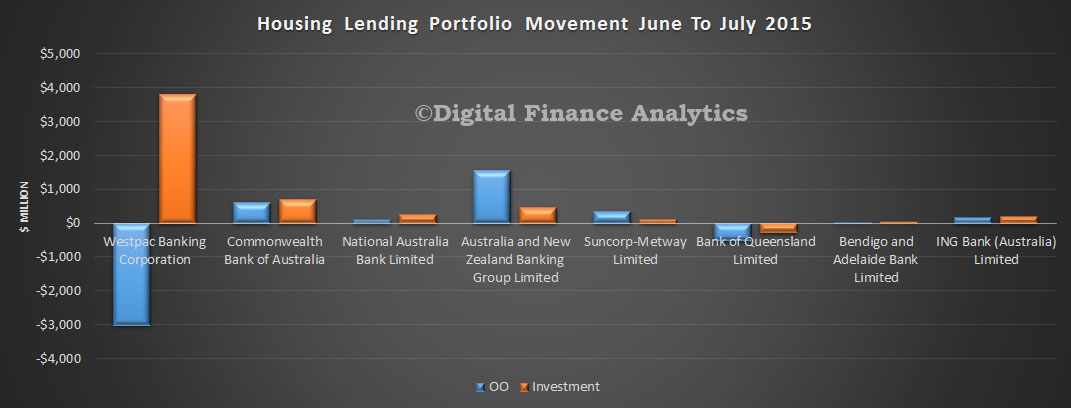
 Turning to the portfolio movements, we see a significant swing at Westpac – we suspect a restatement of loans – but have not found any announcements on this so far. Logically, a $3bn lift in investment lending is too significant to be normal market behaviour, in our opinion. We have factored in the restatements at NAB and ANZ.
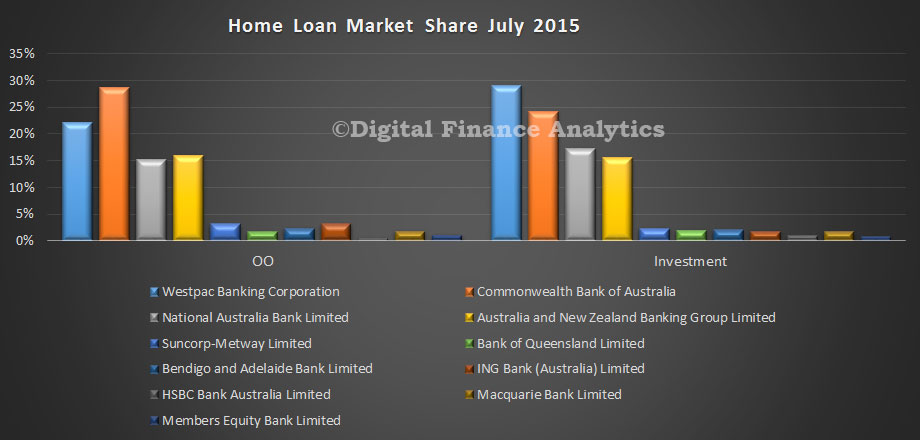
 The relative market share analysis shows that Westpac has the largest investment portfolio, whilst CBA has the largest owner occupied loan portfolio.
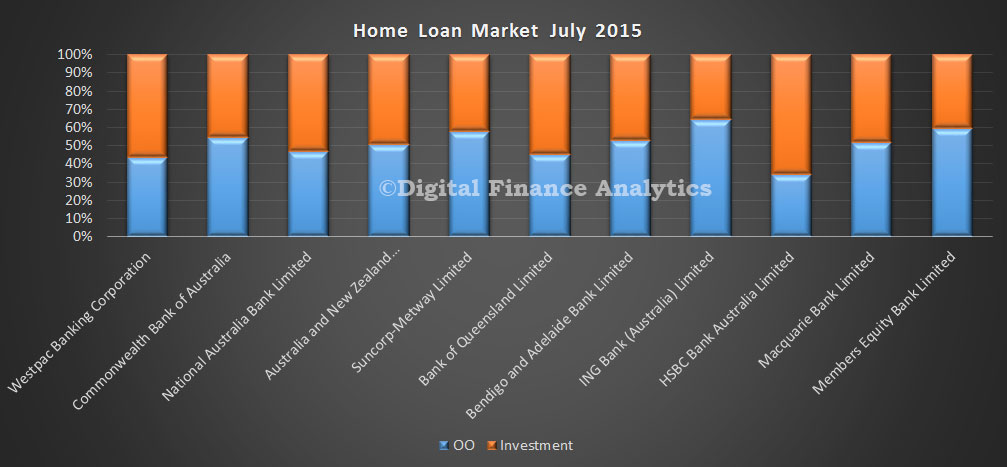
 It is also worth looking at the relative percentage splits between owner occupied and investment loans by bank. Westpac and Bank of Queensland have the largest relative proportions, so are under more pressure from the 10% question.
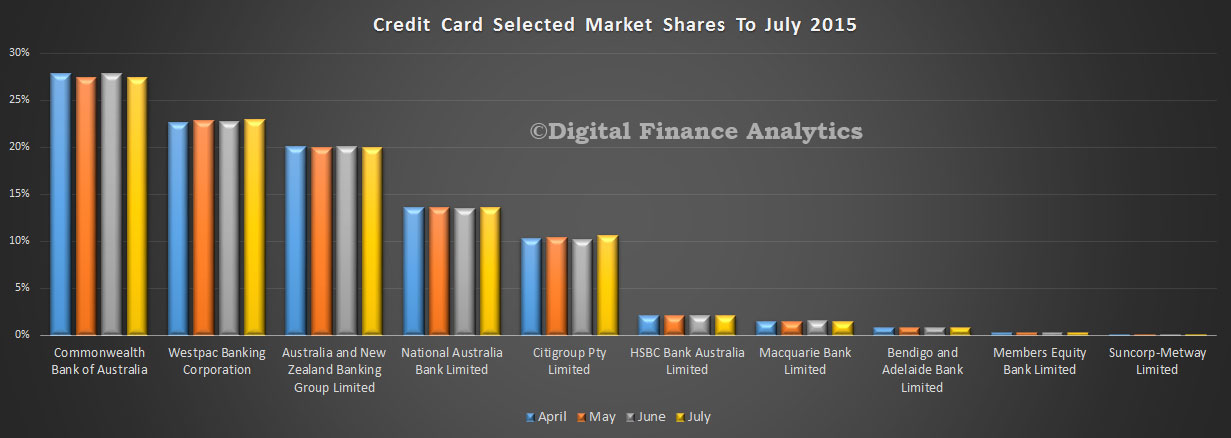
 In the credit card portfolio, total balances were up 1% from $40.4 billion to $40.8 billion. We see small movements in relative share, with CBA loosing a little whilst Westpac and Citigroup grew share slightly.
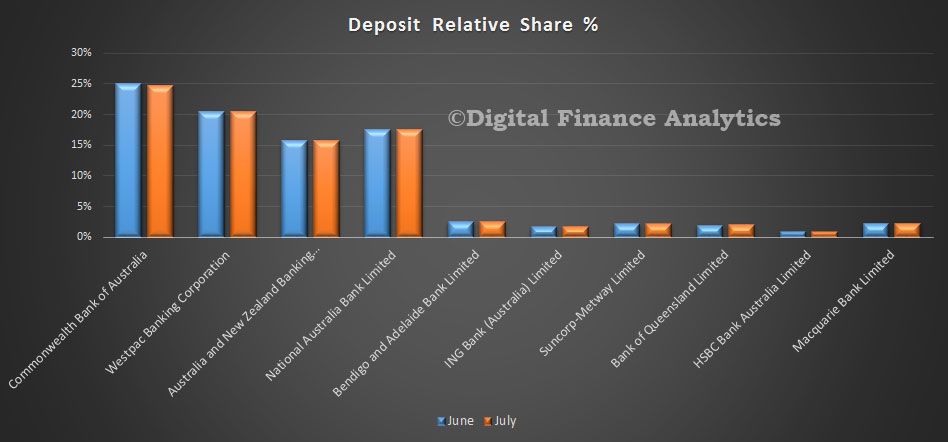
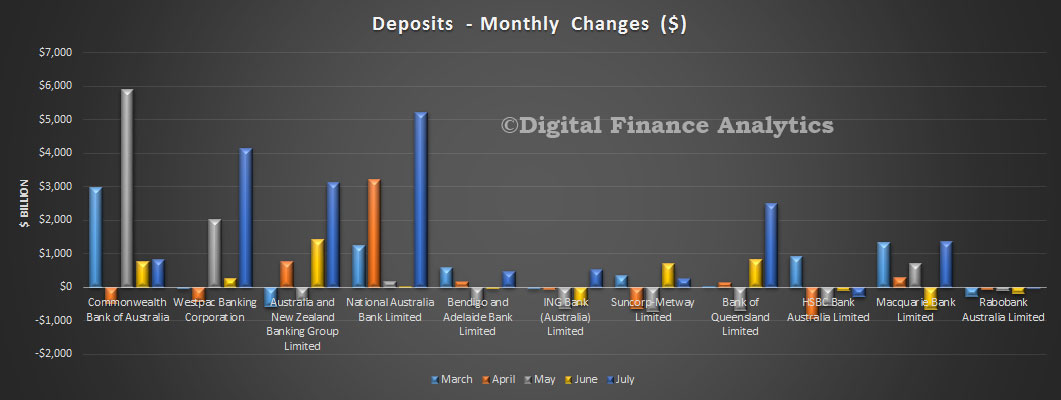
 Finally, on deposits, we see three of the majors growing their portfolio, with NAB showing the largest inflow. Total balances grew from $1.83 billion to 1.86 billion, of 1.27%.
 Relative deposit share changed just slightly as a result.