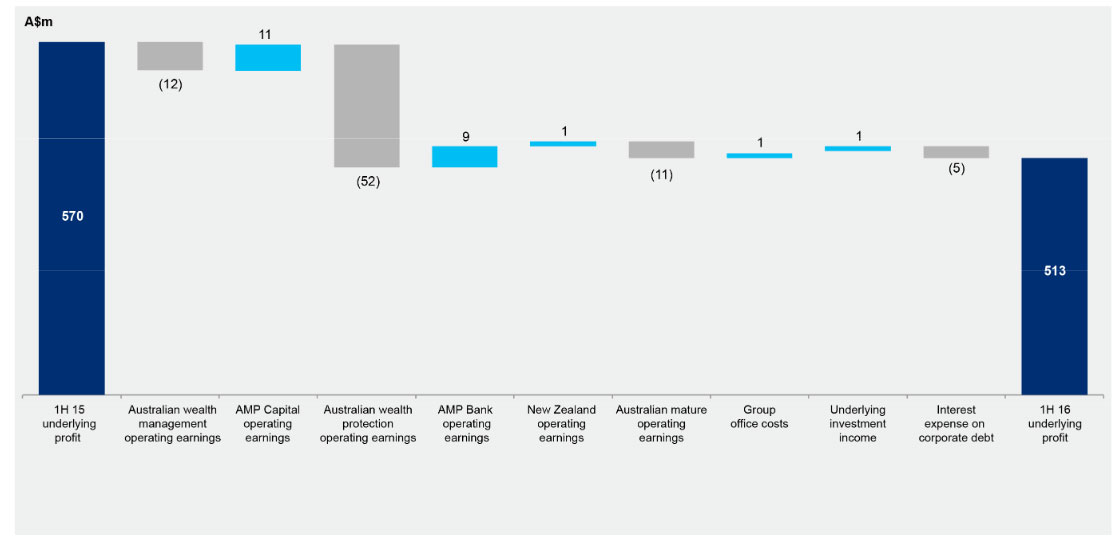
AMP released their 1H16 results today. They reported a net profit of $523m for the half, up 3% when compared with 1H15. However, underlying profit, (after one-off costs, adjustment for some investment market volatility and accounting mismatches) were $513m compared with $570m for 1H15, down 10% year on year. The results were impacted by higher claims in Australian wealth protection and volatile investment market conditions.
 Australian wealth management net cashflows were $582m, down from $1,152 in 1H15. Both retail and corporate super platforms were subdued because of weaker investor confidence relating to proposed superannuation changes and market volatility. AMP Capital external net cash flows were $153m, down from $3,025 in 1H15.
Overall revenues from ordinary activities were $6,096m compared with $8,624 30 Jun 2015, down 29%.
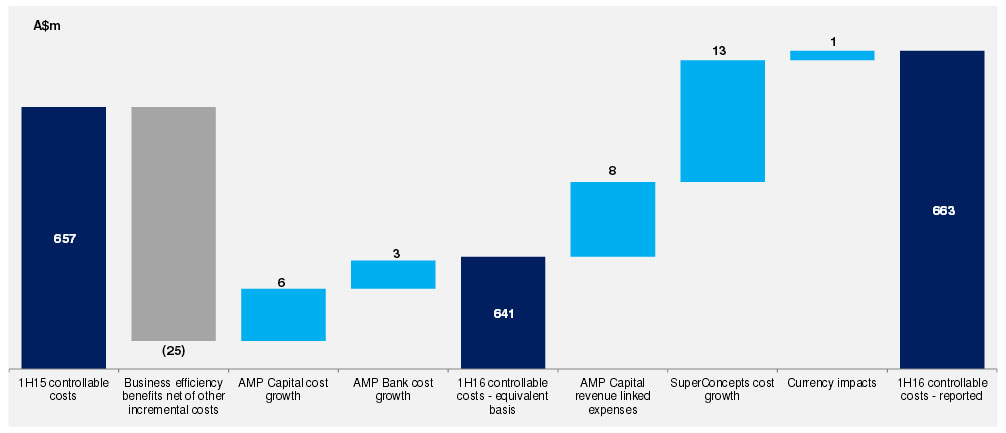
The cost to income ratio increased 2.4% compared with 1H15 to 45.5%. Costs were up $6m to $663m, compared with 1H15.
 Underlying return on equity reduced 1.6% to 11.9% compared with 1H15.
They declared an interim dividend of 14 cents per share, in line with 2015, a payout ratio of 81% of underlying profit.
Equity and reserves of the AMP Group increased to $8.6bn, from $8.5bn in Dec 15.
AMP holds Level 3 capital above the minimum requirements of $1,917m, but down from $2,542m 31 Dec 15. The decrease is mainly due to the redemption of $60m subordinated notes.
Looking at the segmentals, AMP has six key business areas, Australian Wealth Management, AMP Capital, Australian Wealth Protection, AMP Bank, New Zealand Financial Services and Australian Mature.
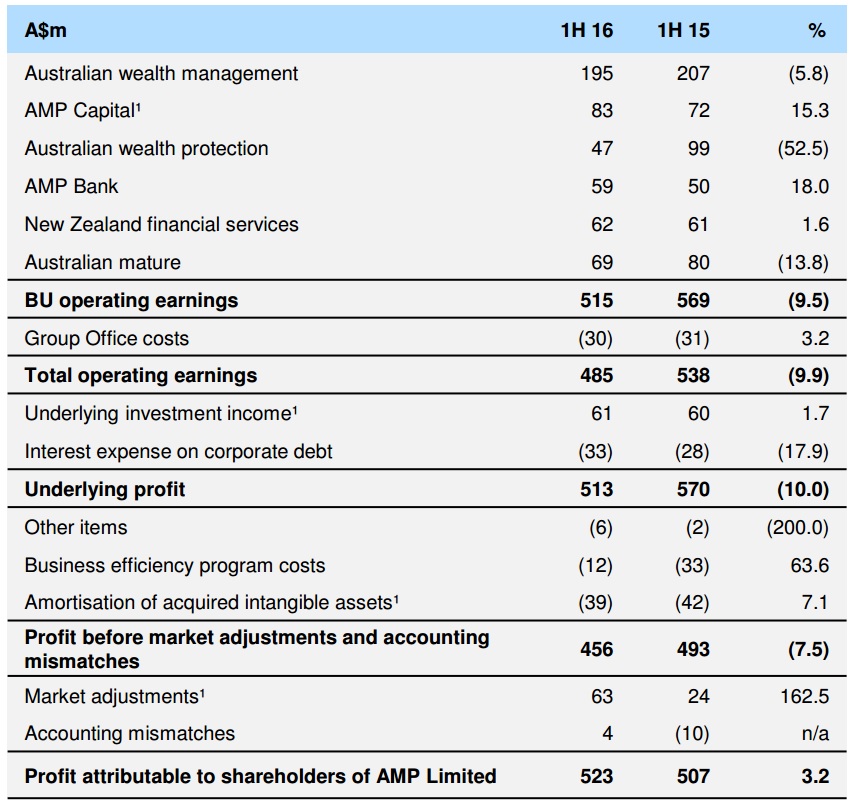 Australian wealth management earnings were $195m, down 6%, reflecting challenging market conditions.
Australian wealth protection earnings were $47m, down from $99m in 1H15, reflecting poor claims experience across income protection, lump sum and group insurance.
AMP Capital lifted earnings 15% thanks to a growth in fee income.
AMP Bank increased earnings by 18% to $59m with an expanded NIM at 1.71%, compared with 1.53% 1H15. Total loans grew by $816m to $16b, up 5.9%. Within that, the residential mortgage book grew $806m, to $15.4b, up 5.5%. Owner occupied loans made up 73% of the portfolio. Investment lending recommenced in November 2015. More new loans are via mortgage brokers, and as a result new loans from their advisor channel fell to 19%, down from 24%. Mortgage arrears (90days+) were 0.51%, and impairments 0.04%. Deposits grew 11.4% and deposit to loan ratio was 67%. The CET1 ratio was 7.9% and the liquidity coverage ratio was 126%.
New Zealand earnings were up 2% reflecting higher profit margins. Net of tax relief reductions, it would have been 19%
North Assets Under Management grew 26% to $23.4b
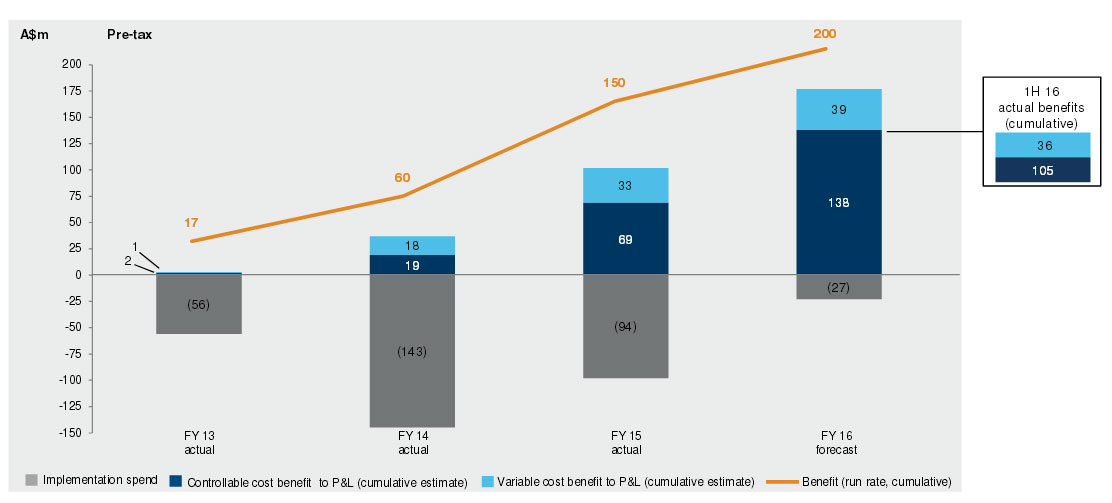
The group was also helped by the ongoing efficiency program which overall will contribute $200m by end of 2016.