ANZ released their results for 1H 2015 today. They reported a statutory profit of $3,506m up 3% from 1H14, and a cash profit of $3,676m, up 5% from 1H14. This was slightly better than expected. The result was driven by significant growth in customer deposits (up 12%) and advances (up 10%) and a provision charge of $510 million down 3%. The Group total loss rate saw a modest decline over the year, from 21bps to 19bps and ANZ’s expectation is that the loss rate will stabilise in 2H15. It expects to be operating in a lower growth operating environment going forwards.
A 4% increase in the Interim Dividend to 86 cents per share will see ANZ shareholders receive $2.4 billion, of which around 73% will be delivered to Australian based Retail and Institutional investors. ANZ expects to maintain a payout ratio for the Financial Year 2015 towards the upper end of the 65 to 70% of Cash Profit range.
ANZ’s Capital Ratio at the end of the first half was 8.7%, up 40 basis points (bps) on the same half in 20144. This half the Dividend Reinvestment Plan will operate with a 1.5% discount which is expected to result in a participation ratio of around 20% on a full year basis.
Looking across the divisions, in Australia, profit grew 8%, driven by a 6% uplift in both income and profit before provisions. Customer numbers, business volumes and market share all grew driven by investment in products, sales and service capacity and capability. Additional staff and training, new and improved digital tools including online applications, expanded customer coverage and improved service levels delivered increased Retail loan volumes, up 8% and C&CB loan volumes, up 4%. Deposits increased 3% and 6% respectively. Home lending has now grown above system for five consecutive years. Retail net interest margin fell 5 basis points from 2.01% in 2H2014 to 1.97%. The C&CB Business delivered ongoing growth despite subdued business sector confidence. ANZ’s historic strength in the Small Business Banking (SBB) segment continued with lending up 15% having grown at double digit rates for the past 3 years. Deposits in SBB have also grown strongly and at $31 billion, are more than double the level of loans.
International and Institutional Banking increased profit by 7% with strong contributions from Global Markets customer sales and the Cash Management business along with ongoing benign credit outcomes. PBP increased by 1%. Geographically, Asia Pacific Europe and America (APEA) was the standout, with profit up 18%. In Asia, customer revenues increased 13%, largely through increased focus on lower capital intensity, higher return products like Foreign Exchange, Cash Management and Debt Capital Markets. ANZ is also growing strongly in the region’s key trade and investment flow corridors including those between Australia and Hong Kong, China and Hong Kong and Australia and Singapore.
In the Trade business while volumes were broadly maintained, deteriorating commodity prices reduced the value of shipments, lowering income slightly. Lending growth across the network partially offset ongoing loan margin compression which is being felt most acutely in Australia. The quality of the loan book remains high, at 79% investment grade. Deposits increased 17%, including a 27% increase in deposits in APEA. The percentage uplift in both deposits and lending in part reflects the depreciation of the Australian Dollar during the period. A record Global Markets revenue result was in large part delivered via a record customer sales outcome, most notably in Asia. Increased activity particularly in rates, commodities and FX, assisted sales in the second quarter of the year.
In New Zealand (all figures in NZD), the business has increased momentum, with income growth of 6% and profit before provisions up 8%. Economic momentum has lifted lending volumes. Profit growth after provisions was up 1% reflected a lower level of provision write-backs than in the prior comparable period. Home lending lifted 6% with market share increasing in key regions like Auckland and Christchurch. Streamlined products and processes along with digital tools helped lift Commercial and Agri business with lending up 6%.
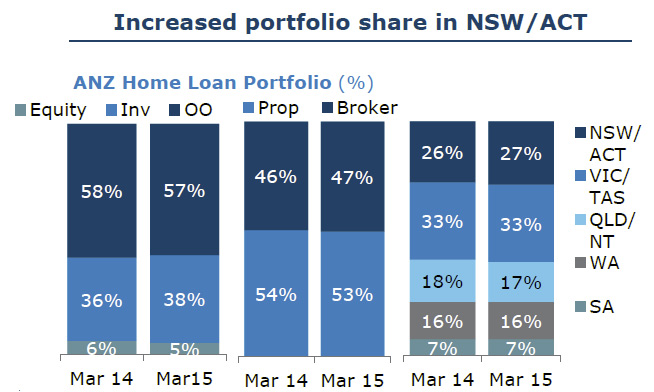
Focussing on the Australian mortgage performance, which made up 69% of the Australian division credit exposure, there was more growth in NSW (1x3x system) than other states. Investment lending share increased, growing at system, and more loans were originated via the broker channels at 1.3x system. ANZ has been growing is mobile lender base, with a 50% increase in NSW.
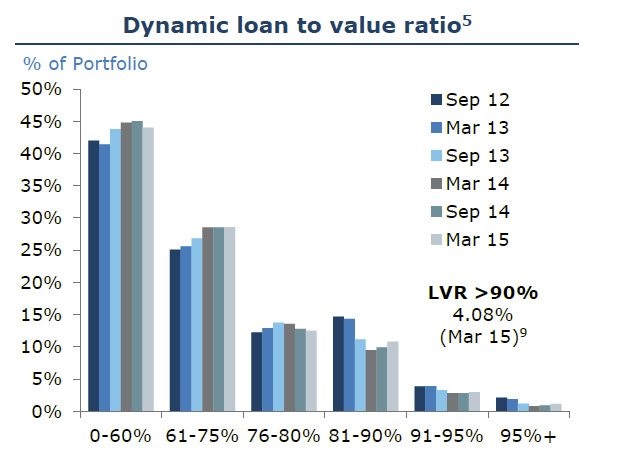
 Total home lending was $218 bn, up 8% net, with 934k loan accounts. The average balance at origination was $376k, (much higher than Westpac at $235k), the average LVR was 71% at origination (same as Westpac).
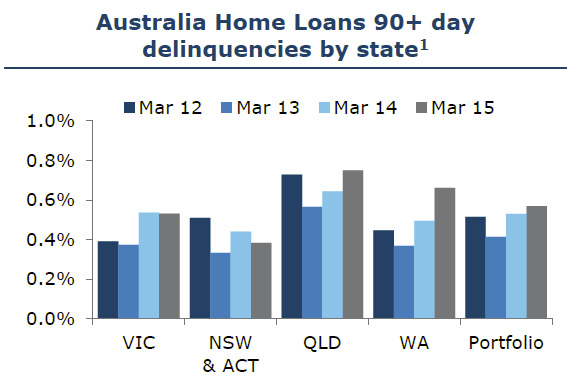
 43% of the portfolio was ahead on repayments (Westpac was 73%) and 35% of the portfolio is interest only. 90+ day delinquencies were 5.7 basis points with highest rates in Queensland. Note this excludes non-performing loans.