An IMF working paper discusses an important issue, relating to what should have been the appropriate fiscal policy in the aftermath of the global financial crisis is very much open. There is considerable controversy over the impact of fiscal consolidation on economic activity and on why sluggish economic growth persists across many advanced economies several years after the onset of the financial crisis.
This paper looks at private consumption because, on average across countries, it is the component of GDP that accounts for the largest proportion of the overall changes to real GDP. Using econometric modelling the paper looks at the possible effects of fiscal policy on private consumption, but also explore the negative wealth effects stemming from the collapse of housing and financial assets in the context of high household debt. They argue that wealth effects played an important role weighing down consumption growth, suggesting that the effect of fiscal policy on economic activity may be overestimated if such factors are overlooked.
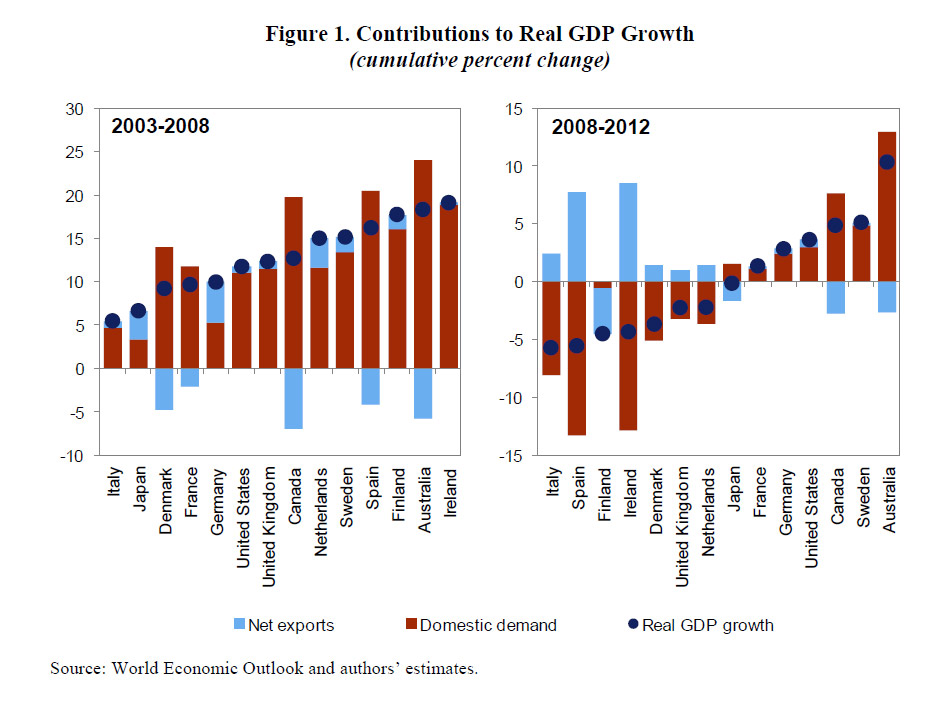
Two interesting data sets relating to the relative position of Australia and other countries in the analysis which shows the relative significance of private consumption in Australia since 2003. In the context of slowing income growth and very high household debt levels today, we cannot expect households to create significant GDP momentum in the next few years. Yet we have been very reliant on this for some time. In essence we have a structural economic problem.

 More generally they find that consumption is impacted by wealth effects, in addition to fiscal policy. They find a significant long-term relation between consumption and the different components of income and wealth. Labor income remains the main driver of consumption. Personal income taxes and social security contributions are found to have a negative impact on consumption, while social benefits are found to have a larger positive impact. Financial assets and housing assets are found to have a positive coefficient, while household debt is found to have a negative coefficient. Furthermore, the results suggest that the contribution to consumption from an increase in financial or housing assets would be more than offset if financed fully through in increase in household debt.
Note that IMF Working Papers describe research in progress by the author(s) and are published to elicit comments and to encourage debate. The views expressed in IMF Working Papers are those of the author(s) and do not necessarily represent the views of the IMF, its Executive Board, or IMF management.