The Inquiry has eschewed wholesale changes in favour of more incremental ones. I do not intend to offer a point by point response to all the recommendations. Let me touch on just a few themes.
The first is enhancing the banking system’s resilience. There are a few issues here, the most contentious of which is whether banks’ capital ratios, which have already risen since the crisis, should be a little higher still. The Inquiry concluded that they should.
There has been a lot of debate about just where current capital ratios for Australian banks stand in the international rankings. The reason there is so much debate is because such comparisons are difficult to make. There seems little doubt, though, that most supervisory authorities (and for that matter most banks) around the world have, since the crisis, revised their thinking on how much capital is needed and none of those revisions has been downward. So wherever we stood at a point in time, just to hold that place requires more capital. And it’s likely to be demanded by the market. There’s generally not much doubt about which way the world is moving.
Of course, capital is not costless. If capital requirements become too onerous then the higher cost of borrowing could impinge on economic growth. But more capital brings the benefit of a more resilient system, one less prone to crisis and one more able to recover if a crisis does occur. Crises are infrequent, but very expensive. So there is a cost-benefit calculation to be done, or a trade-off to be struck – higher-cost intermediation, perhaps slightly reduced average economic growth in normal times, in return for the reduced probability, and impact, of deep downturns associated with financial crises. The Inquiry, weighing the costs and benefits, concluded that the benefits of moving further in the direction of resilience outweigh the rather small estimated costs.
The second set of issues surround ‘too-big-to-fail’ institutions and their resolution. The Inquiry is to be commended for grappling with this. These issues are complex and even after substantial regulatory reform at the global level, there is still key work in progress. The stated aim of all that work is to get to a situation where, with the right tools and preparation, it would be possible to resolve a failing bank (or non-bank) of systemic importance, without disrupting the provision of its critical functions and without balance sheet support from the public sector. This is explicitly for globally systemic entities, but the Inquiry has, sensibly enough, seen the parallel issue for domestically systemic ones as worthy of discussion.
Ending ‘too-big-to-fail’ is an ambitious and demanding objective. To achieve it, not only must systemic institutions hold higher equity capital buffers, but more tools to absorb losses are needed in the event the equity is depleted. Typically envisaged is a ‘bail-in’ of some kind, in which a wider group of creditors would effectively become equity holders, and who would share in the losses sustained by a failing entity. For this to work, there needs to be a market for the relevant securities that is genuinely independent of the deposit-taking sector – we can’t have banks hold one another’s bail-in debt. In a resolution, a host of operational complexities would also have to be sorted out. A resolution needs the support of foreign regulators if it is to be recognised across borders. It needs temporary stays on derivatives contracts so that counterparties don’t scramble for collateral at the onset of resolution. And it needs to be structured and governed well enough to withstand potential legal challenges and sustain market confidence.
A proposal for ‘total loss-absorbing capacity’, or TLAC, was announced at the G20 Summit in Brisbane last year. Consultations and impact assessments are under way, and an international standard on loss-absorbing capacity will be agreed by the G20 Summit in Antalya later this year; guidance on core policies to support cross-border recognition of resolution actions should be finalised shortly after.
It is fair to say that in its main submission to the Inquiry, the Reserve Bank counselled caution as far as ‘bail-in’ and so on is concerned. We would still do so. The Inquiry also favours a cautious approach. Again, though, the world seems to be moving in this general direction. It isn’t really going to be credible or prudent for Australia, with some large institutions that everyone can see are locally systemic, not to keep working on improvements to resolution arrangements.
The third set of recommendations from the Inquiry I want to touch on are those related to the payments system. The Inquiry generally supported the steps the Payments System Board (PSB) has taken since its creation after Wallis, but raised a few areas where the Board could consider consulting on possible further steps. As it happens, these dovetail well with issues that the PSB has been considering for some time. The Reserve Bank has since announced a review of card payments regulation and released an Issues Paper in early March. Among other things, it contemplates the potential for changes to the regulation of card surcharges and interchange fees.
Surcharging tends to be a ‘hot button’ issue with consumers and generated a large number of (largely identical) submissions to the Financial System Inquiry. But virtually all of the public’s concern is directed at a couple of industries where surcharges appear to be well in excess of acceptance costs, at least for some transactions. The Bank considers that its decision to allow surcharging of card payments in 2002 has been a valuable reform. It allows merchants to signal to consumers that there are differences in the cost of payment methods used at the checkout. By helping to hold down the cost of payments to merchants, the right to surcharge can help to hold down the prices of goods and services more generally.
The Bank made some incremental changes to the regulation of surcharging in 2013, but to date these have had a relatively limited effect on the cases of surcharging that most concern consumers. Our current review will consider ways we can retain the considerable benefits of allowing merchants to surcharge, while addressing concerns about excessive surcharges. One element of this might be, as the Financial System Inquiry suggests, to prevent surcharges for some payment methods, such as debit cards, if they were sufficiently low cost. This would mean that in most cases consumers would have better access to a payment method that is not surcharged, even when transacting online. Other options being considered are ways to make the permissible surcharge clearer, whether through establishing a fixed maximum or by establishing a more readily observable measure of acceptance costs.
The capping of card interchange fees is also now a longstanding policy and, we think, a beneficial one. Nonetheless, it is important to ensure that it continues to meet its objectives. Caps were put in place in 2003 based on concerns that interchange fees in mature payment systems can distort payment choices and, perversely, be driven higher by competition between payment schemes. As suggested by the Inquiry, the Bank’s review will consider whether the levels of the current caps remain appropriate. We know, for example, that lower caps have now been set in some other jurisdictions.
But there are other elements of the current regime that also warrant consideration. For instance, while average interchange fees meet the regulated caps, the dispersion of interchange rates around the average has increased significantly over time. The practical effect of this is that there can be a difference of up to 180 basis points in the cost of the same card presented at different merchants. This problem is aggravated by the fact that merchants often have no way of determining which are the high-cost cards.
Although the wide range of interchange fees is not unique to Australia, we would want to ensure so far as possible that the regulatory framework does not contribute to this trend or to declining transparency of individual card costs to merchants. The Bank’s review will consider a range of options, including ‘hard’ caps on interchange fees and hybrid solutions, along with setting more frequent compliance points for caps. Options for improving the ability of merchants to respond to differing card costs will also be considered.
While considering interchange fees, it is also appropriate to consider the circumstances of card systems that directly compete with the interchange-regulated schemes. This means, in particular, bank-issued cards that do not technically carry an interchange fee, but nonetheless are supported by payments to the issuer funded by merchant fees.
More broadly, all the elements I have mentioned – interchange fees, transparency and surcharging – are interrelated, which means that there are potentially multiple paths to achieving similar outcomes. I encourage those with an interest to engage with the Bank in the review process in the period ahead.
Turning away from the Financial System Inquiry to other matters, let me mention two.
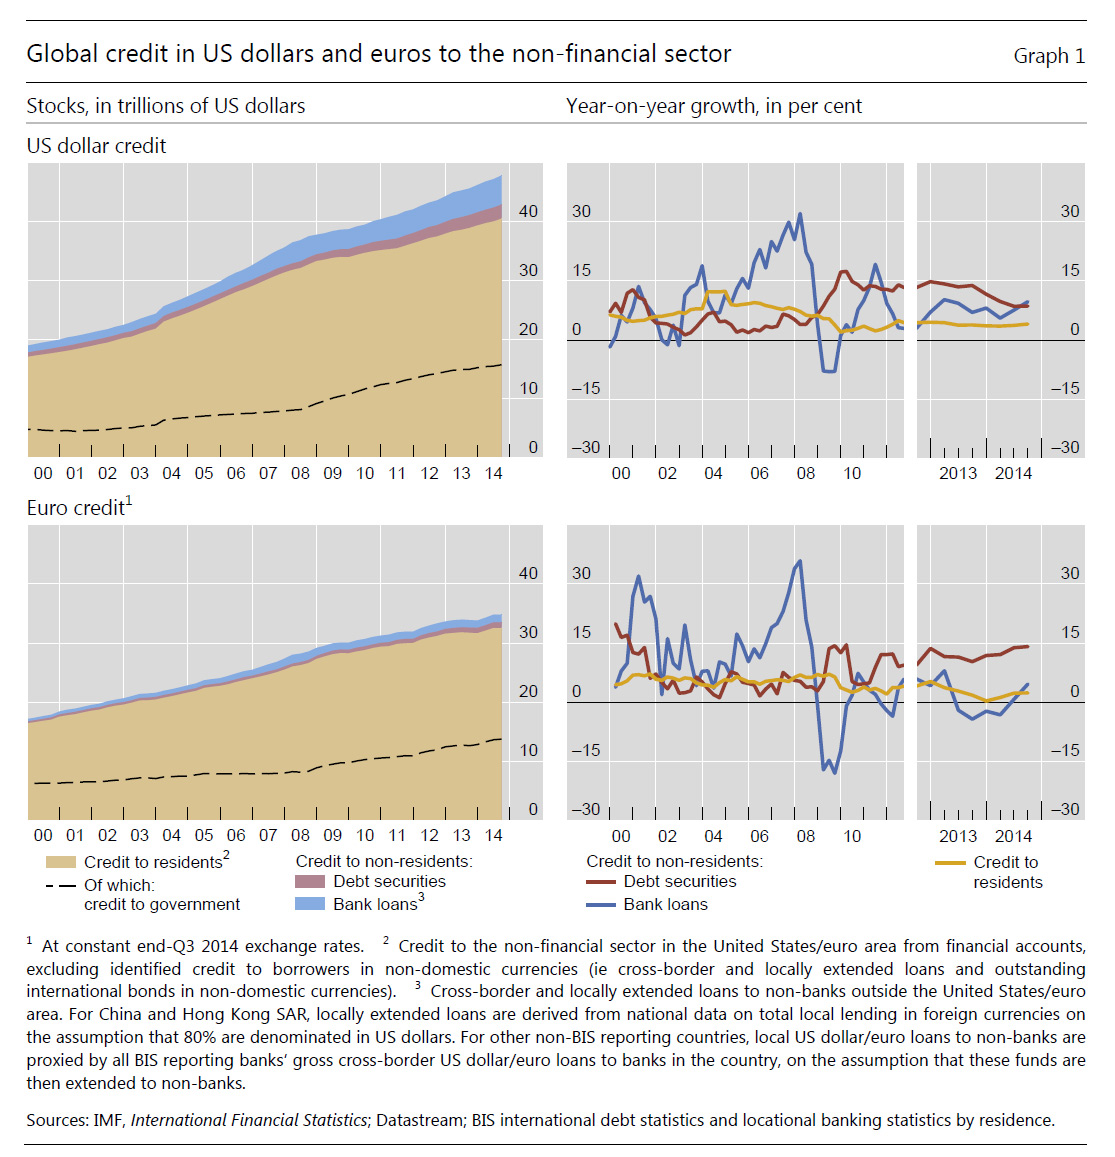
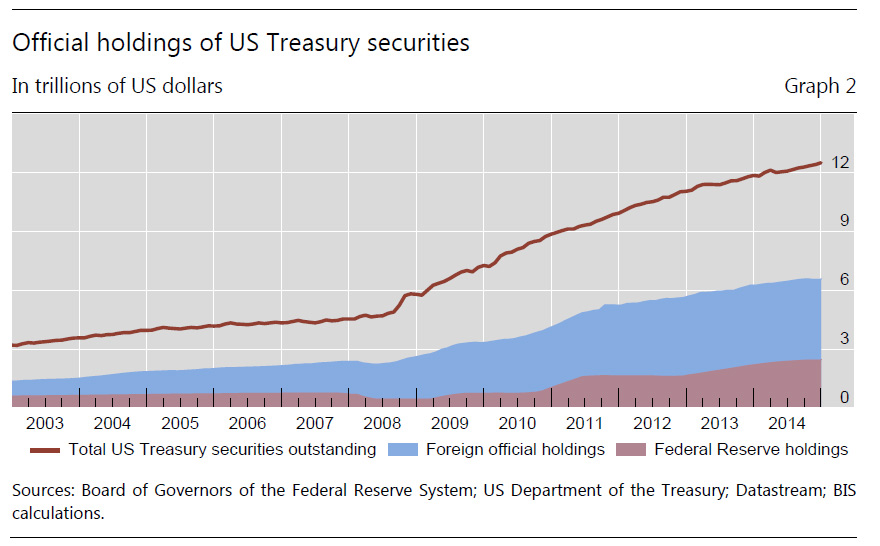
I said at the beginning that the ‘search for yield’ continues. There is a line of discussion that tackles this issue from a cyclical point of view, thinking about how the balance sheet measures taken by the major central banks are affecting markets, the extent and nature of cross-border spillovers, what happens when the US Federal Reserve starts to tighten policy at some point and so on. I’ve spoken about such things elsewhere and have nothing to add today.
There is another conversation, however, that tends to take place at a lower volume, but which definitely needs to be had. That conversation is about what all this means for the retirement income system over the longer run. The key question is: how will an adequate flow of income be generated for the retired community in the future, in a world in which long-term nominal returns on low-risk assets are so low? This is a global question. Just about everywhere in the world the price of buying a given annual flow of future income has gone up a lot. Those seeking to make that purchase now – that is, those on the brink of leaving the workforce – are in a much worse position than those who made it a decade ago. They have to accept a lot more risk to generate the expected flow of future income they want.
The problem must be acute in Europe, where sovereign yields in some countries are negative for significant durations. But it is also potentially a non-trivial issue in our own country. In a conference about wealth, this might be a worthy topic of discussion.
And the final issue is misconduct. This has loomed larger for longer in many jurisdictions than we would have thought likely a few years ago. Investigations and prosecutions for alleged past misconduct are ongoing. It seems our own country has not been entirely immune from some of this. Without in any way wanting to pass judgement on any particular case, root causes seem to include distorted incentives coupled with an erosion of a culture that placed great store on acting in a trustworthy way.
Finance depends on trust. In fact, in the end, it can depend on little else. Where trust has been damaged, repair has to be made. Both industry and the official community are working hard to try to clarify expected standards of behaviour. Various codes of practice are being developed, calculation methodologies are being refined, and so on.[1] In some cases regulation is being contemplated. Initiatives like the Banking and Finance Oath also can make a very worthwhile contribution, if enough people are prepared to sign up and exhibit the promised behaviour.
In the end, though, you can’t legislate for culture or character. Culture has to be nurtured, which is not a costless exercise. Character has to be developed and exemplified in behaviour. For all of us in the financial services and official sectors, this is a never-ending task.


