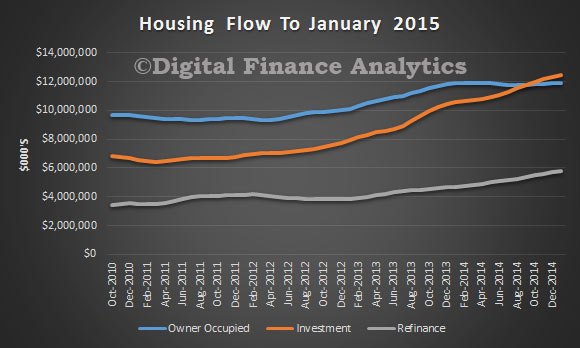
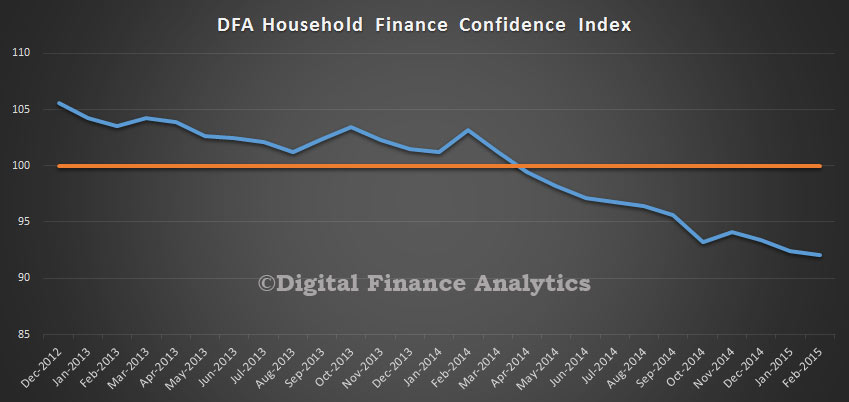
Mark Carney, Governor, Bank of England, gave a speech on Inflation. I have summarised his arguments in this post because the current low inflation rates around the world have profound implications, and current inflation targets and assumptions reflect earlier responses to hyper inflation, which may not be so relevant now. That said, low inflation appears to carry significant risks, and low interest rates do not help.
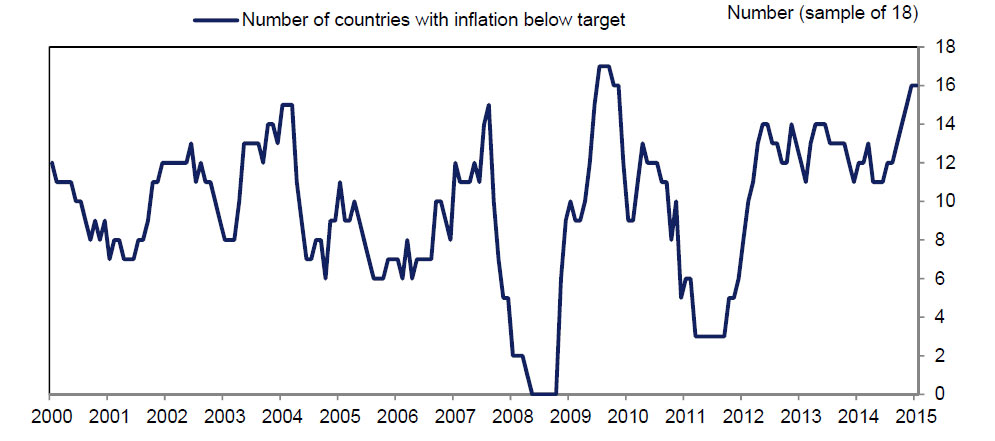
16 of 18 inflation targeting economies had inflation below target in January 2015. These include US, UK, Canada, euro area, Norway, Sweden, Switzerland, Australia, China, India, Indonesia, Malaysia, New Zealand, Philippines, South Korea, Taiwan, Thailand and Brazil. 11 of those countries have inflation rates below 1%.
 For example, the Reserve Bank of New Zealand, said yesterday:
“Annual CPI inflation is expected to fall to around zero in the March quarter and remain low over 2015, reflecting the high exchange rate, low global inflation, and the recent falls in petrol prices. Inflation expectations appear to have fallen recently, and we will be closely monitoring the impact of this trend on wage and price setting behaviour, especially in the non-traded sector.”
There are some significant implications of this low inflation environment, especially bearing in mind that these countries are using central bank monetary policy to try and wrangle inflation above 2%. This 2% inflation seems to reflects the lessons of the past, including the fight against high inflation in the 1970s and 1980s, as well as the deflationary disasters that have followed past financial crises. The target is set by government, but managed by the central bank. Indeed, the banks have to explain to the politicians if inflation falls outside the target band. Mark Carney has just written an open letter to the UK Chancellor addressing the current low inflation there.
Whilst high inflation damages growth, in part, because high inflation also tends to be volatile, generating uncertainty that makes important economic decisions more difficult. In contrast, a little inflation ‘greases the wheels’ of the economy, helping it to absorb shocks. A positive average inflation rate also gives monetary policy space to respond to negative shocks by cutting interest rates. Persistently low inflation can be difficult. Deflation proper is potentially dangerous. During the Great Depression, sharp falls in prices reinforced collapsing output and skyrocketing unemployment.
A commonly cited reason is that falling prices prompt households and firms to delay spending and investment. The subsequent reduction in demand causes further reductions in prices through higher unemployment. That further reduces incomes and spending, drawing the economy into the vortex. But there is a more clear and present danger arising from the balance sheets of households and firms should deflation persist. When a household takes out a mortgage or a firm secures a loan, the amount owed is denominated in cash terms – that is, not adjusted for inflation. Unexpected, generalised, and persistently falling prices then mean the real value of debt increases: the same amount of money is owed, but that money now buys more goods and services. As a result, more consumption or investment needs to be foregone to service the debt. This debt-deflation dynamic was at the core of the Great Depression and in the Japanese malaise following the collapse of the asset bubbles of the 1980s. It would be a particular concern if the pace of wage growth were to follow prices down.
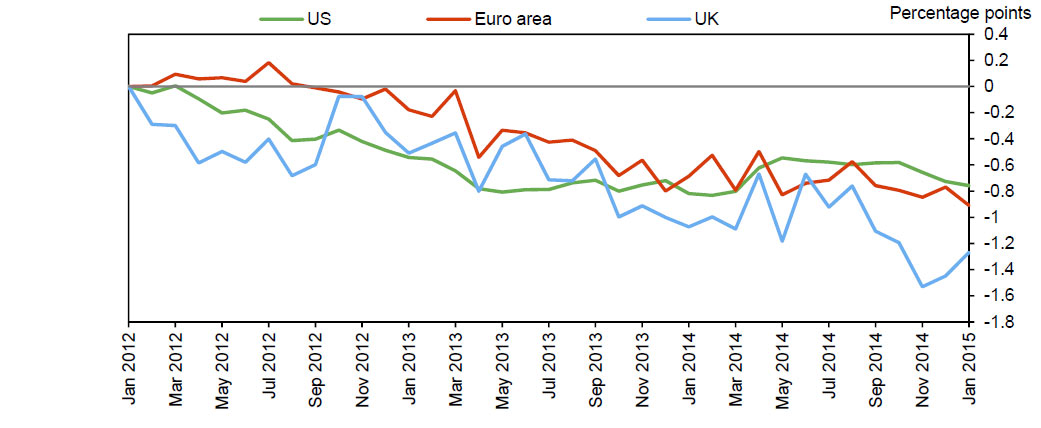
Whilst falling oil prices have impacted inflation, even “core inflation” which strips out such volatile factors continues to fall.
 In some major economies there are additional disinflationary forces. For example, in the euro area, a series of necessary internal devaluations are weighing on wages and prices. In China, a rebalancing of investment and consumption risks generating further disinflation. The producer price inflation rate has been negative for 35 months in a row, reflecting long-standing overcapacity in industries such as concrete and steel, while the more recent weakness in the property market could further increase excess capacity in related sectors. All this suggests a persistent period of low inflation globally is a possibility, and could itself create a self-fulfilling fear of a bad outcome. Concerns that household or government debt will weigh on demand could cause firms to delay further their already weak investment spending. Such rational corporate caution is consistent with the behaviour of many financial asset prices, which appear to be pricing the possibility of material downside tail risks, such as that economic weakness and persistently low global inflation become mutually reinforcing. Those expectations matter as they feed into the wage and price setting processes that ultimately determine inflation.
Protracted global weakness could heighten the challenge of returning inflation quickly to target. That’s because weak global conditions would tend to push down on the equilibrium interest rate that would maintain demand in line with supply and inflation at the target. This equilibrium rate has likely been falling for the last three decades and turned sharply negative in the downturn. This meant central banks had to turn to unconventional policy tools to stimulate their economies in order to return inflation to target. In the cases of the UK and the US, these measures have been effective in supporting domestically generated inflation. Inflation is likely still to be negative in many countries, reflecting an excess of saving over investment.