At its meeting today, the Board decided to leave the cash rate unchanged at 2.25 per cent.
Moderate growth in the global economy is expected in 2015, with the US economy continuing to strengthen, even as China’s growth slows a little from last year’s outcome.
Commodity prices have declined over the past year, in some cases sharply. The price of oil in particular is much lower than it was a year ago. These trends appear to reflect a combination of lower growth in demand and, more importantly, significant increases in supply. The much lower levels of energy prices will act to strengthen global output and temporarily to lower CPI inflation rates. Prices for key Australian exports have also been falling and therefore Australia’s terms of trade are continuing to decline.
Financial conditions are very accommodative globally, with long-term borrowing rates for several major sovereigns at all-time lows. Financing costs for creditworthy borrowers remain remarkably low.
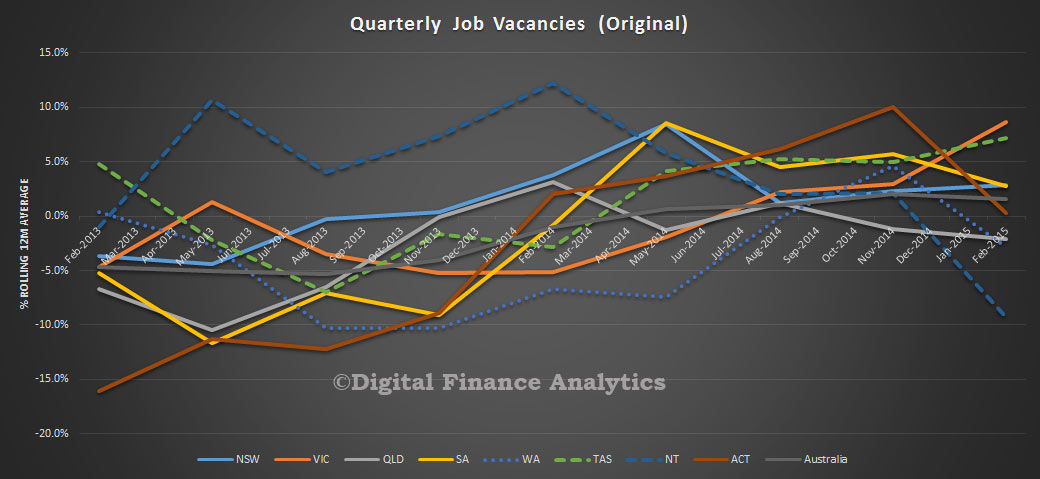
In Australia the available information suggests that growth is continuing at a below-trend pace, with overall domestic demand growth quite weak as business capital expenditure falls. As a result, the unemployment rate has gradually moved higher over the past year. The economy is likely to be operating with a degree of spare capacity for some time yet. With growth in labour costs subdued, it appears likely that inflation will remain consistent with the target over the next one to two years, even with a lower exchange rate.
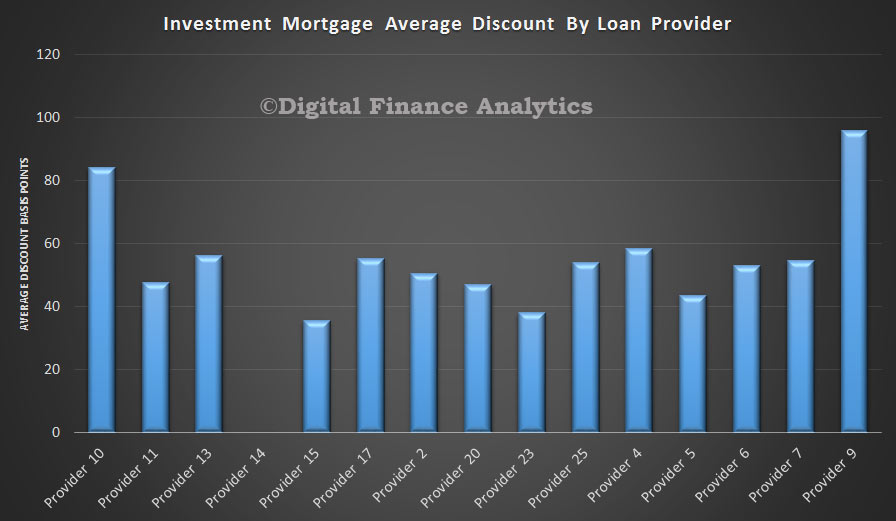
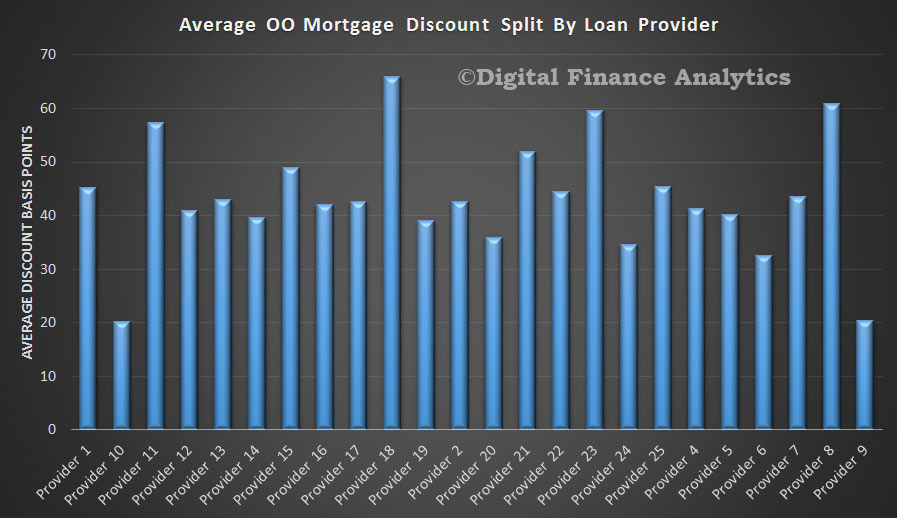
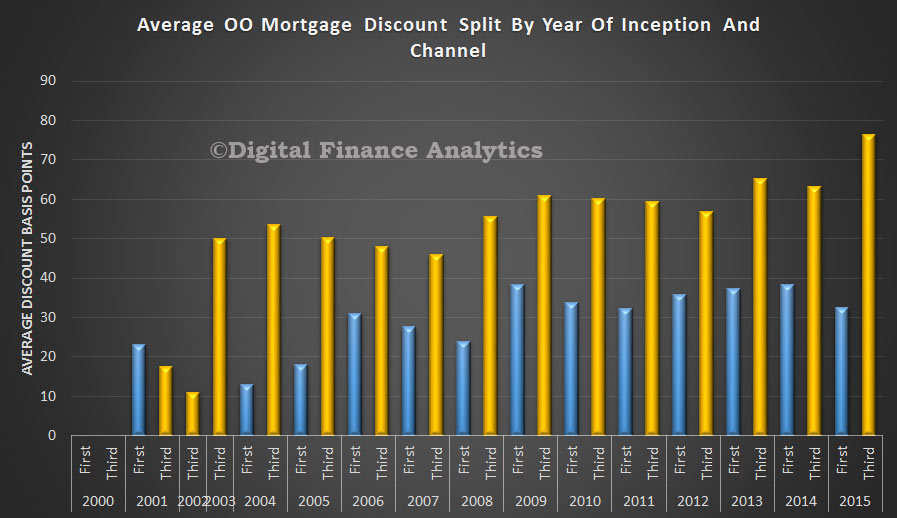
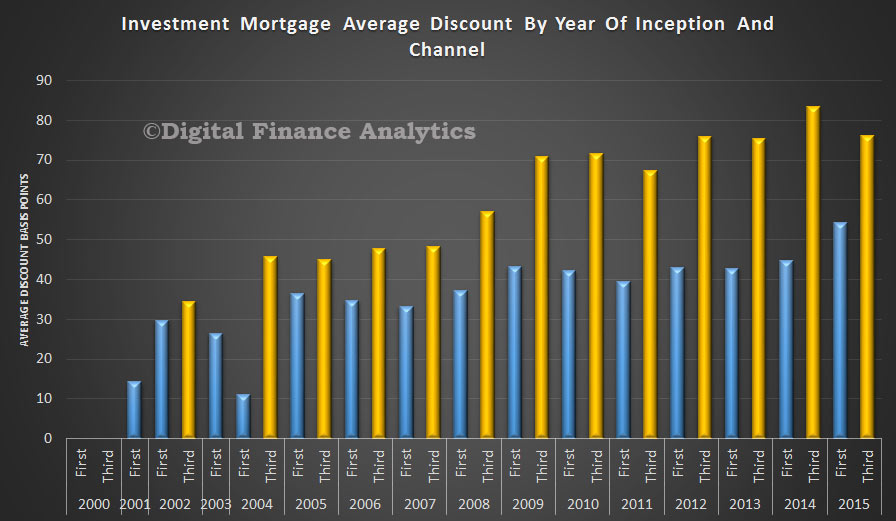
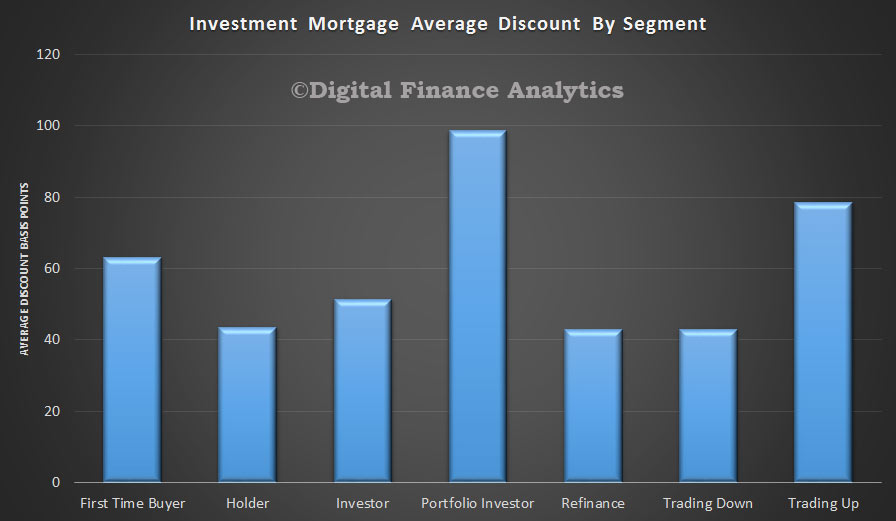
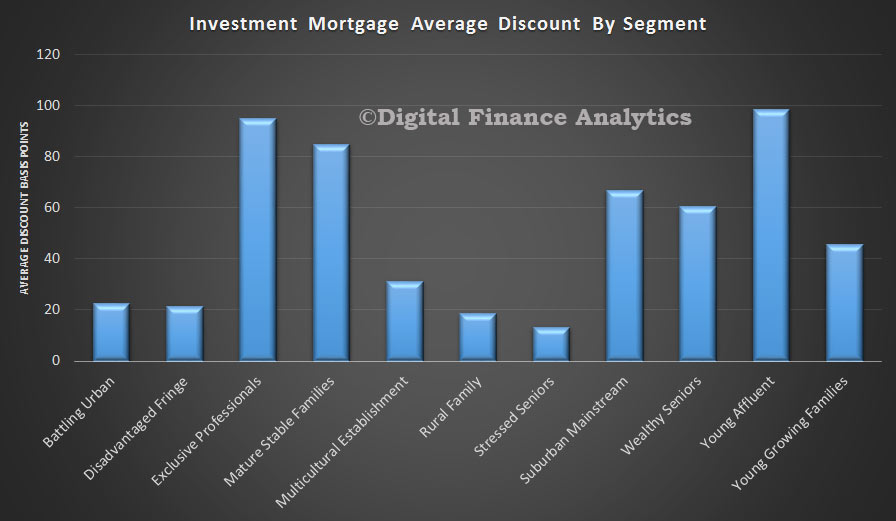
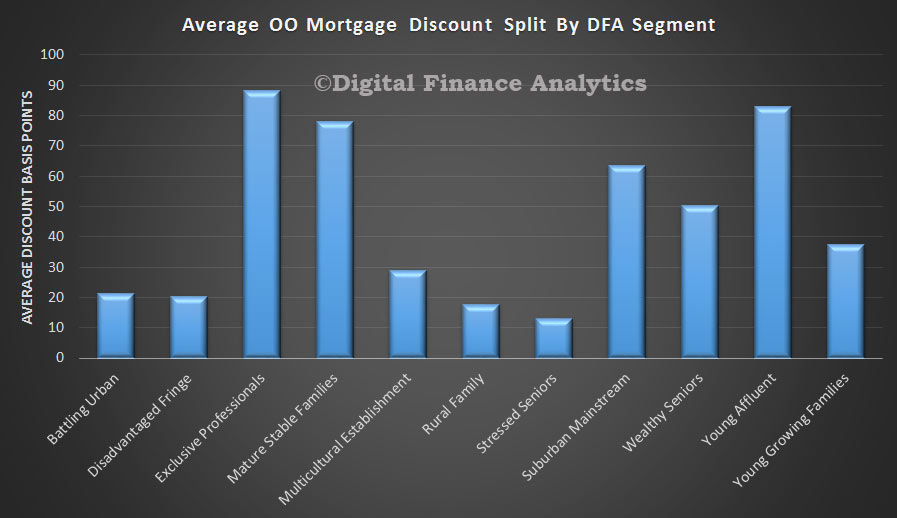
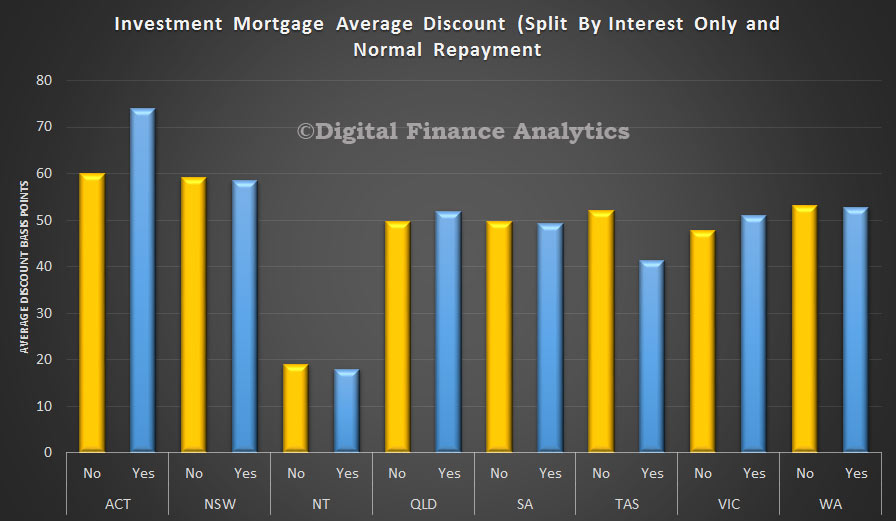
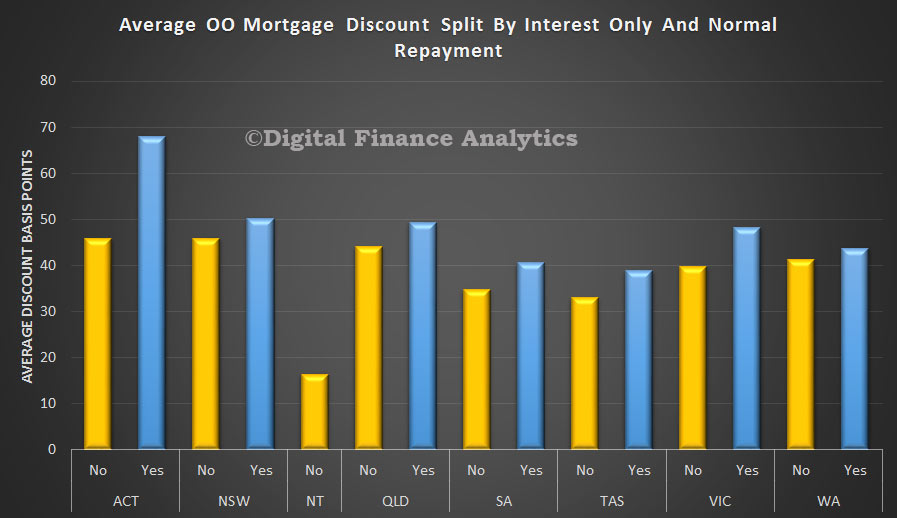
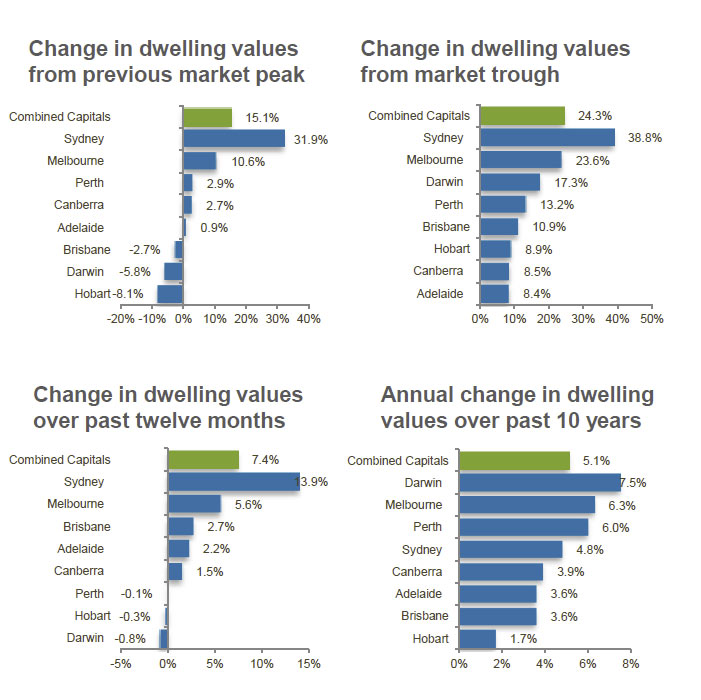
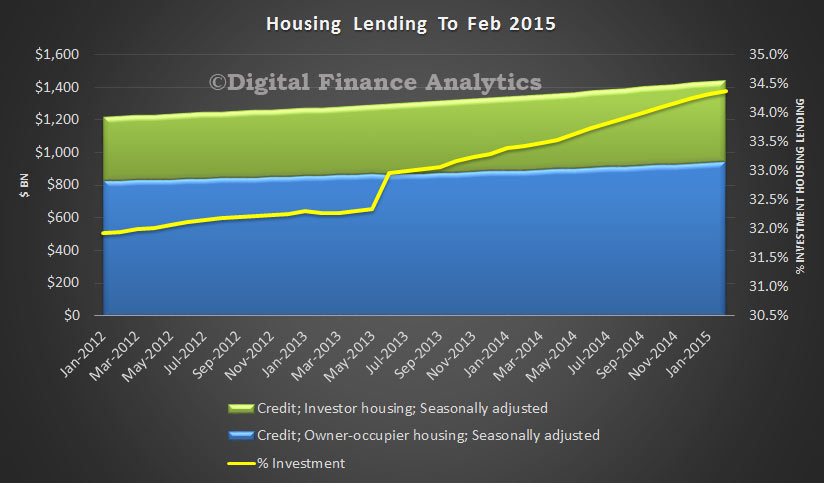
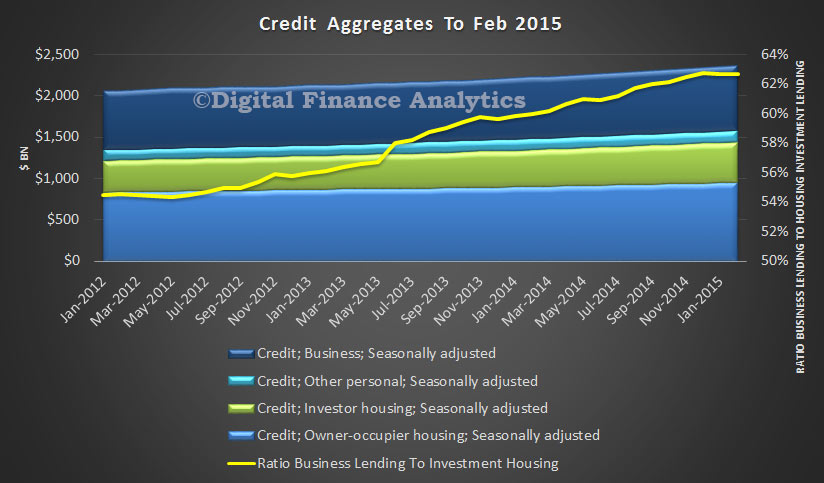
Credit is recording moderate growth overall. Growth in lending to investors in housing assets is stronger than to owner-occupiers, though neither appears to be picking up further at present. Lending to businesses, on the other hand, has been strengthening recently. Dwelling prices continue to rise strongly in Sydney, though trends have been more varied in a number of other cities. The Bank is working with other regulators to assess and contain risks that may arise from the housing market. In other asset markets, prices for equities and commercial property have risen, in part as a result of declining long-term interest rates.
The Australian dollar has declined noticeably against a rising US dollar over the past year, though less so against a basket of currencies. Further depreciation seems likely, particularly given the significant declines in key commodity prices. A lower exchange rate is likely to be needed to achieve balanced growth in the economy.
At today’s meeting the Board judged that it was appropriate to hold interest rates steady for the time being. Further easing of policy may be appropriate over the period ahead, in order to foster sustainable growth in demand and inflation consistent with the target. The Board will continue to assess the case for such action at forthcoming meetings.