CoreLogic RP Data just released their rental data to December 2014. Over the 2014 calendar year, advertised rental rates on a national basis increased by 2.6 per cent for both houses and units. At a capital city level, the rental performance across the different housing stocks was more varied. House rents rose by 1.2 per cent over the year, while unit rents outperformed the detached housing market, up 2.5 per cent over the 12 months to December 2014.
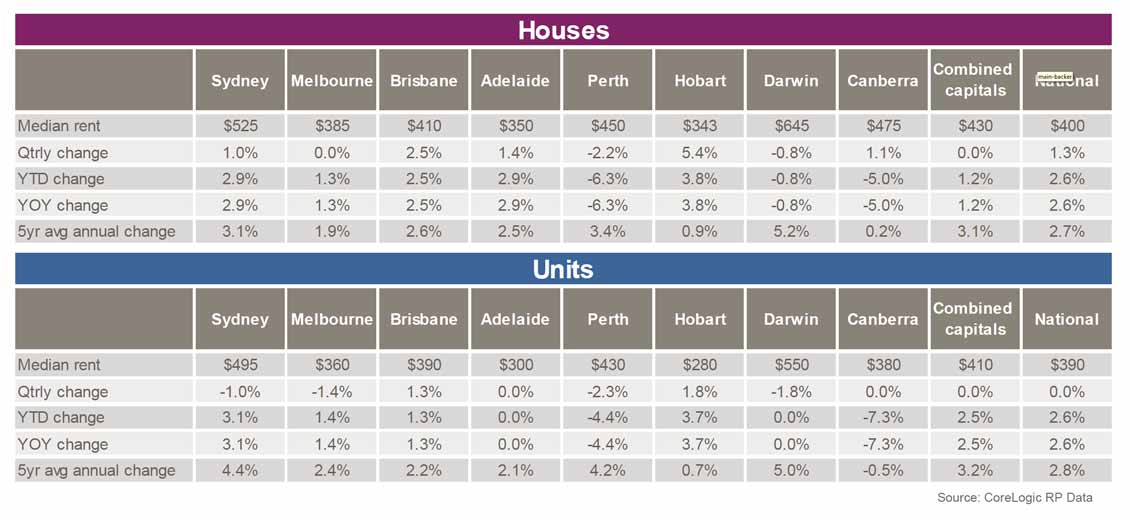 Quarterly movements. Capital city advertised rents remained unchanged over the final quarter of 2014, with house rents steady at $430 per week and unit rents recorded at $410 per week. Across Australia, house rents increased by 1.3 per cent to $400 per week, while unit rents were unchanged over the three months to December at $390 per week.
For houses, the performance across each individual capital city market was varied. Hobart houses saw rents rise by the most, up 5.4 per cent over the three month period, while Brisbane (2.5 per cent), Adelaide (1.4 per cent), Canberra (1.1 per cent) and Sydney (1.0 per cent) saw rents rise by a more moderate amount. Perth (-2.2 per cent) and Darwin (-0.8 per cent) were the weakest performing rental markets for houses over the three month period. Melbourne was the only capital city market to record no change, with weekly rents for houses stable at $385 per week. The performance across the unit market at a capital city level was somewhat weaker. Hobart (1.8 per cent) and Brisbane (1.3 per cent) were the only capital cities in which rents rose over the three months to December, while all other cities saw rents fall over the last quarter of 2014 with the exception of Adelaide and Canberra where no change was recorded.
Annual movements. Nationally, advertised rents are 2.6 per cent higher than they were in December 2013 for both houses and units, while across the combined capital cities house rents have risen by 1.2 per cent, compared to a stronger level of growth for unit rents which rose by 2.5 per cent. Over the year to December 2014, for houses, the strongest performing capital city market in terms of rental increases was Hobart, where the median advertised weekly rental rate was 3.8 per cent higher. Sydney, Adelaide (both 2.9 per cent), Brisbane (2.5 per cent) and Melbourne (1.3 per cent) all had rents higher in December 2014 when compared to December 2013. Perth (-6.3 per cent) and Canberra (-5.0 per cent) were by far the weakest performing capital city markets for growth in advertised house rents.
Similar to houses, Canberra (-7.3 per cent) and Perth (-4.4 per cent) were the weakest performers amongst the capital city unit rental markets and were the only two cities to see rents fall over 2014. Unit rents for both Adelaide and Darwin remained unchanged over the year, while Hobart (3.7 per cent) and Sydney (3.1 per cent) were the strongest performers.

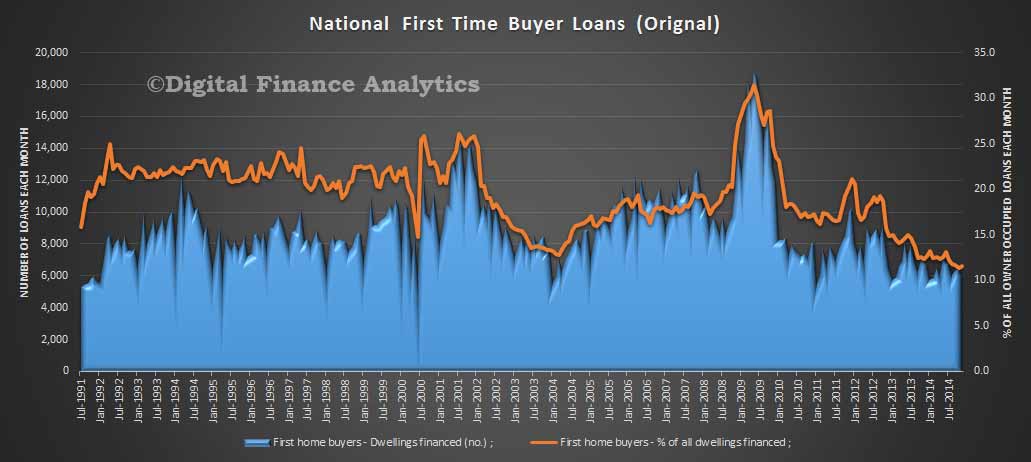 The latest ABS data highlights the fact that in some states, especially NSW, FTB activity is very low (7%), whereas in WA its over 20% of owner occupied loans.
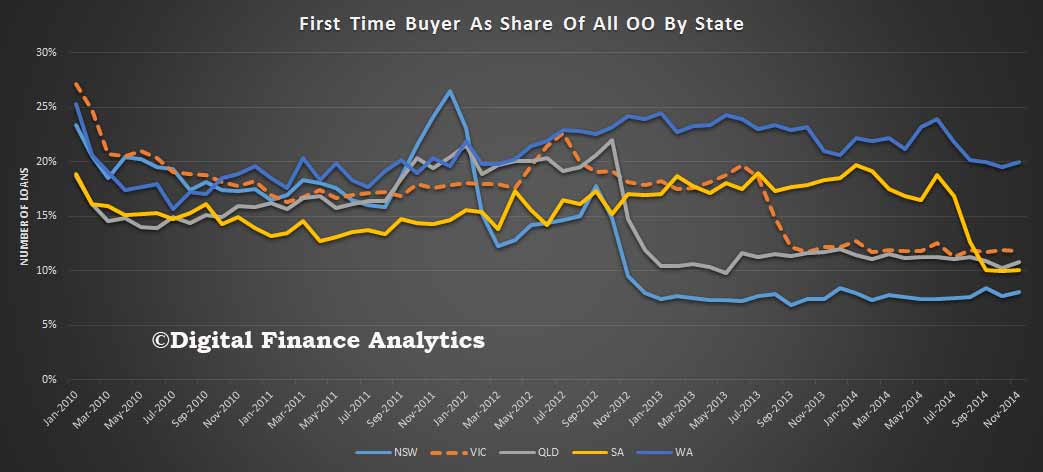 If we look at the relative share of FTB transactions we see that there are more FTB loans being written in WA and VIC than NSW.
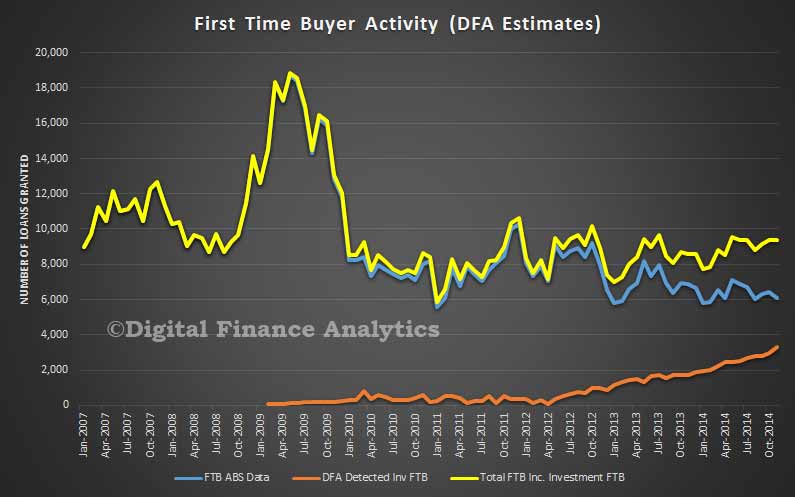
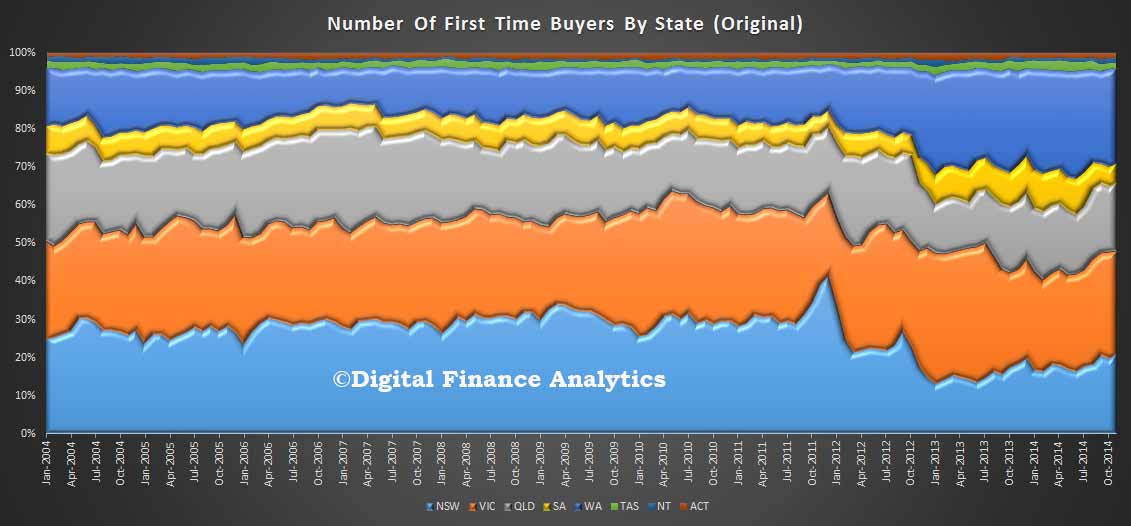 But this is not the full story. As we already highlighted our household surveys have detected a significant rise in the number of FTB who are going directly into the investment market. We can estimate the proportion of FTB who are taking this route, using DFA data.
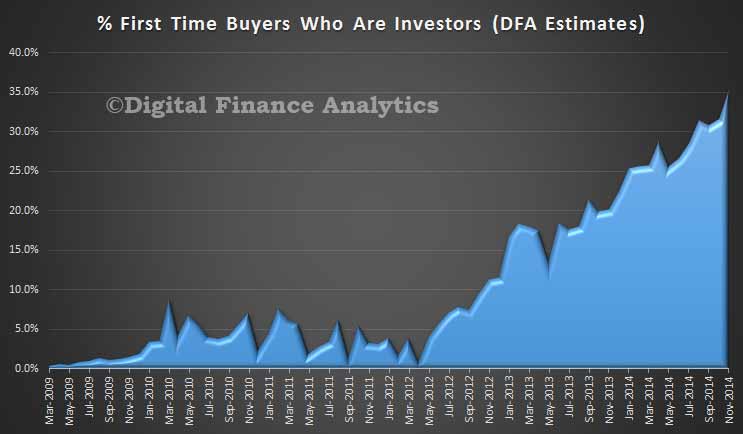 Now, if we make adjustments to the ABS data to take account of the trend we see that FTB are more active than might be thought. In fact the rate of activity has remained at about 9,500 loans each month since mid 2013. Its just that the ABS data does not capture the full statistics.