Making The News – The Property Imperative Weekly 22 September 2018

Welcome to the Property Imperative weekly to 22nd September 2018, our digest of the latest finance and property news with a distinctively Australian flavour.

Watch the video, listen to the podcast, or read the transcript.

The 60 Minutes segment which aired last Sunday put the cat among the pigeons. I made a significant contribution to the programme, both in helping to shape the story and through my interviews. You can watch the segments on YouTube, and also an additional “extra minutes” segment which was a longer form selection from my comments.

And by the way you value the content we produce please do consider joining our Patreon programme, where you can support our ability to continue to make great content.

Of course, the property spruikers accused the programme of misrepresentation, and some other contributors complained after it had aired. As I discussed in my live stream event last Tuesday, (where by the way we had more than 400 participate live, a record) they represented my views accurately, but noted that we were talking a worst case scenario case of home prices falling 40-45% over 3 years, and that the headline in the introduction that it would be “within 12 months” did not come from me. Speaking to the editor, it appears this was from the Liquidator which was also featured in the segment. As a result, we suspect the ABC’s Media Watch may be looking at the segment.

So to be clear, there is a 20% chance, on my estimation, that due to a disruption in the international capital markets, the property edifice here could collapse, as a result of less liquidity, inflated prices well above true value, dodgy lending practices as highlighted by the Royal Commission, and strained household budgets thanks to flat incomes and rising costs. But, and this is important, there is still time for policy makers and regulators to wake up and take steps to alleviate the risks. But time is getting short in my view.

Oh, and you can also read about the wager I refused to accept from The Kouk, and the article I wrote for 60 Minutes “The Debt Bomb Which No One Wants to Talk About” which outlines my perspective. Overall, I believe this was an important event in raising public understanding of the issues we face.  I reject the acquisition I was scaremongering, because if you have been following my channel, you will have heard it all before. Perhaps it will help some households from making poor decisions.

Remember my analysis is data driven, and the signs are still showing further falls. For example, CoreLogic says a total of 1,983 homes were taken to auction across the combined capital cities last week; a slight increase on the week before. But the weighted average clearance rate dropped to 51.8 per cent, which was not only lower week-on-week (55.3 per cent), but the lowest seen since Dec-12.

The two largest auction markets of Melbourne and Sydney both recorded a lower clearance rate week-on-week. Melbourne returned a final clearance rate of 54.1 per cent, down on the 60 per cent over the previous week. While over half of the Sydney homes taken to auction last week failed to sell, returning a final clearance rate of 48.6 per cent, decreasing on the 50.6 per cent over the week prior.  Both markets did see a slightly higher volume of auctions over the week, with volumes across Melbourne up by 10.9 per cent, while Sydney saw a 2 per cent rise in volumes.

As usual the performance across the smaller auction markets was mixed, with Canberra recording the strongest final clearance rate of 65.2 per cent, while only 33.3 per cent of Tasmanian homes sold.  However, Brisbane and Perth were the only auction markets to see a week-on-week improvement in clearance rates. Across the regional auction markets, Geelong returned the strongest clearance rate of 60.6 per cent. In terms of volumes, the Gold Coast saw the highest number of auctions (58), however only 31.9 per cent sold. CoreLogic says a higher number of auctions are scheduled this week, with a total of 2,277 homes scheduled for auction, up 15 per cent on last week’s final figures, although lower than one year ago when 2,782 capital city homes went to auction. It looks like a weak spring sales season so far.

Domain also released research explaining the strong correlation between auction clearance rates and dwelling prices and confirms the buyers’ market at the moment.     They showed the rolling annual clearance rate (Australia wide) alongside annual growth in the Domain median dwelling price and observed that annual movements in the two indicators are highly aligned over the past 20 years, and are strongly correlated. Steady demand in the property market is generally regarded as a clearance between 60 per cent and 70 per cent. Any lower than 60 per cent and it is thought the market is slowing down. Prices are going down in a buyers’ market.  Indeed, In the week ended 20 September 2018, the CoreLogic 5-city daily dwelling price index, which covers the five major capital city markets, declined another 0.17%, with Melbourne falling by 0.28% and Sydney by 0.14%, again showing that Melbourne is seeing the strongest declines, after a later run up.

The ABS Home Price Series data came out on Tuesday, just in time for our live event. The total value of residential dwellings in Australia was $6,9 trillion at the end of the June quarter 2018, falling $13.2 billion over the quarter. A first, for years, and hardly reported. But this is significant! We need to get use to more falls ahead. Of course it varies by locations and property types. The mean price of residential dwellings fell $4,100 to $686,200 despite the number of residential dwellings rising by 40,800 to over 10 million in the June quarter 201

The price index for residential properties of the eight capital cities fell 0.7% in the June quarter 2018. The index fell 0.6% through the year to the June quarter 2018. So the falls are accelerating and the more recent CoreLogic series shows further falls ahead. The capital city residential property price indexes fell in Sydney (-1.2%), Melbourne (-0.8%), Perth (-0.1%) and Darwin (-0.9%), and rose in Brisbane (+0.7%), Hobart (+3.0%), Adelaide (+0.3%) and Canberra (+0.6%). Annually, residential property prices fell in Darwin (-6.1%), Sydney (-3.9%) and Perth (-0.9%), and rose in Hobart (+15.5%), Canberra (+3.0%), Melbourne (+2.3%), Adelaide (+2.1%) and Brisbane (+1.7%). Finally, the total number of property transfers were also significantly down.

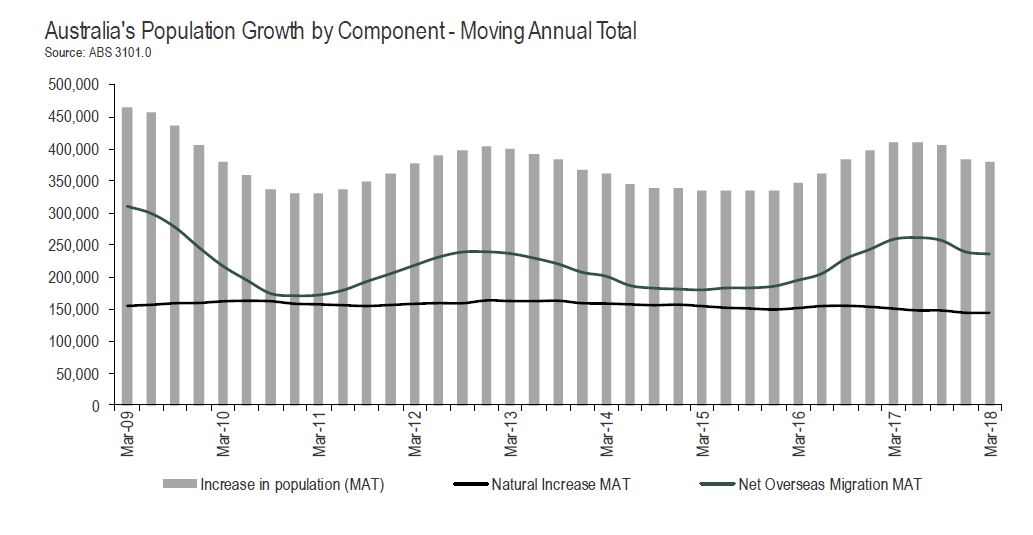
Also this week the latest migration figures from the ABS showed that a 9% fall since visa changes made in April 2017. No surprise then the HIA bemoaned the fall, pointing to slowing demand for new property. In fact, Australia’s annualised population growth rate slowed for the fourth consecutive quarter. Over the year to March 2018, Victoria saw the strongest growth in population (+2.2 per cent), followed by the ACT (+2.1 per cent) and Queensland (+1.7 per cent). New South Wales was fourth fastest (+1.6 per cent) with Tasmania fifth (+1.0 per cent), Western Australia sixth (+0.8 per cent) and South Australia seventh (+0.7 per cent). The population of the Northern Territory has actually declined over the last two quarters and the annual rate of growth has slowed to 0.1 per cent.

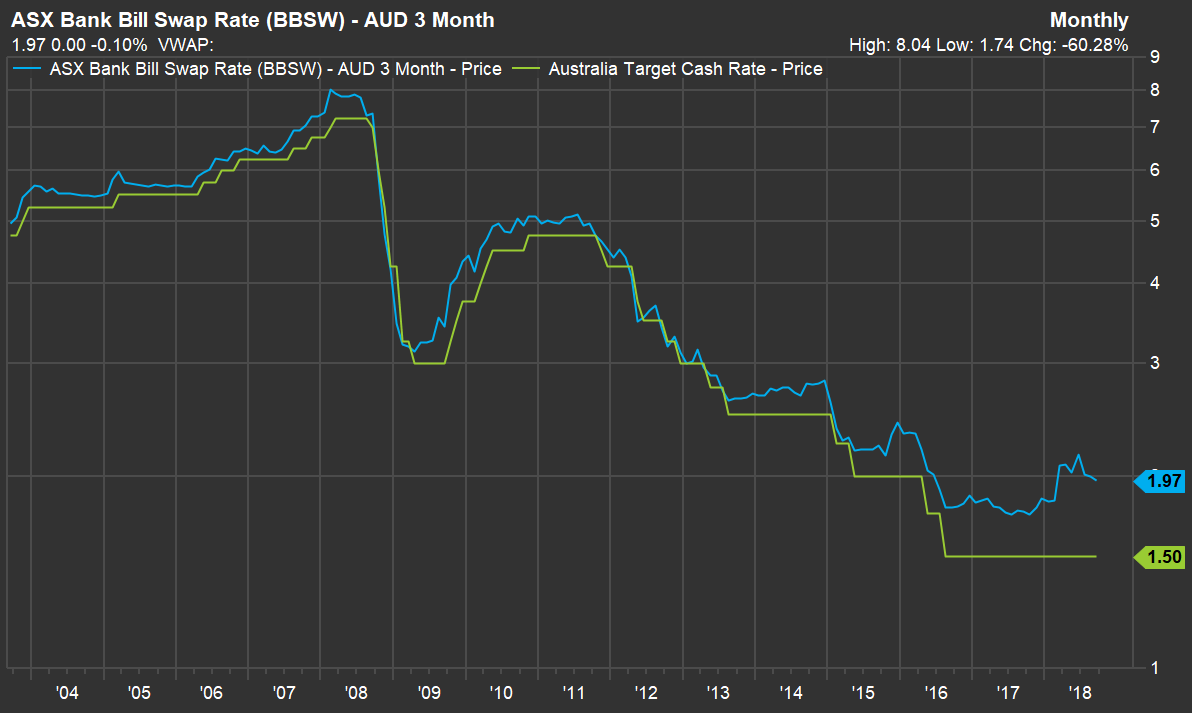
This week we saw more tweaks in mortgage rates, as the recent hikes to existing loans start hitting households. ING says it is increasing variable rates for investor mortgage customer by 15 basis points. The changes come into effect from Tuesday 25 September and is for both new and existing investor loan customers. The banks have blamed the higher funding costs. Actually the BBSW has come back somewhat, but remains elevated. The point is as the majors fund some of their book from short term sources the funding gap is real and sustained. That said, Westpac made some aggressive moves by discounting mortgage rates for selected new customers, essentially funding the attempt to grow share from the higher returns from existing borrowers.  Bottom line is there is merry dance of cross subsidization in play as existing borrowers are forced to pay more, (the back book) while certain classes of refinancing and first time buyers are being enticed.  However, bearing in mind that home prices are likely to fall further, buyers should beware.  Always read the small print! We also wonder how sustainable these discounts are given current margin pressures. But I guess volume and margin are being traded off at least to an extent!

UBS has once again highlighted the issues relating to Interest Only Loans, According to UBS’ Australian Banking Sector Update on 19 September, which involved an anonymous survey of 1,008 consumers who took out a mortgage in the last 12 months, 18 per cent stated that they “don’t know” when their interest-only (IO) loan expires, while 8 per cent believed their IO term is 15 years, which doesn’t exist in the Australian market. The research found that less than half of respondents, or 48 per cent, believed their IO term expires within five years. They said “We believe the royal commission creates an inflection point and credit conditions are tightening materially. Whether Australia can orchestrate an orderly housing slowdown remains to be seen, and we think the risks of a credit crunch are rising given the significant leverage in the Australian household sector.”

And the Royal Commission concluded its hearing relating to the Insurance sector in Australia. More damming evidence highlighting poor behaviour in terms of mis-selling insurance products, charging premiums to dead people, failing to handle claims fairly, illegal behaviour, and further failures of the regulators to fulfil their role. The law is also missing in action in a number of critical areas, including claims processing. Indeed, the small fines imposed on these large and profitable businesses were just seen as a small cost of doing business.  More to come when the interim report is due at the end of the month.  But the behaviour of corporate Australia is once again in the dock. Shameful.

Citi made the point that the Royal Commission exposes “systemic over lending” saying In our view the most material conclusion of the commission is likely to be that the lending process presently isn’t sufficiently responsible. Responses to this issue are likely to involve increased due diligence which will impact the growth and availability of credit further to existing measures. [Bank systems] have allowed them to lend too much…This is visible across the system, with issues in mortgage broking all the way through to expense verification. [Leading to] adverse customer outcomes as evidenced by more leverage and higher loan balances for broker loans. [This will lead to] a spate of legal consequences and ongoing litigation.  [HEM could be banned because it led to] adverse customer outcomes as evidenced by more leverage and higher loan balances for broker loans”. We agree, our data is pointing the same way. This is why the current credit tightening is not temporary, but marks a shift back simply to more normal sensible practices. The debt bomb though is baked in.

That said, S&P said that based on the expectation that the general government fiscal position will return to surplus by the early 2020s, as the central government’s continued focus on fiscal prudence turns higher revenue collection into better budget performance. They view the government as having significant revenue flexibility to achieve this based on its track record of raising general government revenue faster than the growth of nominal GDP. So they revised their outlook on Australia to stable from negative and affirming our ‘AAA’ long-term and ‘A-1+’ short-term ratings. They said that “the stable outlook reflects our expectations that the general government fiscal balance will return to surplus by the early 2020s. We expect steady government revenue growth supported by the strong labour market and relatively robust commodity prices, to be accompanied by expenditure restraint. We also expect property prices to continue their orderly unwind, and that this slowdown won’t weigh heavily on consumer spending and the financial system’s asset quality. So that’s alright then.

This despite further delinquency rate rises in their SPIN monthly report for July. Although Australian prime home loan arrears rose year on year in July they remained unchanged month on month at 1.38% since May, but up from 1.17% a year earlier. This despite arrears normally falling at this time of year. They say that high household indebtedness and low wage growth have increased borrowers’ sensitivity to interest-rate rises. Some borrowers, including those with higher LTV ratios, are more exposed to rising interest rates, particularly at a time when lending standards are tightening and refinancing opportunities are diminished. However, Australian RMBS portfolios’ exposure to such borrowers is not significant (exposure to loans with an LTV ratio in excess of 80% is 13%). In other words, the RMBS portfolio is not necessarily representative of the wider market.

Arrears movements were mixed nationwide, with New South Wales reporting a month-on-month increase in mortgage arrears in both percentage and dollar terms, while in Victoria there was a decline in loans more than 30 days in arrears. Arrears remained at a record high in Western Australia, but the Northern Territory took the nation’s top spot again in July, with arrears at 2.67%. Australian RMBS portfolios’ exposure to the Northern Territory is minimal, at just under 1%. The trends in NSW are concerning, and mirror the growth in mortgage stress we are seeing.

Turning briefly to the local markets, the banks were mixed, with NAB down 0.32% on Friday to 27.66 and ANZ higher, up 0.14% to 28.46. The ASX 200 Financials Index move a little higher, up 0.14% on Friday to 6,159, but remains below the peak last November before the Royal Commission kicked off. Frankly, we think the financial sector is in for a rough patch as the output from the inquiry hits, and more class actions, like the one announced by Maurice Blackburn Lawyers who are preparing court proceedings against the major banks and brokers in regards to alleged breaches of the NCCP.

Turning to the Aussie, the main bear trend is getting tested as the AUD/USD is nearing the 50-day simple moving average and the multi-month bear trendline from late January 2018. It ended on Friday at 72.91 a couple of percent high, and it could break above the 72.94-73.07 zone (August 13 high) to target 73.83 August 21 high and 74.85 July 10 high.  This is in reaction to a weaker USD, as we will see shortly.

So to the US, where the Dow soared to record highs for a second-straight day Friday as defensive stocks turned to offense on falling U.S. Treasury yields.  Trade-sensitive stocks such as Boeing and Caterpillar pushed the Dow into record-setting territory this week, as both posted strong weekly gains.  The VIX fear index was lower, again, down 1.02% to 11.68, signalling relatively steady sailing in the near term.

The Dow Jones Industrial Average rose about 0.32% to 26,743. On the other hand, the S&P 500 fell 0.04% to 2,929., while the tech-heavy Nasdaq Composite fell 0.51% to 7,987. But beware, trading was volatile today due to quadruple witching, where stock options, stock index options, stock index futures and single stock futures expire. I’ll be very surprised if the Fed doesn’t raise rates at the upcoming meeting but it’s also the end of the quarter and “THEY” want to keep the market at record highs – so they can print up pretty charts and graphs to show you how you need to put your money in the markets.

The 10-year Treasury yield slipped on Friday, following strong early-week gains as the benchmark Treasury breached the key psychological 3% level earlier this week ahead of a widely-expected U.S. interest rate hike next week.  The gap to the short term – here the LIBOR rate is still compressed warning of potential stress ahead.

The Fed will make a policy adjustment on Wednesday (2pm) and also will extend their economic projections out to 2021 for the first time – so that will be interesting. Ray Dalio, who founded Bridgewater Associates, the world’s biggest hedge fund, this month predicted the U.S. economy is about two years from a downturn. Former Fed Chairman Ben Bernanke shared that view of a possible decline in 2020, when fiscal stimulus wanes like “Wile E. Coyote is going to go off the cliff.”

China and the United States earlier this week imposed less-harsh-than-expected tariffs on each other, helping lift sentiment on trade. In sharp contrast, U.S.-Canada talks were set to end the week with little sign of progress as a key White House official suggested the United States could move ahead with a revamp of the North American Free Trade Agreement (NAFTA) without Canada, ahead of the U.S.-imposed Oct. 1 deadline. “We’re still talking to Canada, and we’re getting very, very close to the deadline where we’re going to have to move ahead with Mexico all by themselves,” White House economic adviser Kevin Hassett said on Friday.

Pollsters are saying there is a 75% likelihood Democrats will take the House. That will cripple any chance of further US tax cuts but, more importantly, it will curb Trump’s ambitions on trade and leave the US deadlocked once again.

Energy, meanwhile, also racked up gains, supported the broader markets, as oil prices rebounded from lows, which followed a report suggesting major oil producers were set to discuss plans to boost output. On the New York Mercantile Exchange, crude futures for October delivery rose 40 cents to settle at $70.72 a barrel.

At the moment, the crypto-currency prices are near the lows, but unleashed by Trump trade war, sanctions, tightening of the monetary policy and uncertainty create a favourable environment for the long-term cryptocurrencies growth, especially in the emerging economies. Bitcoin rose 3.96% to 6,782. Bitcoin got support on approaching the “bottom” about $6,000. However, in the nearest future the benchmark cryptocurrency will have to face the test of the important resistance level. An important resistance level descended into the region of $7,000, in case of taking it, the cautious bulls should also await the confirmation with crossing the previous peaks at $7,500. Without taking these levels, it will be difficult to talk about a change in the trend.

The US dollar rose against its rivals on Friday, as investors reined in appetite for emerging-market currencies, while the pound racked up losses as the UK and EU reached an “impasse,” on a post-Brexit deal. The U.S. dollar index, which measures the greenback against a trade-weighted basket of six major currencies, rose by 0.40% to 93.84.

UK Prime Minister Theresa May criticized the EU for rejecting her post-Brexit plans, citing it “unacceptable,” particularly as the bloc failed to put forward alternative proposals. May further claimed that the UK and EU were at an “impasse,” denting optimism for a post-Brexit deal agreement following recent reports that the EU were set to adopt a warmer approach to Brexit talks.

GBP/USD fell 1.41% to $1.3075, eroding most of the week’s gain as the pair looks set to end the week roughly flat.

The dollar was also supported by profit-taking on emerging-market currencies like the South African rand and Turkish lira, both of which have enjoyed sharp gains on the back of improving sentiment in developing economies. Turkey unveiled a new economic program earlier this week to reduce its current account deficit, while South Africa’s central bank stood pat on interest rates Thursday.

Elsewhere, EUR/USD fell 0.29% to $1.1743 on weaker-than-expected eurozone manufacturing data. The single currency was set, however, to post a second-straight weekly gain ahead of an important week, as the Italian government is slated to release its budget on Thursday.

So in the short term the financial markets look confident, though below the surface there are shadows lurking, as higher FED rates put more pressure on corporate bonds.

Locally though, the next three months will be testing given the outfall from the Royal Commission, tighter credit and falling home prices. And to reinforce that, the RBA has confirmed what we all knew, namely than Banks do and can create money – deposits follow. See Our Post “How Banks Create Money” . This underscores the need to actively manage credit, rather than arguing as many do that because for every credit there is a debt, for every asset and liability, credit growth is unimportant – yes many still hold this view – when in fact it is availability of credit which drives home prices. And because credit is now much tighter, the downward forces mean home prices are set to continue to fall. And just as in a rising market high prices begets more loans, so less lending can only drive prices one way. Yes, we are indeed in for a fall, the question is how far and how fast? Time will tell.

And by the way, if you value the content we produce please do consider joining our Patreon programme, where you can support our ability to continue to make great content.

UBS Sounds IO Mortgage Alarms

According to UBS’ Australian Banking Sector Update on 19 September, which involved an anonymous survey of 1,008 consumers who took out a mortgage in the last 12 months, 18 per cent stated that they “don’t know” when their interest-only (IO) loan expires, while 8 per cent believed their IO term is 15 years, which doesn’t exist in the Australian market, via InvestorDaily.

The research found that less than half of respondents, or 48 per cent, believed their IO term expires within five years.

The investment bank said that it found this “concerning” and was worried about a lack of understanding regarding the increase in repayments when the IO period expires.

The Reserve Bank of Australia (RBA) earlier this year revealed that borrowers of IO home loans could be required to pay an extra 30 per cent to 40 per cent in annual mortgage repayments (or an additional “non-trivial” sum of $7,000 a year) upon contract expiry. The central bank noted that the increase would make up 7 per cent, or $120 billion, of the total housing credit outstanding.

According to the RBA, 2020 is the year that most of the 200,000 at-risk IO loans will reset.

UBS’ research, which was conducted between July and August this year, revealed that more than a third of respondents, or 34 per cent, “don’t know” how much their mortgage repayments will rise by when they switch to principal and interest (P&I) contracts.

More than half, or 53 per cent, estimated that their repayments will increase by 30 per cent once their IO term ends, while 13 per cent expected their repayments to rise by more than 30 per cent, which is the base case for most IO borrowers.

“This indicates that the majority of IO borrowers remain underprepared for the step-up in repayments they will face,” UBS stated in its banking sector update report.

Further, nearly one in five respondents to the UBS survey, or 18 per cent, said that they took out an IO loan because they can’t afford to pay P&I.

“With a lack of refinancing options available and the banks reluctant to roll interest-only loans, these mortgagors will have to significantly pull back on their spending, sell their property, or [they] could potentially end up falling into arrears,” the investment bank stated in its report.

UBS also found it concerning that 11 per cent of respondents said they expected house prices to rise and planned to sell the property before the IO period expires.

“This is a risky strategy given how much the Sydney and Melbourne property markets have risen, and have now begun to cool,” the investment bank said.

Overall, the top two motivations for taking out an IO loan, according to UBS survey participants, were “lower monthly repayments gives more flexibility on my finances” (44 per cent) and “to maximise negative gearing” (43 per cent).

The second motivation was selected by 32 per cent of owner-occupier borrowers who cannot benefit from negative gearing as the tax incentive applies to investors, 53 per cent of which cited this benefit.

Most banks yet to implement tighter expense checks

The investment bank reiterated in its banking sector update that it expects mortgage underwriting standards to tighten further in the next 12 months. It claimed that, contrary to comments by regulators that “heavy lifting on lending standards is largely done”, most banks are yet to fully verify a customer’s living expenses and a large number of customers are still not submitting payslips and tax returns.

“As a result, we believe there is likely to be much work required for the banks to comply with the royal commission’s likely more rigorous interpretation of responsible lending and improve mortgage underwriting standards. We expect this is likely to play out over the next 12 months,” UBS stated in its update report.

UBS went on to maintain its belief that Australia is at risk of experiencing a “credit crunch” in the next couple of years, but it is waiting on a number of “signposts” to make a more calculated judgement. These include the Hayne royal commission’s interim and final report, major bank policies around living expenses, details from the Australian Prudential Regulation Authority on debt-to-income caps, the federal election, changes in property prices, and sentiments from the RBA.

“We remain very cautious on the Australian banks,” the investment bank concluded in its update report.

“After a prolonged 26 years of economic growth, many excesses have developed in the Australian economy, in particular the Sydney and Melbourne housing market.

“We believe the royal commission creates an inflection point and credit conditions are tightening materially. Whether Australia can orchestrate an orderly housing slowdown remains to be seen, and we think the risks of a credit crunch are rising given the significant leverage in the Australian household sector.”

Front Book And Back Book Mortgage Pricing Plays

Today ING says it is increasing variable rates for investor mortgage customer by 15 basis points. The changes come into effect from Tuesday 25 September and  is for both new and existing investor loan customers.

This is the second rise in rates – ING had already increased its rates in June by 10 basis points for owner occupier loans.

This will put more pressure on the investor segment, already wilting under the strain.

Recently of course all the big banks but NAB repriced their entire book, attributing the rise to pressure from international funding. The rate hikes already signalled will now start to bite.

Actually the BBSW has come back somewhat, but remains elevated. This chart shows the divergence to the cash rate. The point is as the majors fund some of their book from short term sources the funding gap is real and sustained.

Westpac also put the cat among the pigeons by cutting mortgage rates by up to 110 basis points for new business, as they seek to dominate the meager pickings in the changed market. This is being funded by the back book repricing, so lower risk mortgage holders who shop around may be able to grab a low low rate, for now.

In a change from honeymoon offers, the banks new loan packages includes discounts of up to 80 basis points for the life of the loan.

Expect more specials from the other major players. This may also put more pressure on NAB, who held their rates last week.

The new Westpac Group rates will also apply for new lenders for Bank of Melbourne, BankSA and St George Bank.

The offer excludes owner occupied loans with interest only repayments or to switches within the Westpac Group.

There is also an offer to first time buyers, with an 85 basis point discount for 5 years and a lower discount beyond.

Westpac has tightened their lending policies again for existing borrowers with a focus on commitments such as Afterpay and leases.

Bottom line is there is merry dance of cross subsidization in play as existing borrowers are forced to pay more, (the back book) while certain classes of refinacing and first time buyers are being enticed.  However, bearing in mind that home prices are likely to fall further, buyers should beware.  Always read the small print!

We also wonder how sustainable these discounts are given current margin pressures. But I guess volume and margin are being traded off at least to an extent!


Overseas Migration Down by 9 Per Cent

The ABS data on migration shows a 9% fall since visa changes made in April 2017. No surprise then the HIA bemoans the fall, pointing to slowing demand for new property.

Of course this is another reason why home prices are likely to go lower.

ABS data released today shows that Australia’s annualised population growth rate slowed for the fourth consecutive quarter.

Over the year to March 2018, Victoria saw the strongest growth in population (+2.2 per cent), followed by the ACT (+2.1 per cent) and Queensland (+1.7 per cent). New South Wales was fourth fastest (+1.6 per cent) with Tasmania fifth (+1.0 per cent), Western Australia sixth (+0.8 per cent) and South Australia seventh (+0.7 per cent). The population of the Northern Territory has actually declined over the last two quarters and the annual rate of growth has slowed to 0.1 per cent.

“Australia’s overseas migration fell by 9 per cent since changes to visa requirements came into force in April 2017, slowing the population growth rate to 1.6 per cent,” Mr Murray added.

“In April 2017, Australia introduced a range of visa changes which have been successful in reducing the number of skilled migrants arriving in Australia.

“The current phase of Australia’s 28 years of continuous economic growth is built upon the arrival of skilled migrants. Skilled migration is necessary to offset the impact of our aging population.

“Looking domestically, states such as New South Wales and Victoria that have benefitted the most from overseas migration over recent years are now seeing population growth rates slowing.

“The slowing rate of population growth, while it remains high for a developed economy, will contribute to slower growth of household consumption.

“This means slower growth in sectors such as retail and residential building. Given that these two sectors are amongst the nation’s largest employers the risks presented a decline in population growth should not be underestimated,” concluded Mr Murray.

ASIC acts against misleading Initial Coin Offerings and crypto-asset funds targeted at retail investors

ASIC has taken action to stop several proposed initial coin offerings or token-generation events (together, ICOs), targeting retail investors.

As well, ASIC recently stopped the issue of a Product Disclosure Statement for a crypto-asset managed investment scheme.

Consistent problems identified by ASIC are:

  • the use of misleading or deceptive statements in sales and marketing materials;
  • operating an illegal unregistered managed investment scheme (MIS);
  • not holding an Australian financial services licence.

Such problematic offers involve significant risks for investors.

ASIC Commissioner John Price said, ‘If you raise money from the public, you have important legal obligations. It is the legal substance of your offer – not what it is called – that matters. You should not simply assume that using an ICO structure allows you to ignore key protections there for the investing public and you should always ensure disclosure about your offer is complete and accurate.’

Recent activity by ASIC 

In five other separate matters since April 2018, ASIC successfully acted to prevent ICOs raising capital without the appropriate investor protections. These ICOs have been put on hold and some will be restructured to comply with the applicable legal requirements.

ASIC is taking further action in respect of one completed ICO.

On 13 September 2018, ASIC issued a final stop order on a Product Disclosure Statement issued by Investors Exchange Limited (IEL) for units in the New Dawn Fund (Fund). The Fund was proposing to invest in a range of cryptocurrency assets. Following ASIC raising concerns about the PDS, IEL consented to a final stop order so that no units could be obtained under the PDS. ASIC acknowledges the co-operative approach taken by IEL in responding to ASIC’s concerns.

Investor warning

As outlined on MoneySmart, ICOs are highly speculative investments that are mostly unregulated, and while there are genuine businesses using this structure many have turned out to be scams. ASIC suggests that investors consult the information on Moneysmart before deciding to invest.

Fees for no service: how ASIC is trying to make corporate misconduct hurt

From The Conversation.

On September 6, 2018, the Australian Securities and Investments Commission launched proceedings against two arms of the National Australia Bank alleging a widespread and long standing practice of charging fees for no service.

An intriguing aspect of the action is that the claim acknowledges that the two firms have already agreed to pay back around A$87 million to the affected customers. So ASIC isn’t seeking compensation.

Instead, it wants declarations that the NAB subsidiaries breached the law and engaged in “misleading or deceptive” conduct under the ASIC Act and “false or misleading” conduct under the Corporations Act.

More than compensation

It is seeking penalties in respect of those breaches.

Declarations and penalties are important because they can inflict reputational damage.

This can send a powerful message to the rest of corporate Australia about the need to observe and respect the law, something that appears to have been missing in the financial sector to date.

Also, the greater the penalties imposed, the less financially attractive the behaviour becomes to other corporations, who, after all, are chiefly motivated by profit.

Penalties are typically low

However, to date it is arguable that the level of penalties sought by ASIC and imposed by the courts have been too low to act as an effective deterrent.

ASIC’s latest claim is a significant step forward.

It is seeking penalties that are likely to hurt, and as a result more likely to make a difference to corporate behaviour.

Its Concise Statement of Claim points to the purpose of its legislation which is to protect consumers and promote fair and efficient market economies.

In essence, it is asking the Federal Court to make orders directed at changing corporate practices that undermine that purpose.

Its challenge will be to persuade the court to take seriously the need for deterrence and for punitive penalties in addition to compensation.

Interestingly, it isn’t alleging that the NAB subsidiaries made misrepresentations dishonestly, knowingly or recklessly. Its focus is on “misleading” rather than “deceptive” conduct.

Dishonesty is hard to prove

This is likely to be because personal dishonesty is notoriously difficult to prove against corporations, whose human agents (employees, managers and the like) are often engaged in independent activities and are not be able to “connect the dots” about broader corporate dishonesty.

It might be time for the law to move away from questions of personal dishonesty and instead look at the objective nature of corporate behaviour. Longstanding practices and systems that are designed to and are inherently likely to mislead fall below the standards Australians expect, whether or not any of the individuals involved act dishonestly.

The case against the subsidiaries of NAB might provide the perfect opportunity for ASIC and the courts to take an important step in the right direction.

Author: Elise Bant Professor of Law, University of Melbourne

Fintech Spotlight – SocietyOne – P2P Lending Getting the Recipe Right

I caught up with Mark Jones, Chief Executive Officer of SocietyOne, Australia’s first and only marketplace lender to reach $500 million in loan originations across its personal loan, agri lending and marketplace business. And now its setting its sights on reaching $1 billion by the end of calendar year 2019.

I wanted to know how he had been able to grab the $500m of the $100 billion market, and specifically whether it was the appetite for P2P which was growing, or whether there were particular elements which had made the difference, given the 60 people working in the business, plus the external technology platform provider.

He argued that in the past 3-6 months SocietyOne had made a number of improvements to its business, and combined this had made a significant difference to their momentum. First, they have improved their algorithms around risk assessment and pricing. He explained that their underwriting algorithm had been tuned and improved, but that loans were still reviewed by a credit officer.  They are sending data to, and expect to benefit from the new comprehensive reporting regime which is coming in October.

Next they are clear on their target market, with a focus on good quality borrowers, often stable homeowners aged 35-50, with loan interest rate tailoring between 7.5% and 18% depending on individual risk profiles. The typical loan would be in the region of $22k, over 3 or 5 years, though they are able to offer facilities between $5k and $50k.  Average loan duration is around 4 years, and funds are offered on a principal and interest, straight line repayment basis.

Finally, they have invested in new technology, designed to offer customers a better online experience. They will shortly be launching a new application form, built from the ground up for mobile devices. Loans via these devices make up more than half of the loan applications now, and are growing quickly. This is a substantial change from the previous front end which was PC/Web based primarily. Mobile is the future.

They offer unsecured loans, and also credit to agribusiness sector – for example for the purchase of cattle and sheep. Momentum has accelerated thanks to the development of the broker channel, which they started in June 2018. They wrote $100k in June/July via this channel, $1.4m in August and are on track for $2m in September. This is proving to a significant venture. Most of this business related to unsecured personal credit, where around half of loans are refinancing of existing facilities, debt consolidation and credit cards. More than half of the loans are written below 13% interest rate, which is significantly lower than many credit cards. Brokers often advise their clients about managing their debt, Mark said. Other reasons to borrow include car loans and holidays.

Ahead they are considering offering secured loans including motor vehicle finance among others. They will continue their focus on the Australian market, which remains a significant opportunity.

Their portfolio is quite concentrated in the Sydney and Melbourne metropolitan areas, because they have been targeting their marketing and advertising there. That said it is a national business.  In terms of portfolio losses, Mark said he was satisfied with these, making the point that all applicants were effectively “new to bank” so there was no customer history. But on a like-for-like basis the loss ratios were quite similar if not better than what a typical bank might see.

Finally, I asked about the funding source for the business. Around a quarter comes from high-net worth “sophisticated” individual investors, with the remaining coming from a range of institutions, including mutual banks and institutional investors. These channels are growing more quickly, as shown by the relative fall in the proportion from high net worth sources, which was 30-35% a year ago.

The recipe of good risk profiling, target markets, and a focus on customer experience is clearly paying off, and the $1 billion target certainly looks achievable, ahead.

RBA Confirms Banks Create Money

There was an interesting speech from RBA Assistant Governor (Financial Markets) Christopher Kent entitled “Money – Born of Credit“.

The first fascinating point was his confirmation that loans create deposits (rather than deposits creating loans, which was the traditional view of how banks worked).  This is a critical pivot, because it means banks can create ever more loans, provided borrowers are prepared to borrow.  This is something I have discussed many times, and recently with Steve Keen on the DFA YouTube Channel. It has profound implications for monetary policy.

Control of credit in this model becomes critical.

The second is that he then tries to explain why inter bank lending rates remain elevated for Australian banks. I think he is less successful here, because the obvious missing link in the risk premium which is now in place (given the litany of issues raised by the Royal Commission, regulatory pressure, and potential class actions).

Our banks are having to pay more for their funding because of their recent track record, and this is not going to flip back anytime soon, in my view.

Here is the speech which is worth reading.


Most of us would put cold hard cash at the top of our list when we think of money. Others would include funds they have on deposit at a bank. Some might contemplate broader measures of their wealth. Historians would be tempted to tell us about the role of precious metals, coins, salt, shells and even rum when the topic of money is raised. When thinking about the role that money plays in an economy, economics teachers and academics might educate us about money multipliers, the velocity of money and money demand and supply functions. Keen students of episodes of high inflation would discuss Milton Friedman and the notion that inflation is ‘always and everywhere’ a monetary phenomenon. Given this, concerned citizens might be worried about what they see as the ability of private banks to create money via the extension of credit, seemingly at will.

While there are many interesting aspects of money, today I want to focus on the questions of how money is created and how money relates to lending or credit. Along the way, I’ll also review what’s been happening to both money and credit in Australia over recent decades. The process of money creation is often subject to a degree of confusion, in part because the explanation draws upon a combination of disciplines – accounting, banking and economics.

What Is Money?

It is relatively standard practice to define money according to its ability to do each of the following three things:

  • money can be used for transactions – it facilitates the exchange of goods, services or assets thereby avoiding the substantial costs associated with barter
  • money is a store of value – it’s worth does not fluctuate wildly, nor does it degrade rapidly over time, and
  • money acts as a commonly accepted unit of account – it provides a convenient means of comparing the value of a range of different goods, services or assets.

Banknotes and coins – otherwise known as currency – satisfy each of these functions. Currency long ago pushed aside other physical forms of money.

Currently, there is around $75 billion of currency in circulation in Australia (outside of the banking system). However, despite its usefulness, currency represents only a small share of money in modern economies.

Most money consists of deposits in banks, building societies and credit unions (simply referred to here as banks). Just as I can pay for my morning coffee using currency, I can also transfer funds in my bank deposit to the café’s account. In either case, the café owner receives a liquid store of value which they are confident will be accepted by others.

Not all bank deposits are equally liquid – for instance, it can take some time to gain access to funds in a term deposit. For this reason, it is common to construct a range of different ‘monetary aggregates’, from the more liquid narrower forms money – such as M1, which includes currency and current deposits at banks – to ‘broad money’, which also captures less liquid deposits and other financial products that share the characteristics of money discussed earlier (Table 1; Graph 1); for example, broad money includes certificates of deposit or short-term debt securities. For convenience, in what follows I’m going to focus on broad money.

Table 1: Monetary Aggregates
Measure Description(a)
Currency Notes and coins held by the private non-bank sector
Money base Currency + banks’ holdings of notes and coins + deposits of banks with the Reserve Bank + other Reserve Bank liabilities to the private non-bank sector
M1 Currency + current (cheque) deposits of the private non-bank sector at banks
M3 M1 + all other deposits of the private sector at banks (including certificates of deposit) except deposits of authorised deposit-taking institutions (ADIs) + all deposits of the private non-ADI sector at credit unions and building societies (CUBS)
Broad money M3 + other deposit-like borrowings of all financial intermediaries (AFIs) from the non-AFI private sector (such as short-term debt securities)
(a) These descriptions abstract from some detail. See the Financial Aggregates release for more information.
Graph 1
Graph 1: Composition of Broad Money in Australia


Broad money represents a relatively liquid form of wealth held by Australian households and businesses. It includes currency, deposits and deposit-like products.[1] Unlike ancient forms of physical money – think shells or gold found in the natural environment – these are liabilities issued by authorised deposit-taking institutions (ADIs) and other financial intermediaries.[2] Broad money in Australia is currently around $2 trillion or 115 per cent of the value of annual economic output as measured by nominal GDP; most of that is in the form of banking deposits. Over the past decade, the share of broad money represented by term and other bank deposits has increased in importance at the expense of holdings of current deposits and other borrowings from the private sector.

How Is Money ‘Created’?

Australia’s banknotes are produced by the Reserve Bank of Australia and account for most (about 95 per cent) of the value of Australian currency. The rest is accounted for by coins produced by the Royal Australian Mint.

Banks purchase banknotes from the Reserve Bank as required to meet demand from their customers and, in turn, the Reserve Bank ensures that it has sufficient banknotes on hand to meet that demand. Previous research by the Reserve Bank points to a number of drivers of demand for banknotes. The most important is the size of the economy.[3] This is consistent with people holding some fraction of their income in this most liquid form of money in order to undertake transactions.[4] Some share of demand is also accounted for by the desire for a liquid store of wealth. The value of banknotes in circulation as a share of nominal GDP has actually increased over recent years (to around 4 per cent), which suggests that this source of demand has grown strongly. This increase has been observed in a range of countries and is consistent with the low level of interest rates, which has reduced the opportunity cost of holding money (compared with holding interest-bearing deposits).

When customers withdraw currency from an ATM or a bank branch, the value of their deposit holdings declines and the value of their currency holdings increases. The stock of broad money, however, is unchanged.

As I mentioned earlier, the vast bulk of broad money consists of bank deposits. These banking liabilities are created when an Australian household or business has funds credited to their deposit account at an Australian bank. One way this can occur, for example, is when a business deposits currency it has earned with its bank. Again, such transactions add to deposits but do not create money because the bank customer is simply exchanging one type of money (currency) for another (a deposit).

Money can be created, however, when financial intermediaries make loans. Accordingly, the concepts of money and credit are closely linked in a modern economy, albeit not one for one. When a bank extends a loan, it makes money available to the borrower, for example, to buy a car, a house or equipment for a business. The bank may credit the deposit account of the borrower, who withdraws the funds to make their purchase. Alternatively, the bank may directly credit the deposit account of the seller on behalf of the borrower. In either case, the loaned funds will tend to find their way into a deposit somewhere in the banking system. This process adds to the supply of money.

If I stopped here, you might be left with the impression that the process of lending allows the banking system to create endless quantities of money at no cost. However, the process of money creation is constrained in numerous ways and depends on the behaviour of borrowers, banks and regulators, as well as the stance of monetary policy.

In the first instance, the process of money creation requires a willing borrower. That demand will depend, among other things, on prevailing interest rates as well as broader economic conditions. Other things equal, lower interest rates or stronger overall economic conditions will tend to support the demand for credit, and vice versa.

The bank then has to be willing and able to issue the loan:

  • It has to satisfy itself that the borrower can service the loan.
  • The bank must maintain a sufficient share of its assets in liquid form to meet any drawdowns relating to the new loan, as well as meeting any withdrawals from existing depositors.[5] Otherwise, the bank runs the risk of failing to meet its obligations when they fall due.
  • The bank’s loans and other assets need to be backed by adequate capital. Capital is needed to absorb unexpected losses arising from defaults or other sources of variation in the value of assets.
  • The interest rates charged on loans must cover expected losses on the loan portfolio, as well as the costs of deposits and other sources of funding. Revenues from loans and other assets will also have to cover the operating costs of the bank, while allowing it to earn a profit so that shareholders can earn a reasonable return on the bank’s capital.

All of these considerations imply that money creation occurs at some cost, which serves to constrain the extent of lending. These constraints are reinforced by regulatory requirements for liquidity, capital adequacy and lending standards set by the Australian Prudential Regulation Authority. Other things equal, anything that reduces the willingness or ability of banks to make loans can be expected to result in lower growth of (system-wide) money.

It’s also worth emphasising that the process of money creation is not the result of the actions of any single bank – rather, the banking system as a whole acts to create money. A single bank may make loans by drawing on its liquid assets, yet not receive the corresponding deposits created in return. Before extending further loans, that bank would need to raise funds in other ways – for example, by issuing debt or equity securities or by waiting for its deposits and liquid assets to rise via other means.[6]

Graph 2 illustrates how the process of money creation can work. It shows an example of an increase in loans of $100 billion. However, the increase in loans in this case leads to an increase in deposits of $60 billion; in other words, the changes are not one for one. This is because there are other sources of funding besides deposits – and indeed, loans are not the only assets held by banks. In the example shown, other funding comes from issuance of debt and equity. The shares from different sources are in line with the actual funding behaviour of the banking system over recent years (Graph 3).

Graph 2
Graph 2: Stylised Banking Sector Deposit Growth
Graph 3
Graph 3: Funding Composition of Banks in Australia


In summary, changes in the stock of broad money are the result of a myriad of decisions, including those of banks, their borrowers, creditors and shareholders. And these decisions take place within the framework of a range of regulatory and institutional arrangements. It is worth noting that the Reserve Bank does not target a particular level or growth rate of money (although it has done so under a previous monetary policy regime).[7] Instead, the Reserve Bank has some influence on the money stock via the effect of its interest rate target for the overnight cash rate on other interest rates in the economy. These in turn affect the cost of borrowing and economic conditions more generally. Ultimately, borrowing and lending decisions – and thus the creation of money – are constrained by the need for prudent banking behaviour, the budget constraints of borrowers and the profitability of lenders.

One final word on the creation of money is that as fun as it is to teach students about traditional money multipliers, I don’t find them to be a very helpful way of thinking about the process. In Australia, simple regulatory regimes – which had earlier required banks to hold a minimum share of their deposits as reserves with the Reserve Bank – have been replaced with modern prudential regulation and market discipline. Again, the demand for and supply of credit is the real driver of money. That point can be reinforced by examining the behaviour of credit and money over time.

What Has Money Been Doing and Why?

Given that money is used for transactional purposes and as a store of value, it makes sense that most of the time it would at least keep pace with growth in the value of nominal spending. Indeed, in Australia it has grown faster than that over the past 40 years, roughly doubling as a share of nominal GDP (Graph 4).

Growth of credit has been stronger still, roughly tripling as a share of nominal GDP, from under 50 per cent in the early 1980s to over 150 per cent currently. A closer look at the banks’ balance sheets shows how these changes have occurred.

Graph 4
Graph 4: Credit and Broad Money – Share of Nominal GDP


In 1980, Australian banks held more than 80 per cent of their liabilities as deposits (worth around $47 billion at the time) (Graph 5). This deposit base was more than sufficient to fund loans of about 60 per cent of assets (worth $34 billion). The majority of the remaining assets were held in the form of securities (mostly government bonds).[8]

Graph 5
Graph 5: Banks’ Assets and Liabilities – 1980


As banks grew through the next four decades or so, there was a marked change in the composition of their balance sheets. These changes reflected choices by both banks and the private sector and were strongly influenced by the deregulation of the financial system. In particular, constraints on banks’ business activities were progressively removed in the 1970s and early 1980s (for example, the interest rates they could charge and pay, their product offerings, lending volumes and their asset holdings). This was associated with significant changes in banks’ abilities to attract and use different funding sources to support balance sheet growth.[9] By the early 1990s, Australians’ demand for credit from banks became larger than the sum of all of their deposits.

Following a period of slower growth around the early 1990s recession, credit growth picked up again and continued to grow much more quickly than money. To enable this, a greater proportion of bank funding during this period was drawn from sources other than deposits. Much of it owed to an increase in the issuance of debt securities, which was supported, in part, by a strong appetite from non-residents for Australian bank debt.

These trends continued until the global financial crisis. Following the crisis, credit growth fell for a while (reflecting a decline in both the supply of and demand for credit). At the same time, the stock of (broad) money increased noticeably, rising by around $1.1 trillion dollars, from around 80 per cent of GDP in 2007 to around 115 per cent in 2018. This strong growth reflected a sharp increase in the share of funding sourced from deposits at the expense of short-term debt securities, consistent with banks seeking more stable funding. Meanwhile, households and businesses increased the share of their assets held in the form of deposits.

While loans have grown dramatically in nominal terms, to around $2.6 trillion today, the share of loans on banks’ balance sheets is the same as it was in 1980 (Graph 6).[10] In contrast, and notwithstanding the increase in deposits since the global financial crisis, the share of deposits has declined over the past 40 years from above 80 per cent to around 50 per cent of banks’ balance sheets.[11] Currently, a sizeable share of banks’ liabilities is in the form of bonds on issue – a source of funding that was less important in 1980.[12] Banks also have a much larger share of ‘other liabilities’ (such as those to non-residents and related parties, which are not included in domestic monetary aggregates).

Graph 6
Graph 6: Banks’ Assets and Liabilities – 2018


Looking back, it is clear that there have been many instances of sustained gaps between the growth of deposits – and broad money more generally – and the growth of credit (Graph 7). While broad money growth outpaced credit growth for most of the period since the financial crisis, this was not the experience of the two decades or more prior to the crisis, when credit typically outpaced broad money.

Graph 7
Graph 7: Credit and Broad Money Growth


This long history suggests that we should not be concerned about a so called deposit ‘funding gap’. Some commentators have suggested that the recent decline in the growth rate of money has left banks with insufficient deposit funding to support credit growth. According to this hypothesis, banks have been forced to seek other forms of funding, including from short-term money markets, which, so the argument goes, can help to explain the notable rise in rates in those markets in recent months.[13]

What are we to make of this hypothesis? First, such a gap between the growth of deposits and credit has been commonplace over recent decades – and conditions in short-term money markets were benign through much of those earlier episodes. Second, loans are not the only assets on banks’ balance sheets; indeed, in recent quarters, growth in these other assets has been particularly slow – slower than both credit and deposits (Graph 8). So deposit growth has more than matched the growth in total assets.

Graph 8
Graph 8: Loan, Deposit and Balance Sheet Growth


Third, if some banks really did have insufficient deposit funding, we would expect to see them competing more vigorously for deposits by raising interest rates on those products. But retail deposit rates have been flat to down over the past year (Graph 9).

Graph 9
Graph 9: Major Banks’ Retail Deposit Rates


In short, there is little evidence that there is any relationship between the slowing of deposit growth and recent funding pressures in short-term money markets. More generally, given my earlier discussion about the extension of credit leading to the creation of banking system deposits, worrying about slower deposit growth impinging on the banking system’s ability to generate credit is putting the cart before the horse.

What Can Money or Credit Tell Us about Broader Economic Developments?

Given this discussion, it is worth asking whether the behaviour of money can tell us anything useful about broader economic developments and, if so, is it more or less useful than the behaviour of credit?

I’m going to address these questions in a very narrow way by examining whether the growth of broad money or credit provides any useful statistical information about the growth of nominal GDP. Because data for money and credit are available about five weeks ahead of the quarterly GDP release, we can examine whether growth in the current quarter of these series provides any additional information about the likely outcome for nominal GDP this quarter. This exercise is intended to merely determine whether money or credit are useful indicators of GDP. It is not intended to demonstrate whether a causal link exists between money or credit and GDP. (Indeed it is possible that the direction of causation runs in either or both, directions.)

I start with a simple model of quarterly nominal GDP growth as a function of recent lags of nominal GDP growth (Model 1 in Table 2). The model is estimated over the inflation-targeting period. This simple model is not particularly useful; lags of nominal GDP growth explain only about 8 per cent of the variation in the current growth of nominal GDP. But it gives us a useful baseline for comparison.

Table 2: Simple Models of Nominal GDP Growth(a) March quarter 1993 – June quarter 2018
Model 1 Model 2 Model 3 Model 4
Constant 1.14** 0.85** 0.88** 0.70**
GDP growth(b) 0.21 0.04 −0.06 −0.08
Broad money growth(c) 0.26* 0.16
Credit growth(c) 0.31** 0.25**
R-squared 0.08 0.15 0.17 0.22
Adjusted R-squared 0.04 0.07 0.09 0.10
(a) Quarterly data; ** indicates statistical significance at the 5 per cent level; * indicates statistical significance at the 10 per cent level
(b) Coefficient presented is the sum of the coefficients on the past four lags of quarterly nominal GDP growth; statistical significance is based on a joint significance test for these coefficients
(c) Coefficients presented are the sum of the coefficients on the current and past four lags of quarterly broad money or credit growth; statistical significance is based on joint significance tests for these coefficients
Sources: ABS, RBA

Adding current and past lags of money growth to the baseline model doesn’t improve its performance much; the sum of the coefficients on the money terms are statistically significant, but only at a 10 per cent level (Model 2). Similarly, adding current and past lags of credit growth improves the model’s explanatory power only slightly; however, the sum of coefficients on the credit terms are statistically significant at the 5 per cent level (Model 3). Interestingly, if both money and credit terms are included at the same time, only credit growth is statistically significant (Model 4). This suggests that credit growth is a marginally more useful statistical indicator of the growth of economic activity than money growth; again, I should stress that the contribution of the credit variable to the model in terms of its additional explanatory power is very modest.[14]

Conclusion

Currency in circulation has increased as a share of nominal GDP – indeed it’s as high as it’s been in many decades. But the increase in money, which includes bank deposits, has been even greater over the same period. That increase has been driven by the extension of credit, which depends on the decisions of borrowers and lenders. Banks have been able to fund that additional credit via growth in other sources of funding, including debt securities and equity. The recognition that deposits are created by the banking system via the extension of credit suggests that we should not be concerned about the banking system facing a deposit funding gap. Moreover, it is consistent with simple empirical analysis that suggests that credit is a marginally more useful indicator of the near-term growth in the value of economic activity than money.

SocietyOne becomes first Aussie P2P to hit $500M in lending

SocietyOne says it has today become Australia’s first and only marketplace lender to reach $500 million in loan originations across its personal loan, agri lending and marketplace business, and is now setting its sights on reaching $1 billion by the end of calendar year 2019.

The milestone follows a record August and the recent appointment of ex-Westpac and Citibank exec, Mark Jones, to the top job of CEO.

“We’re delighted to have reached this significant milestone as we deliver an even better deal for our borrowers and investor funders,” said Mr. Jones.

“We’ve been growing steadily over the past 12 months while we continued to transform our business and build new capabilities for our customers. As a result, we’re now seeing real momentum in the business that we expect to continue, and which should see us achieve breakeven by the end of March 2019 and reach $1 billion in loan originations by the end of 2019.”

We had a record August month for personal lending with $14 million in originations, up 46% on August 2017, and well above the monthly average for the past 12 months. September is now also shaping up to be another record month, with volumes expected to further increase into the fourth quarter of the calendar year.

“The seasonal increase in consumer credit heading into the festive season will combine with the rollout and expansion of a number of new initiatives, including continued expansion of our broker distribution offering, the launch of our new brand campaign, and the release of the first phase of our new technology platform,” continued Mr. Jones.

“We’ve also launched our new “When it happens” brand campaign this past weekend, bolstered by support from our shareholders. The campaign is an honest reflection of the way that even joyful moments can sometimes present financial stress to otherwise financially-fit people, as a result of unexpected costs.

“‘It’ can happen to any of us, but there’s no need to add extra stress by racking up high-interest credit card debt when a low rate personal loan from SocietyOne is often a far better solution.

“Looking ahead, the impending introduction of comprehensive credit reporting and open banking, ASIC’s proposed regulatory changes to credit cards, a robust economic backdrop, and a push for a better deal following the royal commission into banking all bode well for a highly prosperous 2019,” concluded Mr. Jones.