The RBA minutes for February 2018 were out today. They highlighted continued momentum in the global economy, with growth up in Australia’s major trading partners. This may put pressure on inflation here. Stronger growth in the world economy had contributed to higher commodity prices over 2017.
Locally, business conditions in the September quarter had been stronger than expected, while conditions in the household sector had been a little weaker. GDP growth was expected to be a little above 3 per cent over both 2018 and 2019.
Growth in consumption had been steady at a modest pace despite relatively weak growth in household disposable income. There was still a risk that growth in consumption might turn out to be weaker than forecast if household income growth were to increase by less than expected. In an environment of high household indebtedness, consumption might be particularly sensitive to adverse developments in household income or wealth.
Conditions in established housing markets had generally eased. Prices for detached houses had fallen in Sydney, especially for more expensive properties, and growth in housing prices had slowed considerably in Melbourne. In Perth and Brisbane, housing price growth had been little changed over prior months. In the eastern capital cities, a considerable additional supply of apartments was scheduled to come on stream over the next couple of years. Members noted that nationwide measures of growth in advertised rents had risen, with rents no longer falling as quickly in Perth. This suggested that rent inflation in the CPI could also be expected to rise gradually over the forecast period.
The unemployment rate was expected to decline a little further over this period to 5¼ per cent, consistent with GDP growth rising to be above potential. This implied that some spare capacity in the labour market would remain over the forecast period. Even though labour market conditions had improved noticeably over 2017, wage growth had remained subdued.
The implied spread between the average outstanding lending and funding rates for Australian banks was estimated to have been stable since mid 2017. Deposit rates had declined somewhat over the course of 2017, as banks’ demand for deposit funding had eased once they had adjusted their balance sheets to comply with the net stable funding ratio (NSFR), which had come into effect at the start of 2018. Banks had also previously increased their long-term debt funding in readiness for the introduction of the NSFR. Bond issuance by Australian banks had remained strong in 2017, with bond tenors increasing further and spreads having continued to decline to the lowest level in 10 years. Issuance of residential mortgage-backed securities had also been strong in 2017 and pricing of these securities had become more favourable to issuers, although the spreads relative to benchmark yields were still above levels seen a few years earlier.
Members observed that, while standard variable interest rates for housing loans had been little changed since mid 2017, the average outstanding variable rate had declined slightly as new and refinanced loans were typically being offered at lower rates. The decline in average outstanding rates had been slightly larger for lenders other than authorised deposit-taking institutions (ADIs), although these rates were still higher on average than those offered by ADIs.
Growth in housing credit had eased over the second half of 2017, driven largely by a slowing in lending to investors. Most of the slowing in housing credit growth had been accounted for by the major banks. Members noted that housing lending by non-ADIs had continued to grow strongly, although these lenders’ share of housing lending remained small.
Financial market pricing suggested that market participants expected the cash rate to remain unchanged during 2018, but had priced in a 25 basis point increase by early 2019.
Over 2017, progress had been made in reducing the unemployment rate and bringing inflation closer to target. The low level of interest rates was continuing to play a role in achieving this outcome. Further progress on these goals was expected over the period ahead but the increase in inflation was likely to occur only gradually as the economy strengthened; the Bank’s central forecast for the Australian economy was for GDP growth to pick up to average a little above 3 per cent over the next two years and for CPI inflation to be a little above 2 per cent in 2018. Members observed that an appreciating exchange rate would be expected to result in a slower pick-up in economic activity and inflation than forecast.
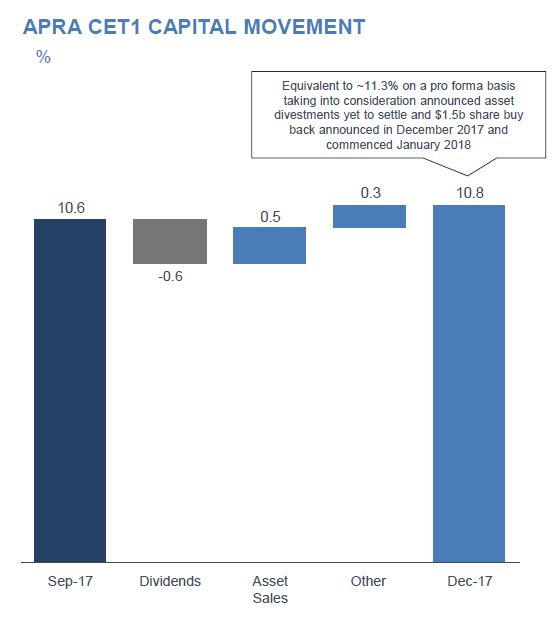
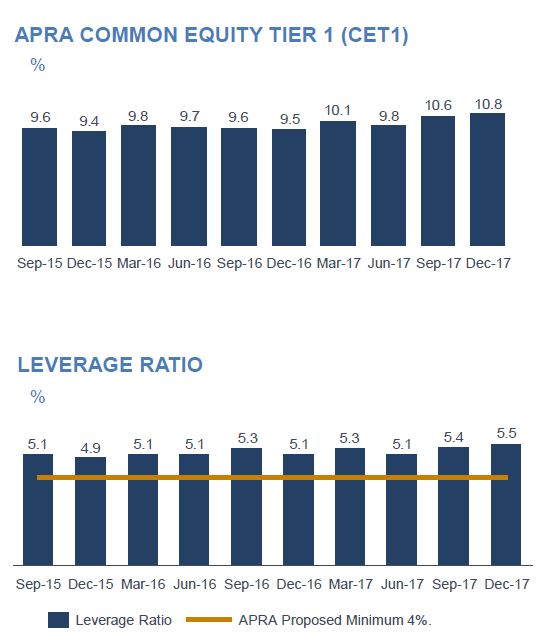
ANZ Banking Group released their 1Q update today. Overall capital ratios are up, with their Common Equity Tier 1 (CET1) ratio at 10.82% at Dec-17, 25bp increase from Sep-17. Dec-17. CET1 ratio includes the proceeds of the sale of Shanghai Rural Commercial Bank stake and a small benefit from the sale of the Asian retail and wealth businesses (Taiwan & Vietnam settlements in the December quarter).
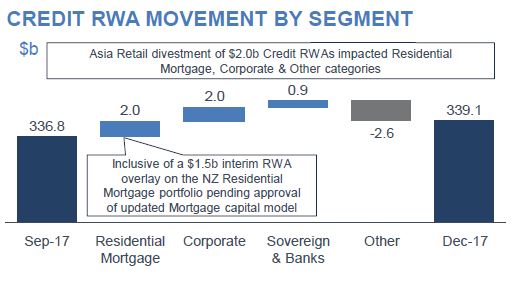
Funding and liquidity position remains strong with LCR 131% (Dec-17
quarter avg) and NSFR 114% (as at 31-Dec-17). Total Risk Weighted Assets (RWA) increased $2.4b, including a $2.3b increase in Credit RWA, with growth in Residential Mortgages, Corporate and Bank Pillar 3 categories.
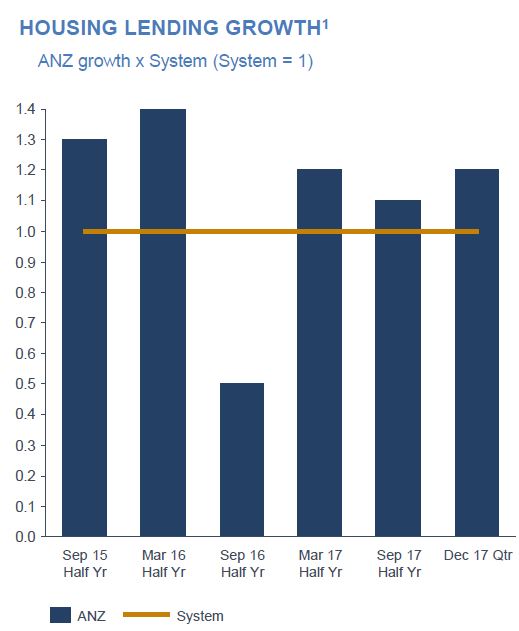
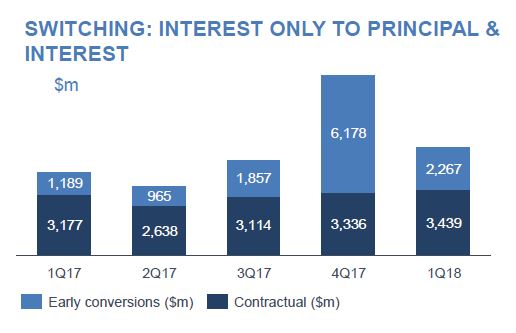
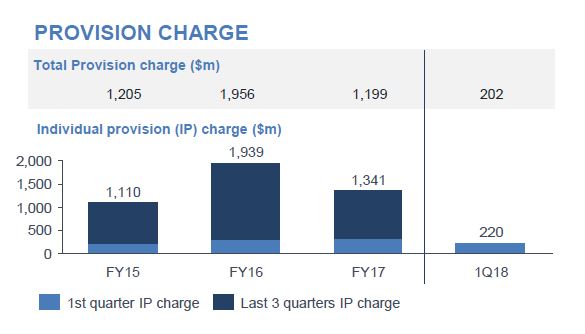
Home lending portfolio grew at 1.2 times system in the December quarter, with Owner Occupied growth of 10% annualised (1.4 times system), Investor growth of 2% annualised.Interest only new business in the December quarter (1Q18) represented 14.3% of total new business flows. $5.7b of interest only loans switched to principal and interest in 1Q18, compared with $9.5b in 4Q17 and $4.3b per quarter on average across 1Q17 to 3Q17.Total provision charge of $202m in 1Q18 with individual provision charge of $220m.
Residential Mortgage 90+ day past due loans (as a % of Residential Mortgage EAD) increased by 1bp.
Michele Bullock, Assistant Governor (Financial System), spoke at the Responsible Lending and Borrowing Summit. She downplayed the financial stress in the system and concluded “while there are some pockets of financial stress, the overall level of stress among mortgaged households remains relatively low”. Of course, our own mortgage stress surveys tells a different story, but it does depend on definitions.
Four quick points to note. First, the RBA continues to rely on HILDA data from 2016, despite the changes in living costs, mortgage rates and flat incomes since then. They refer to more timely private datasets, but do not use them, because of “different methodologies.”
Next, she acknowledge that high household debt will be a consideration in terms of interest rate policy, as highly in debt households will be an economic drag on consumption. If debt is considered low, this leaves the door open to rate rises, sooner rather than later.
Third, she perpetuates the view that financial stress is highest among lower income households, but sees little evidence of difficulty among more affluent groups, and argues that many are well ahead with their mortgage repayments. We agree some are, but many more affluent households are also feeling the pinch!
Finally, she is of the view that of households with interest only loans coming up for review, those at risk of not being able to afford a P&I reset, and fall outside current lending standards is quite small (though need watching). That said she highlights risks in the investor portfolios. ” Indeed, the macro-financial risks are potentially heightened with investor lending”. We agree, this is 36% of the portfolio!
So, her conclusion is, move along, nothing to see here! We think the financial stress story is more significant, but there is no authoritative official data covering this topic. Surely a gap the RBA needs to close! Especially if home prices momentum continues to sag.
Thank you for the opportunity to be here today. The title of the summit, ‘Responsible Lending and Borrowing – Risk, Responsibility and Reputation’, really struck a chord with me because there has been much discussion over the past few years about housing prices and the increasing debt being taken on by the household sector.
The Reserve Bank’s interest in this area springs from both its responsibility for monetary policy and its mandate for financial stability. From the perspective of monetary policy, high debt levels will influence the calibration of interest rate changes. The more debt households have, the more sensitive their cash flow, and hence consumption, is likely to be to a rise in interest rates. Households with higher debt levels may also sharply curtail their consumption in response to an adverse shock such as rising unemployment or large falls in house prices, amplifying any economic downturn. My focus today, however, is on the potential risks to financial stability from this build up in debt. One of the key issues we have been focusing on is the extent to which rising household debt might presage stress in household budgets, with flow on effects to financial stability and ultimately to the economy. There has been a lot said and written about this issue in recent times, using a multitude of data sources and anecdotes. What I hope to do today is to put this information into some context to provide a balanced view on the current and prospective levels of household financial stress, and hence the implications for financial stability.
I want to make a couple of points at the outset. The first is that there are clearly households in Australia at the moment that are experiencing financial stress. By focusing on whether financial stress has implications for financial stability, I am not in any way playing down the difficulties some households are experiencing. There is a very real human cost of financial stress.
Second, some of the most financially stressed households are those with lower incomes which typically rent rather than borrow to buy a home. Access to suitable affordable housing for this group is clearly an important social issue. But given the topic of this summit and the potential link to financial stability, I am going to focus in this talk on household mortgage debt and the potential for financial stress resulting from this.
What is Financial Stress?
Definitions of financial stress are many and varied. One definition could be where a household fails to pay its bills or scheduled debt repayments on time because of a shortage of money. This is quite narrow – it captures only those households for which stress has already manifested in missed payments. A much broader definition of financial stress might be a situation where financial pressures are causing an individual to worry about their finances, or where an individual cannot afford ‘necessities’. These definitions might be good leading indicators of failures to meet debt repayments or defaults. So there is a role for a variety of indicators of stress.
One way of thinking about financial stress is in terms of a spectrum or a pyramid, running from mild stress to severe stress (Graph 1). At the mild end, the base of the pyramid, people may perceive that they are financially stressed when they have to cut back on some discretionary expenditure, such as a holiday or a regular meal out. Slightly further up the pyramid, they may not be able to pay bills on time, or might have to seek emergency funding from family. At the top of the pyramid – severe financial stress – a household might be unable to meet mortgage repayments or ultimately be facing foreclosure or bankruptcy.
Graph 1
The pyramid is wider at the bottom than the top reflecting the fact that there will always be more households in milder stress than in severe stress. For some households experiencing milder stress their circumstances might deteriorate and they will move to a more severe form of financial stress. But some others might continue to restrain spending on discretionary items so as to meet essential payments. Others might experience a change in circumstances that improves their financial position.
Triggers and Protections from Financial Stress
Most people don’t consciously set out to put themselves in a position of financial stress. Sometimes people might choose to stretch themselves initially in taking out a loan, perhaps even putting themselves into mild, temporary financial stress. But they would typically be doing so on the expectation that it will become more manageable over time as their income rises. More serious financial stress often only comes about by a combination of what turns out to be excessive debt and changed circumstances. A level of mortgage debt that looked manageable when it was taken out might become unmanageable if, for example, the primary income earner of a household becomes unemployed. Or if life circumstances change, such as through ill health, the birth of a child or breakdown of a relationship.
So what do conditions in the housing sector over the past few years suggest about the potential for financial stress? You are all familiar with the broad story. House prices have been rising rapidly, particularly in Sydney and Melbourne. At the same time, household mortgage debt has been rising while incomes have been growing relatively slowly. As a result, the average household mortgage debt-to-income ratio has risen from around 120 per cent in 2012 to around 140 per cent at the end of 2017 (Graph 2, left panel). Furthermore, the increasing popularity of interest-only loans over recent years meant that by early 2017, 40 per cent of the debt did not require principal repayments (Graph 3). A particularly large share of property investors has chosen interest-only loans because of the tax incentives, although some owner-occupiers have also not been paying down principal. This presents a potential source of financial stress if a household’s circumstances were to take a negative turn.
Graph 2
Graph 3
This is where lending standards come in. There is always a balance to be struck with lending standards. If they are too tight, access to credit will be unreasonably constrained, potentially impacting economic activity and restricting some households from making large purchases that they can afford. If they are too loose, however, borrowers and lenders could find risks building on their balance sheets which, if large enough, might have implications for financial stability. Over the past few years in Australia, regulators have been concerned that lending standards have erred on the more relaxed side. An exuberant housing market in some parts of the country and strong competition among lenders raised the question of whether financial institutions had been appropriately prudent in assessing a household’s ability to meet repayments.
In response, a number of measures were implemented by APRA and ASIC to strengthen mortgage lending standards. These measures have helped improve the quality of lending over the past couple of years. But there is still a large stock of housing debt out there, some of which probably would not meet the more conservative lending standards currently being imposed. How large a risk does this pose to financial stability? It depends on a number of things, including how lax the previous lending standards were, how much of the stock was lent under less prudent standards and the repayment patterns of borrowers. One way of assessing the risk though is to look at the level and trajectory of mortgage stress.
Measures of Financial Stress
There is no single measure that captures the level of financial stress. There are comprehensive surveys, such as the survey of Household, Income and Labour Dynamics in Australia (HILDA) and the Survey of Income and Housing (SIH), that are methodologically robust, but are only available with a lag. A number of private sector surveys are more timely but it can be harder to assess whether their methodologies are well focused on financial stress. There is also information on non-performing loans, insolvencies and property repossessions that is fairly timely and reliable, but is only an indicator of pretty severe stress. I am going to talk through a few measures and see what they imply about the current level of mortgage stress among Australian households.
Let’s start with some high-level data on debt and debt servicing. As I noted above, the average household mortgage debt-to-income ratio has been rising over recent years. In a sense, this is not really surprising. With historically low interest rates, households have been able to service higher levels of debt. Indeed, the debt-servicing ratio (defined as the scheduled principal and interest mortgage repayments to income ratio) has remained fairly steady at around 10 per cent despite the rise in debt (Graph 2, right panel). But these are averages. It is important to look at the distribution of this debt – are the people holding it likely to be able to service it?
Graph 4
The HILDA survey provides information on the distribution of household indebtedness and debt servicing as a share of disposable income. Looking only at owner-occupier households that have mortgage debt, the survey suggests that the median housing debt-to-income ratio has risen steadily over the past decade to around 250 per cent in 2016 (Graph 4, left panel).[1] However, the median ratio of mortgage servicing payments to income has been fairly stable through time, remaining around 20 per cent in 2016 (Graph 4, right panel). In fact 75 per cent of households with owner-occupier debt had mortgage payments of 30 per cent or less of income, which is often used as a rough indicator of the limit for a sustainable level of mortgage repayments.[2] This suggests that, as recently as 2016, mortgage repayments were not at levels that would indicate an unusual or high level of financial stress for most owner-occupiers. But there is a significant minority for whom mortgage stress might be an issue.
Other data sources suggest that the number of households experiencing mortgage stress has fallen over the past decade. The Census data show that the share of indebted owner-occupier households for which actual mortgage payments (that is, required and voluntary payments) were at or above 30 per cent of their gross income declined from 28 per cent in 2011 to around 20 per cent in 2016. And the 2015/16 Household Expenditure Survey indicates that the number of households experiencing financial stress has steadily fallen since the mid 2000s.
Furthermore, a large proportion of indebted owner-occupier households are ahead on their mortgage repayments. We have highlighted this point in recent Financial Stability Reviews. Total household mortgage buffers – including balances in offset accounts and redraw facilities – have been rising over the past few years as households have taken advantage of falling interest rates to pay down debt faster than required. In 2017, total owner-occupier buffers were around 19 per cent of outstanding loan balances or around 2 ½ years of scheduled repayments at current interest rates (Graph 5, left panel)). There is some variation in buffers. While one-third of outstanding owner-occupier mortgages had at least two years’ buffer, around one-quarter had less than one month (Graph 5, right panel). Not all of these loans, however, are necessarily vulnerable to financial stress. If households are building up other assets instead of building up mortgage buffers, they may still be well positioned to weather any change in circumstances.
Graph 5
All of this suggests that a large proportion of households have some protection against financial stress. There are, however, some households that are more vulnerable, probably those with lower income who cannot afford prepayments or those with relatively new mortgages who have yet to make many inroads.
Another way of measuring financial stress is by asking survey respondents to self-assess. For example, a survey might ask about the respondent’s ability to meet payments, the type of financial stress they have experienced, or whether they have had difficulty raising money in an emergency.
The HILDA survey also provides some information on this. In general, measures such as these indicate that financial stress for owner-occupiers with mortgage debt has not changed much over the past decade, and is actually lower than in the early 2000s. Around 12 per cent of such households indicated that they would expect difficulty raising funds in an emergency in 2016 (Graph 6). The survey also asks people what sort of financial difficulties they had experienced over the past twelve months. For example, did they have difficulty paying a mortgage or bills on time? Were they unable to heat their home or did they have to go without meals? Did they have to ask for financial assistance from family or a welfare agency? A bit less than 20 percent of owner-occupier households said they had experienced at least one difficulty in the past 12 months, but only 5 per cent reported experiencing three or more of these difficulties. Most of these indicators also suggest that, in line with some of the earlier data I noted, stress has declined since 2011, which probably largely reflects the fall in interest rates since that time.
Graph 6
Unfortunately, while the HILDA and SIH data are rich in terms of the information provided, they are not very timely. We have, for example, only just received the 2016 data. So much of the discussion on household stress relies on more timely private surveys. These surveys measure stress in different ways. Some focus specifically on mortgage stress. Others look at housing affordability, including for renters. And still others attempt to measure financial ‘comfort’ more broadly than just housing. Many of these suggest that housing stress has been increasing over the past year or so.
Looking at the history for which we have data for both the private and comprehensive surveys, it is a little difficult to reconcile their findings. But there do seem to be some methodological differences that mean some surveys might overstate financial stress somewhat. For example, in some of these surveys, self-assessed living expenses are used. If households include discretionary expenditure that could be cut back in an emergency, the amount of income available to meet scheduled repayments might be understated. Furthermore, if actual mortgage repayments are used, those households that are routinely ahead of their payments schedule might be assessed as having little spare income for emergencies when in reality they have been building up buffers and have surplus cash flow.
Most of the measures I have discussed so far are more in the nature of potential financial stress. For some households this will likely turn out to be temporary until their circumstances change. But others may find themselves in a prolonged period of belt tightening or, in the extreme, having to sell their property or default on their payments. In this latter case, financial stress will show up in non-performing loans on banks’ balance sheets and perhaps even in property repossessions or bankruptcies. What do these data tell us?
Banks’ non-performing housing loans have been trending upwards over the past few years, although they remain very low in absolute terms at around 0.8 per cent of banks’ domestic housing loan books (Graph 7). Much of this rise is attributable to a rise in non-performing loans in the mining-exposed states of Western Australia and Queensland – not unexpected given the large falls in employment and housing prices in some of these regions.
Graph 7
Personal insolvencies as a share of the population have remained fairly stable over the past few years. Applications for property possession as a share of the total dwelling stock have generally declined since 2010, with the exception being Western Australia (Graph 8). This indicates that financial stress has a high cyclical component, and there are likely to be some regions of the country that are in more difficult times than others. But the focus for financial stability considerations is largely a national rather than a regional perspective.
Graph 8
So my overall interpretation of these myriad pieces of information is that, while debt levels are relatively high, and there are owner-occupier households that are experiencing some financial stress, this group is not currently growing rapidly. This suggests that the risks to financial institutions and financial stability more broadly from household mortgage stress are not particularly acute at the moment.
Housing Investors
Most of my focus so far has been on owner-occupiers who account for around two-thirds of housing debt outstanding. But investment in housing has been growing strongly in recent years. So it is worth briefly considering the risk of financial stress emanating from this group of borrowers.
The risks to financial stability associated with investor mortgage debt are probably a bit different from those associated with owner-occupier debt. Investors tend to have larger deposits, and hence lower starting loan-to-valuation-ratios (LVRs) (Graph 9). They often have other assets, such as an owner-occupied home, and also earn rental income. Higher-income taxpayers are more likely to own investment properties than those on lower incomes, so may be better able to absorb income or interest rate shocks.
Graph 9
But investors have less incentive than owner-occupiers to pay down their debt. As noted above, many take out interest-only loans so that their debt does not decline over time. If housing prices were to fall substantially, therefore, such borrowers might find themselves in a position of negative equity more quickly than borrowers with an equivalent starting LVR that had paid down some principal. Indeed, the macro-financial risks are potentially heightened with investor lending. For example, since it is not their home, investors might be more inclined to sell investment properties in an environment of falling house prices in order to minimise capital losses. This might exacerbate the fall in prices, impacting the housing wealth of all home owners. As investors purchase more new dwellings than owner-occupiers, they might also exacerbate the housing construction cycle, making it prone to periods of oversupply and having a knock on effect to developers.
Data from the Australian Taxation Office (ATO) provide some information on housing investors. While not particularly timely, these data show that the share of taxpayers who are property investors has increased steadily over the past few years. In 2014/15, around 11 per cent of the adult population, or just over 2 million people, had at least one investment property and around 80 per cent of those were geared (Graph 10). Most of those investors own just one investment property but an increasing number own multiple properties. There has also been a marked increase in the share of geared housing investors who are over 60. These factors do not necessarily increase the risk of financial stress but they bear watching.
Graph 10
The recent increases in interest rates on investor loans, in response to APRA’s measures to reduce the growth in investor lending, has probably affected the cash flows of investors. Interest rates on outstanding variable-rate interest-only loans to investors have increased by 60 basis points since late 2016. However, over the past few years, lenders have been assessing borrowers’ ability to service the loan at a minimum interest rate of at least 7 per cent. So while interest rates and required repayments have likely risen, many borrowers should be relatively resilient to the recent changes.
Furthermore, a large proportion of interest-only loans are due to expire between 2018 and 2022. Some borrowers in this situation will simply move to principal and interest repayments as originally contracted. Others may choose to extend the interest-free period, provided that they meet the current lending standards. There may, however, be some borrowers that do not meet current lending standards for extending their interest-only repayments but would find the step-up to principal and interest repayments difficult to manage. This third group might find themselves in some financial stress. While we think this is a relatively small proportion of borrowers, it will be an area to watch.
Conclusion
The historically high levels of mortgage debt in Australia raises questions about the resilience of household balance sheets to a change in circumstances and the ability of the financial system to absorb a widespread increase in household financial stress. The information we have suggests that, while there are some pockets of financial stress, the overall level of stress among mortgaged households remains relatively low. Furthermore, the banking system is strong and well capitalised, and is supported by prudent lending standards. The risks to financial stability from this source therefore remain low although we will need to keep an eye on developments. Appropriately prudent lending standards will continue to play an important role in ensuring that the financial system remains stable and households borrow responsibly.
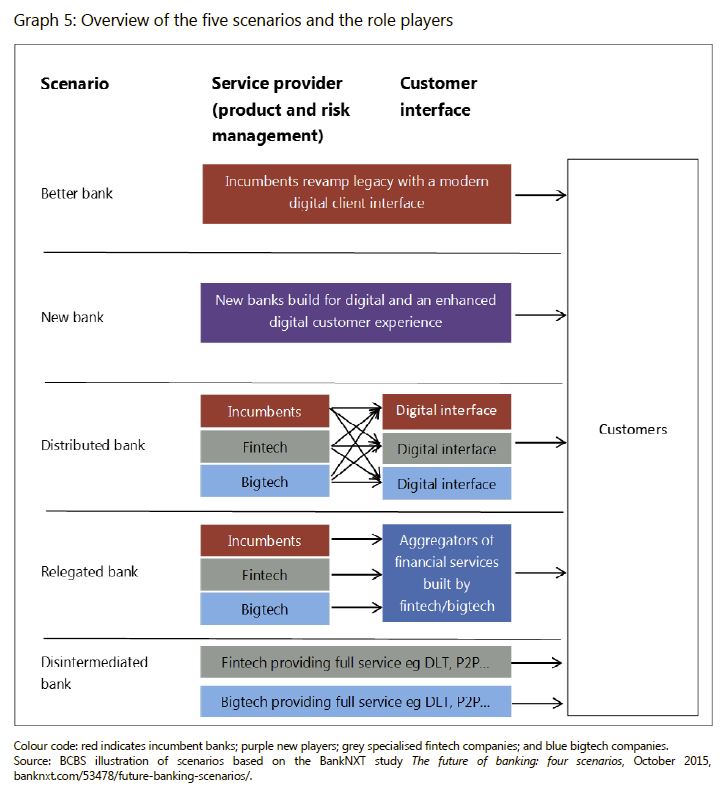
The BIS task force has developed five scenarios which highlight how Fintech disruption might play out, in a 50 page report “Implications of fintech developments for banks and bank supervisors.” Bankers will find it uncomfortable reading!
Under the The Bank For International Settlements (BIS) five scenarios, the scope and pace of potential disruption varies significantly, but ALL scenarios show that banks will find it increasingly difficult to maintain their current operating models, given technological change and customer expectations.
The fast pace of change in fintech makes assessing the potential impact on banks and their business models challenging. While some market observers estimate that a significant portion of banks’ revenues, especially in retail banking, is at risk over the next 10 years, others claim that banks will be able to absorb or outcompete the new competitors, while improving their own efficiency and capabilities.
The task force used a categorisation of fintech innovations. Graph 1 depicts three product sectors, as well as market support services. The three sectors relate directly to core banking services, while the market support services relate to innovations and new technologies that are not specific to the financial sector but also play a significant role in fintech developments.
The analysis presented in this paper considered several scenarios and assessed their potential future impact on the banking industry. A common theme across the various scenarios is that banks will find it increasingly difficult to maintain their current operating models, given technological change and customer expectations. Industry experts opine that the future of banking will increasingly involve a battle for the customer relationship. To what extent incumbent banks or new fintech entrants will own the customer relationship varies across each scenario. However, the current position of incumbent banks will be challenged in almost every scenario.
1. The better bank: modernisation and digitisation of incumbent players
In this scenario the incumbent banks digitise and modernise themselves to retain the customer relationship and core banking services, leveraging enabling technologies to change their current business models.
Incumbent banks are generally under pressure to simultaneously improve cost efficiency and the customer relationship. However, because of their market knowledge and higher investment capacities, a potential outcome is that incumbent banks get better at providing services and products by adopting new technologies or improving existing ones. Enabling technologies such as cloud computing, big data, AI and DLT are being adopted or actively considered as a means of enhancing banks’ current products, services and operations.
Banks use new technologies to develop value propositions that cannot be effectively provided with their current infrastructure. The same technologies and processes utilised by non-bank innovators can also be implemented by incumbent banks, and examples may include:
New technologies such as biometry, video, chatbots or AI may help banks to create sophisticated capacities for maintaining a value-added remote customer relationship, while securing transactions and mitigating fraud and AML/CFT risks. Many innovations seek to set up convenient but secure customer identification processes.
Innovative payment services would also support the better bank scenario. Most banks have already developed branded mobile payments services or leveraged payment services provided by third parties that integrate with bank-operated legacy platforms. Customers may believe that their bank can provide a more secure mobile payments service than do non-bank alternatives.
Banks may also be prone to offer partially or totally automated robo-advisor services, digital wealth management tools and even add-on services for customers with the intention of maintaining a competitive position in the retail banking market, retaining customers and attracting new ones.
In this scenario, digitising the lending processes is becoming increasingly important to meet the consumer’s demands regarding speed, convenience and the cost of credit decision-making. Digitisation requires more efficient interfaces, processing tools, integration with legacy systems and document management systems, as well as sophisticated customer identification and fraud prevention tools. These can be achieved by the incumbent by developing its own lending platform, purchasing an existing one, white labelling or outsourcing to third-party service providers. This scenario assumes that current lending platforms will remain niche players.
While there are early signs that incumbents have added investment in digitisation and modernisation to their strategic planning, it remains to be seen to what extent this scenario will be dominant.
2. The new bank: replacement of incumbents by challenger banks
In the future, according to the new bank scenario, incumbents cannot survive the wave of technology-enabled disruption and are replaced by new technology-driven banks, such as neo-banks, or banks instituted by bigtech companies, with full service “built-for-digital” banking platforms. The new banks apply advanced technology to provide banking services in a more cost-effective and innovative way. The new players may obtain banking licences under existing regulatory regimes and own the customer relationship, or they may have traditional banking partners.
Neo-banks seek a foothold in the banking sector with a modernised and digitised relationship model, moving away from the branch-centred customer relationship model. Neo-banks are unencumbered by legacy infrastructure and may be able to leverage new technology at a lower cost, more rapidly and in a more modern format.
Elements of this scenario are reflected in the emergence of neo- and challenger banks, such as Atom Bank and Monzo Bank in the United Kingdom, Bunq in the Netherlands, WeBank in China, Simple and Varo Money in the United States, N26 in Germany, Fidor in both the United Kingdom and Germany, and Wanap in Argentina. That said, no evidence has emerged to suggest that the current group of challenger banks has gained enough traction for the new bank scenario to become predominant.
Neo-banks make extensive use of technology in order to offer retail banking services predominantly through a smartphone app and internet-based platform. This may enable the neo-bank to provide banking services at a lower cost than could incumbent banks, which may become relatively less profitable due to their higher costs. Neo-banks target individuals, entrepreneurs and small to medium-sized enterprises. They offer a range of services from current accounts and overdrafts to a more extended range of services, including current, deposit and business accounts, credit cards, financial advice and loans. They leverage scalable infrastructure through cloud providers or API-based systems to better interact through online, mobile and social media-based platforms. The earnings model is predominantly based on fees and, to a lesser extent, on interest income, together with lower operating costs and a different approach to marketing their products, as neo-banks may adopt big data technologies and advanced data analytics. Incumbent banks, on the other hand, may be impeded by the scale and complexity of their current technology and data architecture, determined by factors such as legacy systems, organisational complexity and historical acquisitions. However, the customer acquisitions costs may be high in competitive banking systems and neo-banks’ revenues may be offset by their aggressive pricing strategies and their less-diverse revenue streams.
3. The distributed bank: fragmentation of financial services among specialised fintech firms and incumbent banks
In the distributed bank scenario, financial services become increasingly modularised, but incumbents can carve out enough of a niche to survive. Financial services may be provided by the incumbents or other financial service providers, whether fintech or bigtech, who can “plug and play” on the digital customer interface, which itself may be owned by any of the players in the market. Large numbers of new businesses emerge to provide specialised services without attempting to be universal or integrated retail banks – focusing rather on providing specific (niche) services. These businesses may choose not to compete for ownership of the entire customer relationship. Banks and other players compete to own the customer relationship as well as to provide core banking services.
In the distributed bank scenario, banks and fintech companies operate as joint ventures, partners or other structures where delivery of services is shared across parties. So as to retain the customer, whose expectations in terms of transparency and quality have increased, banks are also more apt to offer products and services from third-party suppliers. Consumers may use multiple financial service providers instead of remaining with a single financial partner.
Elements of this scenario are playing out, as evidenced by the increasing use of open APIs in some markets. Other examples that point towards the relevance of this scenario are:
Lending platforms partner and share with banks the marketing of credit products, as well as the approval process, funding and compliance management. Lending platforms might also acquire licences, allowing them to do business without the need to cooperate with banks.
Innovative payment services are emerging with joint ventures between banks and fintech firms offering innovative payment services. Consortiums supported by banks are currently seeking to establish mobile payments solutions as well as business cases based on DLT for enhancing transfer processes between participating banks (see Box 4 for details of mobile wallets).
Robo-advisor or automated investment advisory services are provided by fintech firms through a bank or as part of a joint venture with a bank.
Innovative payment services are one of the most prominent and widespread fintech developments across regions. Payments processing is a fundamental banking operation with many different operational models and players. These models and structures have evolved over time, and recent advances in technological capabilities, such as in the area of instant payment, have accelerated this evolution. Differences in types of model, technology employed, product feature and regulatory frameworks in different jurisdictions pose different risks.
The adoption by consumers and banks of mobile wallets developed by third–party technology companies – for example, Apple Pay, Samsung Pay,12 and Android Pay – is an example of the distributed bank scenario. Whereas some banks have developed mobile wallets in-house, others offer third-party wallets, given widespread customer adoption of these formats. While the bank continues to own the financial element of the customer relationship, it cedes control over the digital wallet experience and, in some cases, must share a portion of the transaction revenue facilitated through the third-party wallets.
Innovation in payment services has resulted in both opportunities and challenges for financial institutions. Many of the technologies allow incumbents to offer new products, gain new revenue streams and improve efficiencies. These technologies also let non-bank firms compete with banks in payments markets, especially in regions where such services are open to non-bank players (eg the Payment Service Directives in the European Union and the Payment Schemes or Payment Institutions Regulation in Brazil).
4. The relegated bank: incumbent banks become commoditised service providers and customer relationships are owned by new intermediaries
In the relegated bank scenario, incumbent banks become commoditised service providers and cede the direct customer relationship to other financial services providers, such as fintech and bigtech companies. The fintech and bigtech companies use front-end customer platforms to offer a variety of financial services from a diverse group of providers. They use incumbent banks for their banking licences to provide core commoditised banking services such as lending, deposit-taking and other banking activities. The relegated bank may or may not keep the balance sheet risk of these activities, depending on the contractual relationship with the fintech company.
In the relegated bank scenario, big data, cloud computing and AI are fully exploited through various configurations by front-end platforms that make innovative and extensive use of connectivity and data to improve the customer experience. The operators of such platforms have more scope to compete directly with banks for ownership of the customer relationship. For example, many data aggregators allow customers to manage diverse financial accounts on a single platform. In many jurisdictions consumers become increasingly comfortable with aggregators as the customer interface. Banks are relegated to being providers of commoditised functions such as operational processes and risk management, as service providers to the platforms that manage customer relationships.
Although the relegated bank scenario may seem unlikely at first, below are some examples of a modularised financial services industry where banks are relegated to providing only specific services to another player who owns the customer relationship:
Growth of payment platforms has resulted in banks providing back office operations support in such areas as treasury and compliance functions. Fintech firms will directly engage with the customer and manage the product relationship. However, the licensed bank would still need to authenticate the customer to access funds from enrolled payment cards and accounts.
Online lending platforms become the public-facing financial service provider and may extend the range of services provided beyond lending to become a new intermediary between customers and banks/funds/other financial institutions to intermediate all types of banking service (marketplace of financial services). Such lending platforms would organise the competition between financial institutions (bid solicitations) and protect the interests of consumers (eg by offering quality products at the lowest price). Incumbent banks would exist only to provide the operational and funding mechanisms.
Banks become just one of many financial vehicles to which the robo-advisor directs customer investments and financial needs.
Social media such as the instant messaging application WeChat13 in China leverage customer data to offer its customers tailored financial products and services from third parties, including banks. The Tencent group has launched WeBank, a licensed banking platform linked to the messaging application WeChat, to offer the products and services of third parties. WeBank/WeChat focuses on the customer relationship and exploits its data innovatively, while third parties such as banks are relegated to product and risk management.
5. The disintermediated bank: Banks have become irrelevant as customers interact directly with individual financial services providers.
Incumbent banks are no longer a significant player in the disintermediated bank scenario, because the need for balance sheet intermediation or for a trusted third party is removed. Banks are displaced from customer financial transactions by more agile platforms and technologies, which ensure a direct matching of final consumers depending on their financial needs (borrowing, making a payment, raising capital etc).
In this scenario, customers may have a more direct say in choosing the services and the provider, rather than sourcing such services via an intermediary bank. However, they also may assume more direct responsibility in transactions, increasing the risks they are exposed to. In the realm of peer-to-peer (P2P) lending for instance, the individual customers could be deemed to be the lenders (who potentially take on credit risk) and the borrowers (who may face increased conduct risk from potentially unregulated lenders and may lack financial advice or support in case of financial distress).
At the moment, this scenario seems far-fetched, but some limited examples of elements of the disintermediation scenario are already visible:
P2P lending platforms could manage to attract a significant number of potential retail investors so as to address all funding needs of selected credit requests. P2P lending platforms have recourse to innovative credit scoring and approval processes, which are trusted by retail investors. That said, at present, the market share of P2P lenders is small in most jurisdictions. Additionally, it is worth noting that, in many jurisdictions, P2P lending platforms have switched to, or have incorporated elements of, a more diversified marketplace lending platform business model, which relies more on the funding provided by institutional investors (including banks) and funds than on retail investors.
Cryptocurrencies, such as Bitcoin, effect value transfer and payments without the involvement of incumbent banks, using public DLT. But their widespread adoption for general transactional purposes has been constrained by a variety of factors, including price volatility, transaction anonymity – raising AML/CFT issues – and lack of scalability.
In practice the report highlights that a blend of scenarios is most likely.
The scenarios presented are extremes and there will likely be degrees of realisation and blends of different scenarios across business lines. Future evolutions may likely be a combination of the different scenarios with both fintech companies and banks owning aspects of the customer relationship while at the same time providing modular financial services for back office operations.
For example, Lending Club, a publicly traded US marketplace lending company, arguably exhibits elements of three of the five banking scenarios described. An incumbent bank that uses a “private label” solution based on Lending Club’s platform to originate and price consumer loans for its own balance sheet could be characterised as a “distributed bank”, in that the incumbent continues to own the customer relationship but shares the process and revenues with Lending Club.
Lending Club also matches some consumer loans with retail or institutional investors via a relationship with a regulated bank that does not own the customer relationship and is included in the transaction to facilitate the loan. In these transactions, the bank’s role can be described as a “relegated bank” scenario. Other marketplace lenders reflect the “disintermediated” bank scenario by facilitating direct P2P lending without the involvement of a bank at any stage.
NAB staff were informed by chief people officer Lorraine Murphy yesterday that “the next phase in transforming our business is underway, as part of a three-year process”.
In November 2017, InvestorDaily reported on the major bank’s plans to cut 6,000 jobs and create 2,000 new digital-focused jobs by 2020.
A NAB spokesperson told InvestorDaily approximately 1,000 jobs will be cut every six months for the next three years.
InvestorDaily understands the exact number of job losses in the first half of 2018 will depend on the number of voluntary redundancies and redeployments into digital-focused roles.
“The proposed new structure will reduce the layers and complexity in the bank so that we can be simpler, make decisions faster and be even closer to our customers,” the bank said in a statement.
Ms Murphy said there was “no doubt” this transition was right for the bank business.
“We will acknowledge the contribution that people who are leaving us have made. We will show through our actions that we care,” said Ms Murphy.
Staff that leave the bank will have “world-class support” through the bank’s career transition program titled ‘The Bridge’, which will offer employees made redundant with six months of support and resources.
“We said we would provide the utmost care and respect for all of our people. This remains our priority,” Ms Murphy said.
“I encourage you to ensure that all of our people understand the changes and are supported, and that those who remain with us can deliver the type of bank we have promised our customers – a simpler, faster bank.”
InvestorDaily also reported on comments made by NAB chief executive Andrew Thorburn, who signalled the number of bricks-and-mortar branches was declining.
“What’s happening is that more and more customers are using their mobile device and online banking, and some branches are being used less and less and less,” Mr Thorburn said in November.
“And as that happens, like any business, we need to adjust.”
However, in a statement, the Finance Sector Union (FSU) expressed concerns that the job cutting “does not meet community expectations”, pointing out that with the royal commission underway, Australian banks are being watched closely and NAB should take this responsibility to “rebuild its brand”.
“This is not just 6,000 workers that will lose their jobs – it’s 6,000 people that will have to go home and tell their families they no longer have work,” said FSU national secretary Julia Angrisano.
Many of the workers whose jobs would be axed or made redundant will have been at the bank for years and were a driving force behind NAB’s profits, Ms Angrisano pointed out.
“It’s not like NAB is in trouble – they can afford to retrain their workers. They made $6.7 billion dollar profit last year,” she said.
“Post retrenchment support is too little too late, workers need to be re-skilled to move into the jobs of the future now.”
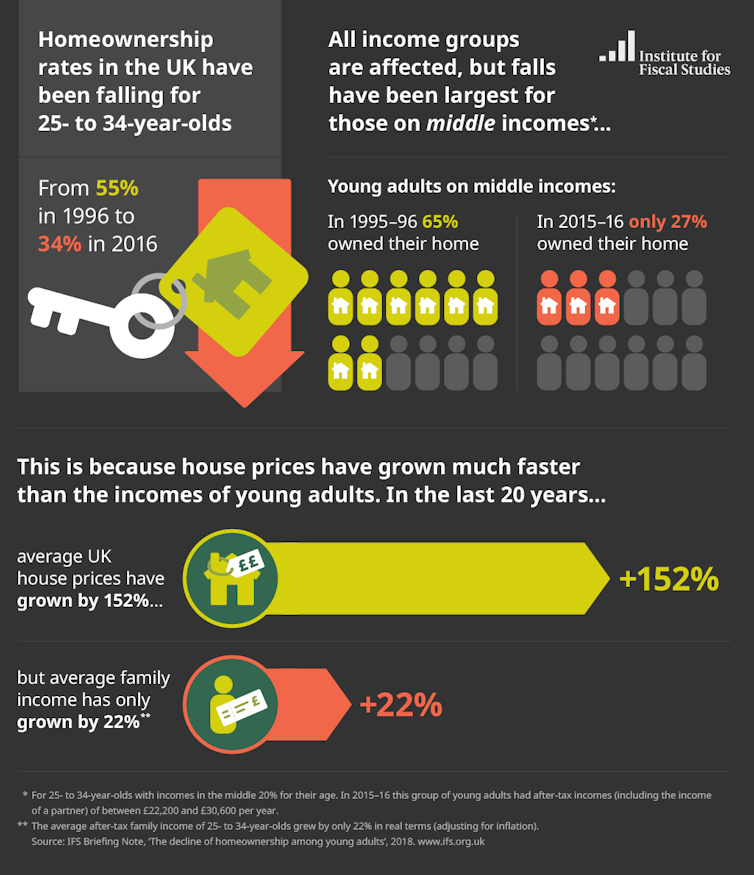
Speaking to the Conservative Party conference in September 2017, the UK prime minister, Theresa May, gave a stark assessment of the UK housing market which made for depressing listening for many young people: “For many the chance of getting onto the housing ladder has become a distant dream”, she said.
Now a new report by the Institute of Fiscal Studies (IFS) provides further, clear evidence of this. The study finds that home ownership among 25 to 34-year-olds has declined sharply over the past 20 years. Home ownership rates have declined from 43% at age 27 for someone born in the late 1970s, to just 25% for someone aged 27 who was born in the late 1980s.
The most significant decline has been for middle-income young people, whose rate of home ownership has fallen from 65% in 1995/6 to 27% now – most significantly hitting aspirant buyers in London and the South-East.
Causes and consequences
The IFS study lays the blame for all this on the growing gap between house prices and incomes. Adjusting for inflation, house prices have risen 150% in the 20 years to 2015/16, while real incomes for 25 to 34-year-olds have grown by 22% (and almost all of that growth happened before the 2008 crash).
But, as the report acknowledges, the problem goes much deeper than this. Home ownership rates differ by region. Although there has been a decline in home ownership rates for young people across all areas of Great Britain, the decline is less significant in the North East and Cumbria as well as in Scotland and the South West. The biggest decline in ownership has been in the South-East, the North-West (excluding Cumbria) and London.
So a person aged 25 to 34 is more than twice as likely to own their own home in Cumbria, as their counterpart in London. Worse, young people from disadvantaged backgrounds are less likely to own their own homes – even after controlling for differences in education and earnings. Home ownership continues to reflect a deeper inequality of opportunity in our society.
More houses needed
Part of the problem is that both Labour and Conservative governments have seen housing as a single, stand-alone market and have focused their attention on what is happening to prices in London. But housing is a number of different markets, which have regional variations and different interactions between the owner-occupier, private rented and social rented sectors.
Regional variations in house prices for similar sized properties reflect the imbalances of the economy: it is heavily reliant on financial services, which are concentrated in London, while the public sector makes up a significant share of many local economies – particularly in the North. Migration from across the UK to overcrowded and expensive areas – such as London and the South-East – have put property prices in those areas even further out of reach for would-be buyers.
To make matters worse, both Labour and Conservative governments have routinely failed to build enough houses. While the current government’s aim to build 300,000 new properties a year by 2020 is welcome, it is simply not enough to meet the backlog in demand – let alone address the fundamental affordability problem.
Where homes are being built, they’re often the wrong types of homes, in the wrong places. Family homes are being built, despite there being some four million under-occupied such properties across the country.
Not that long ago, government was reducing the housing stock in many parts of the North, through the disastrous Housing Market Renewal programme. Houses are currently being sold in smaller cities such as Liverpool and Stoke-on-Trent for just £1. And none of the government’s actions suggest that ministers understand these issues, or are prepared to address them.
House price inflation – and the awful affect it is having on home ownership rates for young people – is part of a wider problem of the global asset bubble. This bubble has seen huge increases in the price of assets – stocks, housing, bonds – in high income countries such as the UK. Successive governments have helped to fuel this through quantitative easing, ultra-cheap money and successive raids on pension funds.
What’s needed to address this asset bubble is a substantive increase in interest rates. But while this may slow the growth in house prices, the sad truth is it will do nothing to make housing more affordable for most young people.
Author: Chris O’Leary, Deputy Director, Policy Evaluation and Research Unit and Senior Lecturer, Manchester Metropolitan University
As auction volumes return to more normal levels after the festive period slowdown, auction clearance rates are holding higher than late 2017.
A preliminary auction clearance rate of 69.1 per cent was recorded across the combined capital cities as auction activity ramped up this week, with a total of 1,963 homes taken to auction, increasing from the 1,490 auctions held last week when (based on final results) 63.7 per cent cleared. While auction activity has increased over the last couple of weeks coming out of the slowdown, volumes are increasing at a slower pace than what was seen over the equivalent period last year (2,291).
Sydney’s preliminary clearance rate was recorded at 74.3 per cent across 718 scheduled auctions; well above the trend over the final quarter of 2017 where auction clearance rates were tracking in the low 50 per cent range. A preliminary auction clearance rate of 70.7 per cent was recorded across Melbourne, which is unchanged from last week’s final clearance rate, however volumes increased this week with 923 auctions held up from 619 last week.
This will be the first week in some time where Sydney has outperformed Melbourne, however as final results are collect it will be interesting to see how this revises.
The performance across the smaller auction markets was varied this week, with Adelaide recording a preliminary auction clearance rate of 67.3 per cent, while only 12.5 per cent of auctions were successful in Tasmania.
Looking at results by broad property types, Sydney houses were the best performing market this week, with 74.6 per cent of properties selling, followed closely by Melbourne’s unit market with 74.1 per cent of units selling, which was higher than Sydney’s units.
NAB has today commenced Comprehensive Credit Reporting (CCR) for personal loans, credit cards, and overdrafts, as announced in October 2017.
NAB is the first major bank to start participating in CCR, well ahead of the Government’s mandatory scheme.
NAB Chief Operating Officer, Antony Cahill, says NAB has taken a leadership position on CCR since the start.
“Under Comprehensive Credit Reporting, we now have a more holistic picture of a customer’s credit situation, so we’re better able to make sure our customers receive the right type and amount of credit for their individual circumstances.
“We believe CCR is good for competition, and will mean better outcomes for customers.
“A number of smaller players have been participating in CCR already, and the Government recently released draft legislation to make it mandatory for all the major banks.
“We’re pleased to be going live with CCR today, and we look forward to seeing it roll out across the industry.”
About Comprehensive Credit Reporting:
Most Australians have a credit report. CCR will mean credit reports will represent a more balanced reflection of their credit history.
For decades, a credit report has contained only negative information – information like when someone’s defaulted on a loan, and how many credit enquiries they’ve made.With Comprehensive Credit Reporting, positive credit information will be added – including which accounts have been opened, credit limits on those accounts, and details of monthly payments made as well as missed.
This will provide a more complete picture of a customer’s situation, and mean that lenders like NAB are better able to match our provision of credit to a customer’s individual needs.
NAB has commenced CCR for personal loans, credit cards, and overdrafts. Later this year, other types of lending will also be included. NAB is phasing its roll out of CCR to ensure a smooth transition for customers
Last Wednesday, the Australian Prudential Regulation Authority (APRA) proposed key revisions to its capital framework for authorized deposit taking institutions (ADIs). The revisions cover the calculation of credit,
market and operational risks. These proposed changes are credit positive for Australian ADIs because they will improve the alignment of capital and asset risks in their loan portfolios. Moody’s says the key proposals are as follows:
Revisions to the capital treatment of residential mortgage portfolios under the standardized and advanced approaches, with higher capital requirements for higher-risk segments
Amendments to the treatment of other exposures to improve the risk sensitivity of risk-weighted asset outcomes by including both additional granularity and recalibrating existing risk weights and credit
conversion factors for some portfolios
Additional constraints on the use of ADIs’ own risk parameter estimates under internal ratings-based approaches to determine capital requirements for credit risks and introducing an overall floor to riskweighted assets for ADIs using the standardized approach
Introduction of a single replacement methodology for the current advanced and standardized approaches to operational risks
Introduction of a simpler approach for small, less complex ADIs to reduce the regulatory burden without compromising prudential soundness
A particularly significant element of the new regime is a reform of the capital treatment of residential mortgages, given that more than 60% of Australian banks’ total loans were residential mortgages as of January 2018.
The improved alignment of capital to risk for residential mortgages will come from hikes in risk weights on several higher-risk loan segments. APRA proposes increased risk weights for mortgages used for investment purposes, those with interest-only features and those with higher loan-to-valuation ratios (LVR). At the same time, risk weights for some lower-risk segments likely will drop. For example, under the standardized approach, standard mortgages with LVR ratios lower than 80% will require risk weights of only 20%-30%, down from 35% under current requirements.
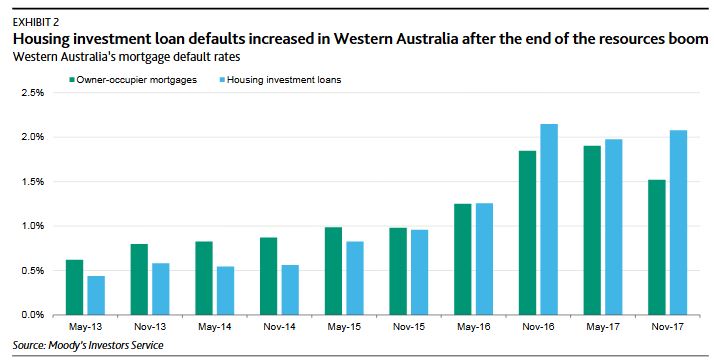
The higher capital charges on investment loans will better reflect their higher sensitivity to economic cycles. During periods of economic strength investment loans perform well. As Exhibit 1 shows, on a national basis
and during a time of strong economic growth, defaults on investment loans have been lower than owner occupier loans.
However, in Western Australia, where the economy has deteriorated following the end of the investment boom in resources, defaults on investment loans have been higher than owner-occupier loans, as Exhibit 2 shows.
Investment loans also are sensitive to the interest rate cycle. During periods of rising interest rates, investment loans tend to experience higher default rates than owner-occupier loans, as shown in Exhibit 3.
More warnings, this time from comparison site Mozo on the risks of borrowers grabbing the “cheap” special mortgage offers which are flooding the market at the moment.
Aussie lenders are luring prospective home loan customers with competitive introductory rates, but these could cost you thousands in unnecessary interest over the long run, according to recent Mozo research.
Crunching the numbers in the Mozo database, we found that homeowners could pay as much as 174 basis points more when the ‘honeymoon period’ on their home loan ends.
In fact the research revealed that the average homeowner with a $300,000 home loan could end up paying as much as $3,423 in additional interest charges each year if they’re caught taking the introductory rate bait.
But this can become an even more costly error when you consider how much extra interest you could end up paying over the life of the loan, said Mozo Director, Kirsty Lamont.
“If borrowers fail to check the fine print they can end up stuck with a loan that has an uncompetitive ongoing rate after the introductory period ends,” she said.
“That mistake can end up costing you tens of thousands of dollars in extra interest over the term of the loan.”