Payday Lending’s Online Revolution

Payday Lending has been subject to considerable regulation in recent years, but using data from our household survey’s and DFA’s economic modelling, today we look at expected trends, in the light of the rise on convenient online access to this form of funding.

We will focus on analysis of small amount loan – a loan of up to $2,000 that must be repaid between 16 days and 1 year. ‘Short term’ loans of $2,000 or less repayed in 15 days or less have been banned since 1 March 2013.  These rules do not apply to loans offered by Authorised Deposit-taking Institutions (ADIs) such as banks, building societies and credit unions, or to continuing credit contracts such as credit cards. More detail are on ASIC’s Smart Money site.

The law requires credit providers to verify the financial situation of applicants, and to ask for evidence from documents like payslips or Centrelink statements, copies of bills, copies of other credit contracts or statements of accounts or property rental statements. The number of documents a lender asks for will depend on whether they have relationship data, credit history or bank statements. If households receive the majority (50% of more) of income from Centrelink, the repayments on the small amount loan (including any other small amount loans held) must not exceed 20% of income. If they do, potential applicants will not qualify for a small amount loan.

From 1 July 2013, the fees and charges on a small amount loan have been capped. While the exact fee will vary depending on the amount of money borrowed, credit providers are only allowed to charge a one-off establishment fee of 20% of the amount loaned, a monthly account keeping fee of 4% of the amount loaned, a government fee or charge,default fees or charges and enforcement expenses. Credit providers are not allowed to charge interest on the loan. This cap on fees does not apply to loans offered by ADIs such as banks, building societies or credit unions.

DFA covered payday lending in a recent post, and ASIC has been highlighting a range of regulatory and compliance issues.

So, we begin our analysis with an estimation of the size of the market, and the proportion of loans originated online. The value of small loans made has been rising, and we now estimate the market to be more than $1bn per annum. We expect this to rise, and in our forward modelling we expect the market to grow to close to $2bn by 2018 in the current economic and regulatory context.

One of the main drivers of this expected lift is the rise in the number of online players, and the rising penetration of online devices used by consumers. Today, we estimate from our surveys about 40% of loans are online originated. We estimate that by 2018, more than 85% of all small loans will be originated online.  As we highlighted in our previous post, the concept of instant application, and fast settlement is very compelling for some households.

Pay-Day-June15-3
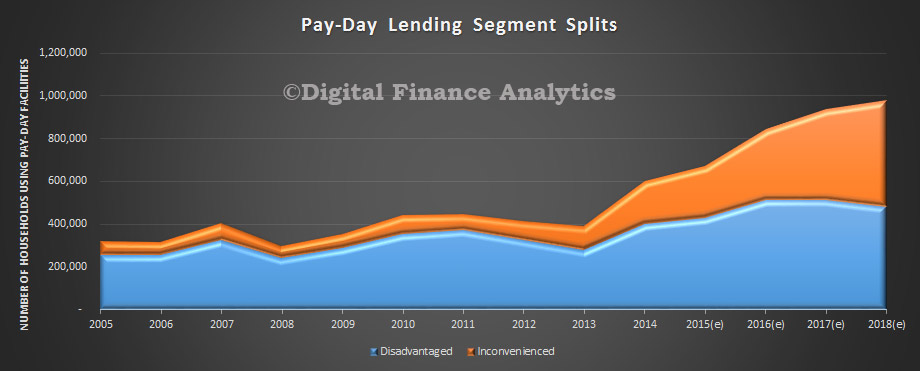
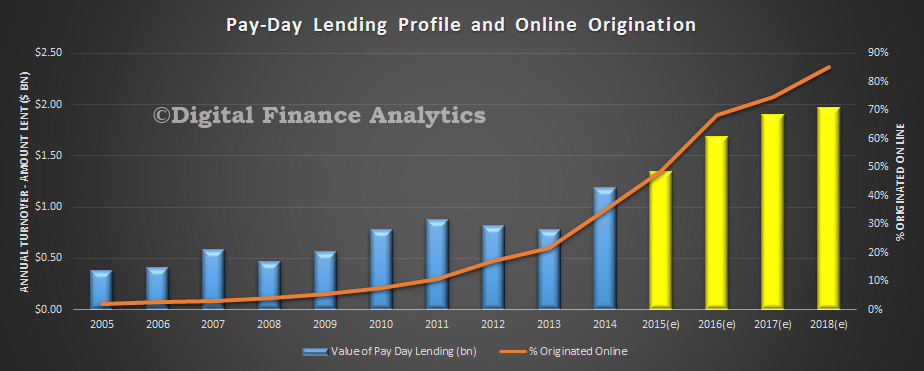
The DFA segmentation for payday households identifies two discrete segments. The first, which we call disadvantaged are households who are likely to be frequent users of small amount loans, often on Centrelink benefits, are socially disadvantaged, and with poor work history. The second segment is one which we call inconvenienced. These households are more likely to be in employment, but for various reasons are in a short term cash crisis. This may be because of unexpected bills, illness, unemployment, or some other external factor. They may even borrow for a holiday or family event such as wedding or funeral. They are less likely to be serial borrowers.

We see that both segments are tending to use online tools to seek a loan and may also be accessing other credit facilities. Our prediction is that by 2018, of the total of all small loans applied for, more than 35% will be applied for by disadvantaged, and 45% by inconvenienced via online. Together this means that as many as 90% of loans could be be sourced online. More than three quarters of these applications will be via a smart phone or tablet. As a result the average age of a small loan applicant is dropping, and we expect this to continue in coming years. This helps to explain the rise on TV and radio advertising, directing households with financial needs direct to a web site. Phone based origination, as a result is on the decline. We estimate there are more than 100 online credit providers in the market, comprising both local and international players. Online services means the credit providers are able to access the national market, whereas historically, many short terms loans were made locally by local providers, face to face. This is a significant and disruptive transformation.

Pay-Day-June15-4
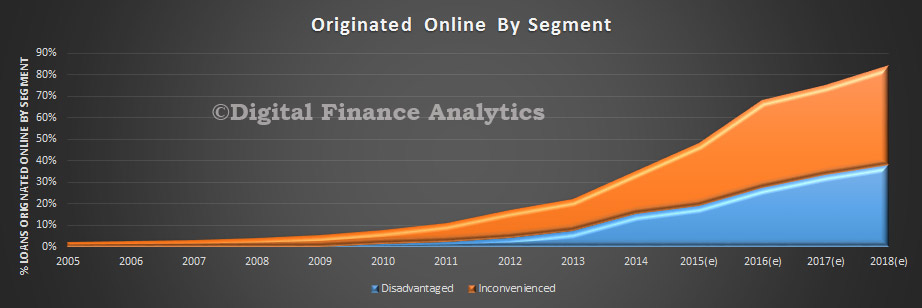
We finally look at the segment splits in terms of number of households using these loans. We note a significant rise in the number of inconvenienced households, to the point where by 2018, about half will be this segment. This is because the rules have been tightened for disadvantaged households, and online penetration for inconvenienced is higher.

Pay-Day-June15-1


How Banks Really Work

In a working paper, issued by the Bank of England, they explore the fundamentals of how banks work. The traditional model is that banks are driven by deposit taking, and use these deposits to make loans, so there is a direct link between deposits (and their volume and interest rates) and capacity to lend. Indeed, some suggest most monetary policy assumes this, yet many central banks have a different perspective.  Last year the Bank of England turned the model on its head by suggesting that actually banks have the capacity to create UNLIMITED amounts of credit, in fact creating money, unrelated to deposits.

Banks that create purchasing power can technically do so instantaneously and discontinuously, because the process does not involve physical goods, but rather the creation of money through the simultaneous expansion of both sides of banks’ balance sheets. While money is essential to facilitating purchases and sales of real resources outside the banking system, it is not itself a physical resource, and can be created at near zero cost. The most important limit, especially during the boom periods of financial cycles when all banks simultaneously decide to lend more, is their own assessment of the implications of new lending for their profitability and solvency, rather than external constraints such as loanable funds, or the availability of
central bank reserves. In fact, the quantity of reserves is therefore a consequence, not a cause, of lending and money creation.

This may explain why banking economics work they way they do. It also raises interesting questions in terms of banking regulation.

This paper, “Banks are not intermediaries of loanable funds – and why this matters” – Zoltan Jakab and Michael Kumhof looks at the two models, in some detail.

In the intermediation of loanable funds model of banking, banks accept deposits of pre-existing real resources from savers and then lend them to borrowers. In the real world, banks provide financing through money creation. That is they create deposits of new money through lending, and in doing so are mainly constrained by profitability and solvency considerations. This paper contrasts simple intermediation and financing models of banking. Compared to otherwise identical intermediation models, and following identical shocks, financing models predict changes in bank lending that are far larger, happen much faster, and have much greater effects on the real economy.

Note that working papers describe research in progress by the author(s) and are published to elicit comments and to further debate. Any views expressed are solely those of the author(s) and so cannot be taken to represent those of the Bank of England or to state Bank of England policy. This paper should therefore not be reported as representing the views of the Bank of England or members of the Monetary Policy Committee or Financial Policy Committee.

Banks Grew Home Loans Again In April to $1.35 Trillion

APRA released their Monthly Banking Statistics for April 2015 today. The total home loans outstanding on the bank’s books reached $1.346 trillion, up from $1.336 trillion last month. Overall growth in the portfolio was 0.74%, with owner occupied loans sitting at 0.6% up, and investment loans 1% higher. This is before the regulatory taps were turned.

We will this month concentrate on the home loan portfolio, because it is of the most significance just now.  First, lets look at the APRA “hurdle” of 10% market growth. Now there are a number of different ways to calculate this important number. Some have chosen other methods which understate the true picture in our view. We have chosen to calculate the sum of the monthly moving averages, and the results are displayed below. A number of players are well over the 10% line, and might expect a “please explain” from the regulator. Officially, they have a little time to get into line by the way. Some players of course are subject to non-organic growth, and this will distort some of the figures.

YOYINVMovementsAPRAApril2015In contrast, the OO portfolio (not subject to the 10% rule) also makes quite interesting reading. In both cases some of the smaller organisations are making hay and expanding quite fast. We hope they have their underwriting and approval processes set right!

YOYOOMovementsAPRAApril2015Next, a view of the monthly portfolio movements for both OO and INV loans.

HomeLoansMovementApril2015Finally, a picture of the relative shares of home loans, both investment and owner occupied loans, by some the the main players (in volume terms).

HomeLoanSharesAPRAApril2015If you look at the relative distribution of OO and INV loans, you can see which players may have more to worry about is the regulatory tightening on investment lending gets more intense. Recent events from New Zealand are insightful here, with the proposal to lift capital requirements on investment loans. We covered this in an earlier post.

HomeLoansPCSplitsAPRAApril2015Turning to Deposits, balances rose by $7 billion, to $1.8 trillion, an uplift of 0.38% from last month. Little change in the mix between major players. CBA maintains its pole position, although NAB grew its portfolio the fastest.

DepositSharedAPRAApril2015In the cards portfolio, total balances fell slightly from $41.6 billion to $41.3 billion. Again little change in the mix between players, although CBA lost more than half of the value drop from its portfolio from March to April.

CardsShareAPRAApril2015

RBNZ Moves Closer To Changing Capital Rules For Investment Loans

The Reserve Bank of New Zealand published the results of its consultation on the proposal to vary the capital risk weighting of investment versus owner occupied loans. Stakeholders are invited to provide feedback on the proposed wording changes to the Reserve Bank’s capital adequacy requirements by 19 June 2015, with a view to implemention by October.

They cite considerable evidence that investment loans are inherently more risky:

  1. the fact that investment risks are pro-cyclical
  2. that for a given LVR defaults are higher on investment loans
  3. investors were an obvious driver of downturn defaults if they were identified as investors on the basis of being owners of multiple properties
  4. a substantial fall in house prices would leave the investor much more heavily underwater relative to their labour income so diminishing their incentive to continue to service the mortgage (relative to alternatives such as entering bankruptcy)
  5. some investors are likely to not own their own home directly (it may be in a trust and not used as security, or they may rent the home they live in), thus is likely to increase the incentive to stop servicing debt if it exceeds the value of their investment property portfolio
  6. as property investor loans are disproportionately interest-only borrowers, they tend to remain nearer to the origination LVR, whereas owner-occupiers will tend to reduce their LVR through principal repayments. Evidence suggests that delinquency on mortgage loans is highest in the years immediately after the loan is signed. As equity in a property increases through principal repayments, the risk of a particular loan falls. However, this does not occur to the same extent with interest-only loans.
  7. investors may face additional income volatility related to the possibility that the rental market they are operating in weakens in a severe recession (if tenants are in arrears or are hard to replace when they leave, for example). Furthermore, this income volatility is more closely correlated with the valuation of the underlying asset, since it is harder to sell an investment property that can’t find a tenant.

Although the Basel guidelines for IRB banks envisage that loans to residential property investors be treated as non-retail lending, the same is not the case for banks operating on the standardised approach. The Basel guidelines consider all mortgage lending within the standardised approach as retail lending within the same sub-asset class. However, the guidelines also provide regulators with ample flexibility to implement them according to the needs of their respective jurisdictions. There are three reasons why any consideration as to whether to group loans to residential property investors in New Zealand should also include standardised banks.

  1. the different risk profile of property investors applies irrespective of whether the lending bank is a bank operating on the standardised approach or on the internal models approach.
  2. macro-prudential considerations include standardised banks as well as internal models banks. Prepositioning banks for a potential macro-prudential restriction on lending to residential property investors has to involve all locally incorporated banks.
  3. risk weights on housing loans are comparatively high in New Zealand and, more crucially, the gap in mortgage lending risk weights between standardised and IRB banks is not as high as it might be in many other jurisdictions. In order to maintain the relativities between the two groups of banks for residential investment property lending, it would be useful to also include standardised banks in the policy considerations.

So the bank is proposing to impose different risk weightings on investment and owner occupied loans, for both IRB and standard capital models.

The Reserve Bank would expect banks to continue to use their current PD models until such time that new models have been developed or banks have been able to verify that the current models can also be applied to property investment loans. Through the cycle PD rates appear broadly similar to those of owner-occupiers if the evidence from overseas also holds for New Zealand, although it is not clear whether the risk drivers are the same between the two groups of mortgage borrowers. The Reserve Bank would therefore expect banks to assess in due course whether their current PD mortgage models can be used for the new asset class or whether new or amended versions of the current models should be used.

RBNZCapital1May2015For standardized banks, the Reserve Bank has to prescribe the risk weights as per the relevant capital adequacy requirements. Those requirements currently link a loan’s risk weight to its LVR at origination. Maintaining that link, the Reserve Bank proposed higher risk weights per LVR band

RBNZCapital2May2015These calibrations would lead to a higher capital outcome for residential property investment mortgages compared to owner-occupier loans. However, the capital outcome would be below that of using the income producing real estate asset class and, in the Reserve Bank’s opinion, reflect the mix of property investment borrowers that the new asset class would entail.

Stakeholders are invited to provide feedback on the proposed wording changes to the Reserve Bank’s capital adequacy requirements by 19 June 2015.

This further tilts the playing field away from property investment loans.

Total Housing At Record $1.46 Trillion in April

The latest data from the RBA, Credit Aggregates to end April 2015, shows that lending for investment property pushed higher again, whilst lending to business went backwards. Looking at the splits, overall housing credit was up 0.54% seasonally adjusted to $1.46 trillion, with owner occupied lending up 0.41% to $954 billion and investment lending up 0.79% to $503 billion. Personal credit fell 0.84% to $141 billion and lending to business fell 0.04% to $790 billion. As a result, the percentage of lending devoted to housing rose to 61% of total (excluding lending to government), up from 56% in 2010.

RBACreditAggretagesApril2015Tracking the relative monthly movements, highlights the concentration in the housing, and specifically the investment housing sector. We will see if recent moves by APRA and the banks tames the beast in the months ahead.

RBAAggregateMovementApril2015Looking at the housing data, the proportion of the portfolio in the more risky housing investment sector rose again, to 34.6%.

RBAAggregatesApril2015HousingFurther evidence of the unbalanced state of the economy.

HIA New Home Sales Push Higher in April

The latest result for the HIA New Home Sales Report, a survey of Australia’s largest volume builders, reveals a fourth consecutive monthly rise. New homes sales have increased in each of the first four months of 2015.  The April result for total seasonally adjusted new home sales comprised of two small gains, 0.4 per cent for detached house sales and 0.9 per cent for multi-unit sales. In terms of detached house sales, both NSW and Victoria posted monthly gains in April (as did Western Australia), although Queensland recorded a disappointing decline. Sales in South Australia continued to weaken and are at an 18-month low

In April 2015 private detached house sales increased by 7.2 per cent in New South Wales, by 2.7 per cent in Victoria, and by 0.9 per cent in Western Australia. Private detached house sales dropped by 9.0 per cent in Queensland and were down by 1.9 per cent in South Australia. In the April 2015 ‘quarter’, detached house sales increased in NSW (+0.5 per cent) and Victoria (+7.4 per cent), but declined in SA (-4.7 per cent), Queensland (-4.4 per cent) and WA (-1.6 per cent). This profile is broadly consistent with HIA forecasts for detached house commencements, with the exception of Queensland which is looking weaker than expected.

HIA-Sales-April2015

Dark Pools Review Out By End October – ASIC

In a wide ranging speech, Greg Medcraft, Chairman, Australian Securities and Investments Commission outlined the role of ASIC, and some of the issues they are focussing on, including “how we influence conduct, our new review of high-frequency trading and dark liquidity, managing confidential information and our new Market Entity Compliance System”. Of specific interest, the findings from the latest review on dark pool trading is due end October 2015.


High-frequency trading and dark liquidity

The next topic I wanted to talk about is our upcoming review of high-frequency trading and dark liquidity. As part of ASIC’s ongoing monitoring of our markets, we are reviewing high-frequency trading and dark liquidity following on from our earlier review in 2013.

While we don’t have any specific concerns about high-frequency trading at present, and are satisfied that the regulatory framework is appropriate, we recognise that this is a dynamic area. In 2012, high-frequency traders were less than 1% of traders but 27% of turnover in the ASX 200. We are launching a new review to assess how high-frequency trading has changed in both the futures and equities markets.

On dark liquidity, our review will consider how dark liquidity – currently 28% of market turnover – and dark trading venues are evolving. It will also re-test whether the balance of lit and dark liquidity is impacting price formation, which is fundamental to trust and confidence in our markets.

Key findings from our reviews will be published towards the end of October 2015, and we will consider if there are any areas where we need to respond by applying the right nudge to change behaviour.

Post Crisis Reform – APRA

APRA’s Wayne Byres, spoke in Singapore  “The post-crisis reform agenda – a stocktake“. He discusses progress in Prudential Regulation, across banking, too-big-to-fail, shadow banking and derivatives; and also calls out areas for future attention, including the regulation of financial firms, and the broader issues of culture and behaviourial change within financial service players.

The international reform agenda has focussed on four broad objectives:

  • building resilient financial firms (particularly banks);
  • ending too-big-to-fail;
  • transforming shadow banking into transparent and resilient market-based financing; and
  • making derivative markets safer.

When we look at each of these areas, I am confident that most people in this room would agree with the broad conclusion that a great deal of work has been done, and that in all cases we are better off today than we were pre-2007. But I suspect many of you would also hold to the view that there is more to do before we can genuinely sit back and say the job is done.

Let’s start with bank capital and liquidity. Basel III substantially increased the quality and quantity of bank capital and, just as importantly, introduced new standards for liquidity and funding where there had previously been an international void. Even though many of these new standards are not required to be fully in place for a few years yet, we can look at the banking industry today and say that, by and large, the industry is meeting the new standards with:

  • substantial amounts of new equity having been raised;
  • capital instruments that did not act as a loss absorber being replaced;
  • greater levels of liquidity, and (more importantly) better liquidity management evident; and
  • excessive structural maturity mismatches being contained to more prudent levels.

All of this has been achieved without, as was predicted by some when the reforms were announced, the sky falling in. Indeed, resilience has become a virtue for financial firms, and critical to being a strong competitor in financial markets. Long may that continue.

Critical to making sure this is not a temporary phenomenon has been consistent implementation of the Basel III standards into national regulations. One of the more important post-crisis reforms that does not always get the credit it deserves is the decision by member jurisdictions to open themselves up to a much greater level of peer review. The Basel Committee’s Regulatory Consistency Assessment Programme (RCAP) has been instrumental in demonstrating to the world that the G20’s commitment to the full, timely and consistent implementation of Basel III was serious – and it has placed the spotlight on areas where it has not yet been delivered. Having been intimately involved in the first dozen or so of these reviews, I can confidently say they have had an unambiguously positive impact. Similar peer review programmes by the FSB and other standard-setters have provided additional scrutiny and transparency to national implementation in a range of other areas.

The important point to note is that, when we think about post-crisis reforms, it is not just financial firms that have needed to lift their game; regulatory agencies have needed to do likewise.

There is still more to do, and the Basel Committee’s upcoming meeting has a busy agenda. If I have a reservation when it comes to the remaining policy work programme of the Committee, it is that the finish line still looks a little too far away in some key areas. We may be better off if we narrow our focus and devote our resources to a few key issues – which I would argue centre on the IRB approach and the reliability of models in the regulatory framework – and make sure we deal with them as quickly as possible. That doesn’t mean we should not address the full range of remaining issues on the agenda, but the need for immediate action is much less.

Too-big-to-fail has been a long-standing problem; almost by definition, long-standing problems don’t have an easy answer. Nevertheless, measures that reduce implicit subsidies and price risk correctly should substantially improve the resilience, efficiency and competitiveness of the financial system, so our efforts are undoubtedly adding value. And we have made good headway.  Regimes for identifying and applying higher capital requirements for G- and D-SIBs (and soon G-SIIs), more robust resolution arrangements, the development of meaningful recovery plans that do not rely on public sector support, and current efforts to establish greater loss-absorbing capacity in the world’s G-SIBs will not necessarily rid the world completely of the too-big-to-fail problem, but will lessen the difficulties that authorities face in times of stress. It is certainly a worthwhile investment to make.

When it comes to shadow banking and derivative reforms, we have made important progress in key areas, but the task is far from complete. In the case of shadow banking, we continue to grapple with understanding what exists in the shadows. The good news is that our knowledge is better than it was, and we are all alert to the risks, but we cannot yet feel confident that a concentration of risk could not be lurking undetected. The increased use of trade repositories and CCPs for derivatives markets has created a more transparent and orderly trading environment. But again, we have not yet done all we need to to get a good global picture of the risks in these markets.

That brings me to an important general observation. We have done better in implementing reforms where we have set international minimum standards, but allowed national regulators a degree of discretion to tailor the nature and timing of local requirements to local circumstances. A corollary of this is that we have tended to do better in implementing reforms that relate to financial firms than we have for reforms that relate to financial markets.

Some countries have gone faster and some slower on Basel III, some have introduced the minimum requirements and some have seen fit to do more, some have had to tailor the new requirements to fit with domestic legislative requirements, but generally speaking the new set of minimum standards have been implemented fairly uniformly around the globe (including by countries that are not members of the Basel Committee). The community of national regulators has been able to do this largely because there is scope, given their status as minimum international standards applying to individual firms, for a degree of domestic discretion. There are, if you like, safety values that mean domestic needs can be accommodated while at the same time preserving a common internationally‑agreed minimum. And, because they are applied to individual firms, the externalities that are imposed on other jurisdictions by any variations in implementation are fairly limited – provided, of course, the minimum standards are met.

Progress has been more difficult in areas where a much higher degree of cooperation or consistency is needed. International aspects of recovery and resolution planning, for example, are far less advanced than domestic aspects. It is even more evident when we look at many of the market-based standards. Today’s financial markets are global (or at very least highly inter-connected), and cannot work efficiently if they are subject to regulations that vary widely from jurisdiction to jurisdiction. In other words, the externalities from inconsistent implementation are much greater. A coherent and consistent regulatory regime – critical to limiting opportunities for arbitrage and the tendency for activity to flow to the weakest regulatory environment – requires us all to look beyond our domestic bases, but this has at times proven difficult.

There is no simple solution to this, beyond a recognition that we need to redouble our efforts towards cooperation for the global good. We cannot get away from the fact we are national regulators, with domestic mandates. Where taxpayer funds are ultimately at risk, it is difficult to expect otherwise. But all is not lost because, in an increasingly inter-connected world, domestic interests and the global common good are often quite well aligned. And we have to remember that we all lose if sound economic activity is significantly impeded.

Before I conclude, I would like to highlight two areas where I think we have not yet done anywhere near enough to address the shortcomings that the financial crisis highlighted.

The first is in the supervision of financial firms. We have done a great deal to strengthen the regulatory framework within which financial firms operate. We cannot, however, hope to achieve financial stability, and resilience in individual firms, with just a rulebook.

Whatever type of football you follow, you would not ask two professional football teams to adjudicate a match by themselves. Even though all the players may know the rulebook very well, their competitive instincts mean that without on-field officials, the temptation to break the rules would likely be too great. Any such a game is likely to quickly degenerate into chaos.

Good match officials are critical to an attractive match. They keep the game flowing, their presence acts as reminder to players to play within the rules, and they will sometimes be able to head off infringements before they occur. When needed, they will ensure transgressions are detected and penalised. Good supervisors play a similar role in the financial system – the game is better for the participants and the spectators when high quality officials are monitoring the play.

I do not think we have yet invested enough in promoting good supervision. Indeed, the immediate post-crisis period seemed to start with a philosophy that we should have less supervision and more rules. The strengthened rules were absolutely essential, but they will not be effective in the long run without being supplemented by strong and robust supervision. Our approach is Australia is not to consider supervisors as a means of enforcing regulation, but rather regulation as a means of empowering good supervision. But this philosophy is not universally held, and I think the system is weaker for it.

The second area that we still have room to make serious improvement is in the inter-related areas of governance, culture and remuneration. Building up capital and liquidity, and ensuring loss absorbing capacity in the event of failure, will undoubtedly make for a more resilient financial system. But they will only offer a partial remedy to the problems that were experienced unless there are behavioural changes within financial firms as well.

Culture is a nebulous concept, much more difficult to define and observe than capital adequacy. But strengthening culture, like strengthening capital, is critical to long-run stability. We regularly see instances where participants in financial markets, when faced with an ethical dilemma, fail to ask themselves ‘is this right?’  Instead, the question has often been ‘can I get away with this?’ – or, more ominously, in some cases it appears no question was asked because the attitude was ‘if you ain’t cheating, you ain’t trying’.  For an industry that is ultimately founded on trust, something serious is amiss, and strong and ethical leadership within financial firms is needed to set this right.

Both the industry, and the community of supervisors, is still grappling with how best to make assessments of organisational culture, and how to respond when a culture is shown to be in need of improvement. Much has to do with the incentives that individuals face and how they signal what an organisation truly values (and what it does not). It is clear that, in many cases, aspirational statements of organisational culture have been no match for the personal incentives that are created for individuals. Much of the post-crisis reform agenda has been aimed at getting the organisational interests of financial firms more aligned with those of the wider community. Getting personal incentives correspondingly aligned with organisational interests needs to be seen as equally important. On this, we all have more to do.

UK Funding For Lending Data Q1 2015 Released

The Bank of England has today published data on the use of the Funding for Lending Scheme (FLS) showing, for each group participating in the FLS Extension, the net quarterly flow of lending to UK small and medium-sized enterprises (SMEs) and non-bank credit providers (NBCPs), and the amount borrowed from the Bank in the first quarter of 2015.

The Bank has today published data on the use of the Funding for Lending Scheme (FLS) showing, for each group participating in the FLS Extension, the net quarterly flow of lending to UK small and medium-sized enterprises (SMEs) and non-bank credit providers (NBCPs), and the amount borrowed from the Bank in the first quarter of 2015.

During the first quarter of 2015, the number of groups participating in the FLS Extension was 34. Of these, 10 participants made drawdowns of £3.1bn in total. Participants also repaid £1.5bn, taking total outstanding drawings to £57.3bn.

Net lending by FLS Extension participants to SMEs was £0.6bn in the first quarter of 2015. This compares with quarterly net lending to SMEs in 2014 Q4 by FLS participants of -£0.8bn, while the quarterly average for 2014 was -£0.5bn

Quarterly net lending to SMEs and NBCPs by FLS Extension participants

FLS Q1 2015 chart1
FLS Q1 2015 chart1
Source: Bank of England.  (a)  For more details of the sector definitions within FLS see the Market Notice.  (b)  Note that the number of groups participating in the FLS Extension fell to 34 in 2015 Q1, from 38 at end-2014.

A number of institutions expanded their lending in 2015 Q1 and further borrowing allowances of £4.9bn have been generated, spread across 16 participants.

Aggregate net lending to SMEs (i.e. including lending by banks and building societies not participating in the FLS) was also positive in 2015 Q1. This is part of a broader improvement in lending to all non-financial businesses, as discussed in the May 2015 Inflation Report.3

Over the past few years, credit conditions have improved for SMEs. This has continued in 2015. According to the FSB Voice of Small Business Index, availability of credit to small businesses has risen in 2015 Q1. And in the Bank’s 2015 Q1 Credit Conditions Survey (CCS), lenders reported that spreads over reference rates for medium-sized companies fell significantly over the quarter. The CCS also reported that spreads were broadly unchanged for smaller companies however, while the Bank’s network of Agents report that some small companies continued to find it difficult to borrow from banks.4

The improvement in corporate credit conditions in part reflects the significant fall in bank funding costs that has occurred since the launch of the FLS. Over the first quarter of 2015, the level of funding costs remained low. The FLS Extension will continue to support lending to SMEs in 2015.

 UK banks’ indicative longer-term funding spreads

chart2flsq115

Sources: Bank of England, Bloomberg, Markit Group Limited and Bank calculations.  (a)  Constant-maturity unweighted average of secondary market spreads to swaps for the major UK lenders’ five-year euro senior unsecured bonds, or, where not available, a suitable proxy. (b)  Unweighted average of the five-year senior CDS premia for the major UK lenders. (c)    Sterling only, average of two and three-year spreads on retail bonds. Spreads over relevant end-month swap rates. Constant-maturity unweighted average of secondary market spreads to swaps for the major UK lenders’ five-year  euro-denominated covered bonds, or, where not available, a suitable proxy.

Re-balancing Unbalanced

Data from the ABS yesterday and today together sum up the problem with the Australian economy. Yesterday we got the latest construction data showing that mining was dropping, and construction, especially residential construction, was up, but not enough to compensate, so the overall trend is a fall in activity. The trend estimate for total construction work done fell 1.8% in the March quarter 2015. The trend estimate for non-residential building work done rose 0.2%, while residential building work rose 3.1%. The trend estimate for engineering work done fell 4.7% in the March quarter.

ConstructionMarch2015Today we got data on private sector capex. The trend volume estimate for total new capital expenditure fell 2.3% in the March quarter 2015, the trend volume estimate for buildings and structures fell 3.7% in the March quarter 2015 and the trend volume estimate for equipment, plant and machinery rose 0.7% in the March quarter 2015. Forward looking capital expenditure (a dodgy data set by definition) shows the same trend, mining falling away quicker then other part of the economy, including construction and manufacturing not filling the gap, so net trend is down.

ExpenditeMarch2015 The painful process of re balancing away from mining is unbalanced, and we do not think the gap will be closed by a combination of residential construction, and household spending. Further rate cuts won’t do much more to assist either. It is time for a concerted look at how to drive business harder, to make productive investments in future growth. This should be a time to drive public sector construction programmes harder. Otherwise, GDP will be weaker into 2017 than the budget base case suggests.