Managed Funds Up By 5% To $2.6 Trillion At March 2015

The ABS data today shows further substantial growth in managed funds. At 31 March 2015, the managed funds industry had $2,618.7b funds under management, an increase of $114.2b (5%) on the December quarter 2014 figure of $2,504.5b.

The main valuation effects that occurred during the March quarter 2015 were as follows: the S&P/ASX 200 increased 8.9%; the price of foreign shares, as represented by the MSCI World Index excluding Australia, increased 1.8%; and the A$ depreciated 6.9% against the US$.

At 31 March 2015, the consolidated assets of managed funds institutions were $2,073.0b, an increase of $100.3b (5%) on the December quarter 2014 figure of $1,972.7b.

ManagedFundsTrendsMar2015 
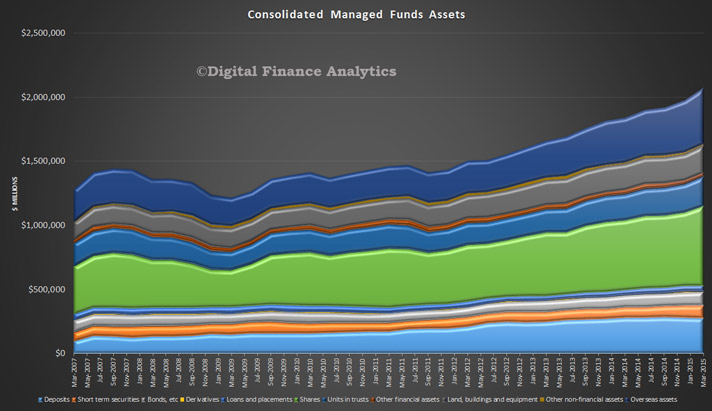
The asset types that increased were shares, $45.8b (8%); overseas assets, $34.2b (8%); units in trusts, $10.8b (5%); other financial assets, $3.4b (13%); short term securities, $3.3b (4%); bonds, etc., $2.9b (3%); land, buildings and equipment, $2.7b (1%); loans and placements, $0.9b (2%); and derivatives, $0.7b (34%). These were partially offset by decreases in deposits, $4.3b (2%); and other non-financial assets, $0.1b (1%). The chart below shows the unconsolidated mix at end March 2015.

ManagedFundsSplitsMar2015
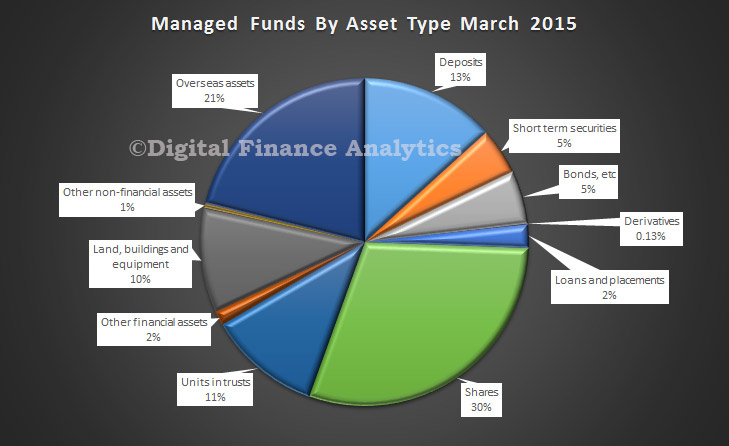
At 31 March 2015, there were $536.7b of assets cross invested between managed funds institutions. At 31 March 2015, the unconsolidated assets of superannuation (pension) funds increased $106.2b (6%), life insurance corporations increased $14.3b (5%), public offer (retail) unit trusts increased $8.9b (3%), cash management trusts increased $1.4b (6%), friendly societies increased $0.2b (2%), and common funds increased $0.1b (1%).

RBNZ Still Looking For Low Inflation Key

A paper from the Reserve Bank of NZ entitled “Can global economic conditions explain low New Zealand inflation?” by Adam Richardson, was published today.

While international economic factors help explain the vast majority of why inflation in New Zealand is currently low, they do not shed additional light on the small portion of low inflation that is difficult to explain. Instead, domestic specific factors likely help account for the unexplained component of CPI inflation and this is a current focus of internal research at the Bank.

Inflationary pressure in New Zealand has been persistently low since the onset of the global financial crisis. This can be seen in the New Zealand economy in two major ways. First of all, the Official Cash Rate has remained low in New Zealand for a number of years, currently sitting at 3.50 percent. Interest rates have remained low in order to support growth and keep the outlook for future inflation consistent with the target mid-point.

Second, the weak inflationary environment can be seen in inflation itself. Since 2012, core consumers’ price index (CPI) inflation has averaged 1.4 percent – within the Bank’s target range, but below the 2 percent mid-point.

Even when accounting for developments in the international economic environment and New Zealand’s own economic conditions, inflation in New Zealand is a little weaker than the Bank’s usual modelling frameworks would suggest. That is, with the benefit of hindsight, there remains a portion of current low inflation outturns that is difficult to account for.

Overall, this unexplained portion of current low inflation is modest, in comparison to the usual level of uncertainty and the contribution international economic factors have made to current low inflation. However, it is important for the Bank to investigate potential explanations, so we can make fully informed policy decisions.

Note: The Analytical Note series encompasses a range of types of background papers prepared by Reserve Bank staff. Unless otherwise stated, views expressed are those of the authors, and do not necessarily represent the views of the Reserve Bank.


China’s Growth: Can Goldilocks Outgrow Bears? – IMF Paper

The latest IMF working paper analyses the recent growth dynamics in China, evaluating both cyclical positions and long-term growth prospects. The analysis shows that financial cycles play a more important role than traditional inflation-based cycles in shaping the dynamics of growth.

China’s impressive growth record speaks for itself, and the country’s policymakers have won additional accolades for the timely response to the Global Financial Crisis. The Chinese GDP has been growing at the average rate of nearly 10 percent per year in the past four decades. The well-timed policy relaxation supported growth in the immediate aftermath of the crisis. Several analysts pronounced the arrival of a goldilocks economy in China—not too hot to fuel inflation and not too cold to slip into recession —and some see a continuation of the stable economic growth as the most likely scenario for China.

A key question is how much of China’s slowdown is temporary (cyclical) versus long lasting (structural). Growth fluctuations in developing and emerging markets often follow a pattern of spans of impressive growth followed by long periods of stagnation. The concern is therefore not only about a cyclical growth slowdown typically experienced by mature economies, but a prolonged slump so often experienced in emerging markets. These fears are also fed by the observation that structural ‘imbalances’ in the Chinese economy—exceptionally high investment rates associated by some with ‘forced savings’ —have further grown since the GFC, reducing investment efficiency and total factor productivity (TFP) growth.

Headline growth in China has slowed from the pre-GFC peak of 14 percent to less than 8 percent in 2013. China benefitted from the pre-crisis global expansion, but its export-based model suffered a blow when global demand collapsed. At the same time, the authorities embarked on a massive credit-cum-investment stimulus, which cushioned the impact of the global slowdown.

China-GrowthThe paper simulates theoretical convergence growth paths by substituting China’s data to two versions of the estimated model. The actual growth path for China is significantly above the convergence path simulated from the full model (‘low convergence path’) and is oscillating around the Asian Tigers’ path (‘high-convergence path’) since the dismantling of the strict central-planning system in 1979.

In summary, the paper contributes to the ongoing growth debate by identifying the cyclical position and assessing the degree of potential output slowdown in China. The main results are:

  1. Expect growth to slow down in the near-term. Financial cycles in China play a significant role in shaping growth dynamics, and the economy is now likely near the peak of a powerful cycle propelling the economy since the GFC. An adjustment is therefore both likely and needed to bring the economy closer to equilibrium.
  2. Potential growth is slowing. This is expected as China makes progress on the long journey of converging to advanced economy income levels. As it moves closer to this technology frontier, growth will continue to slow. However, the pace of convergence, and thus China’s medium-term growth rate, will depend on structural reforms. With success in implementing reforms, China can follow the historical experience of other fast-growing Asian economies.

Currently, the ‘finance-neutral’ gap—a measure of the financial cycle—is large and positive, reflecting imbalances accumulated in the economy since the Global Financial Crisis. A period of slower growth is therefore both likely and needed in the near term to restore the economy to equilibrium. In the medium term, growth will slow as China moves closer to the technology frontier, but a steadfast implementation of reforms can ensure that China follows the path of the “Asia Tigers” and achieves successful convergence to high-income status.

Note The views expressed in this Working Paper are those of the author(s) and do not necessarily represent those of the IMF or IMF policy. Working Papers describe research in progress by the author(s) and are published to elicit comments and to further debate.

Economic Well-Being of U.S. Households – Fed Survey

The Federal Reserve Board’s latest survey of the financial and economic conditions of American households released Wednesday finds that individuals’ overall perceptions of financial well-being improved modestly between 2013 and 2014 but their optimism about future financial prospects increased significantly.

The 2014 Survey of Household Economics and Decisionmaking, provides new insight into Americans’ economic security, housing and living arrangements, banking and credit access, education and student loan debt, savings behavior, and retirement preparedness. Sixty-five percent of adult respondents consider their families to be either “doing okay” or “living comfortably” financially–an increase of 3 percentage points from the 2013 survey.

Looking forward, households are increasingly optimistic. Twenty-nine percent of survey respondents say they expect their income to be higher in the year following the survey, compared to 21 percent of 2013 respondents.

The survey results reveal a lack of economic preparedness among many adults. Only 53 percent of respondents indicate that they could cover a hypothetical emergency expense costing $400 without selling something or borrowing money. Thirty-one percent of respondents report going without some form of medical care in the past year because they could not afford it.

The outlook for the housing market among surveyed homeowners remained generally positive, as 43 percent believe that their house increased in value over the past year and 39 percent expect home values in their neighborhood to rise in the coming year. Many renters also express an interest in buying but report financial barriers to homeownership, with half of all renters listing an inability to afford a down payment as a reason why they rent rather than own and 31 percent citing an inability to qualify for a mortgage as a reason for renting.

Twenty-three percent of the adult population has some form of education debt, according to the survey. However, this debt is not exclusively student loans. Fourteen percent of those with education debt say that some of that debt is on credit cards. Individuals who did not complete an associate or bachelor’s degree, first generation students, blacks and Hispanics, and those who attended for-profit institutions, are all disproportionately likely to be behind on repaying their student loan debt.

Recognizing the importance of degree completion to many outcomes, the survey explores why some individuals leave college without a degree. Family responsibilities is the most common reason, and was cited by 38 percent of all respondents who dropped out and by just less than half of women younger than 45.

The survey results also suggest that many individuals are not adequately prepared for retirement. Thirty-one percent of non-retirees have no retirement savings or pension, including nearly a quarter of those older than 45. Even among individuals who are saving, fewer than half of adults with self-directed retirement savings are mostly or very confident in their ability to make the right investment decisions when managing their retirement savings.

Consistent with a lack of preparedness for retirement, 38 percent of non-retired respondents say that they either do not plan to retire or plan to keep working as long as possible. Among lower-income respondents, whose household income is less than $40,000 per year, 55 percent plan to keep working as long as possible or never plan to retire.

The survey was conducted on behalf of the Board in October and November 2014. More than 5,800 respondents completed the survey. The report summarizing the survey’s key findings may be found at: http://www.federalreserve.gov/communitydev/shed.htm

Bank Capital And Liquidity

Philip Lowe, RBA Deputy Governor gave a speech entitled “The Transformation in Maturity Transformation“. He provided a useful summary of the current picture of bank funding. Banks capital has been increasing, as part of this global trend to higher and better quality capital, with an increase in common equity lifting the aggregate capital ratio from around 10½ per cent prior to the crisis to around 12½ per cent at end 2014. The recent capital announcements by some of the large banks will see this ratio rise further.

http://www.rba.gov.au/speeches/2015/images/sp-dg-2015-05-27-graph2.gif

In terms of liquidity management he discussed two main initiatives.

The first is the introduction of a Liquidity Coverage Ratio (LCR) which, from the start of this year, has required banks to hold enough high-quality liquid assets to meet a stress scenario that lasts for 30 days. The challenge for the Australian banking system has been that the supply of such assets is limited due to the stock of government bonds on issue being small relative to the overall size of the financial system. To overcome this challenge, the RBA has provided banks with a Committed Liquidity Facility (CLF) under which it will make available sufficient liquidity (against eligible collateral) to address the shortfall in required holdings of high-quality liquid assets. The pricing of the CLF is aimed at replicating the cost of holding a sufficient volume of these assets, were they to be available in the marketplace. APRA administers the decisions as to which banks access the program, and the maximum amount available to each bank.

The second initiative is the Net Stable Funding Ratio (NSFR), which has a longer-term focus. It will establish a minimum amount of stable funding based on the liquidity characteristics of an institution’s assets and activities over a one-year horizon. The new requirement here will not come into effect until January 2018.

This increased focus on liquidity is clearly evident in the balance sheets of the Australian banks. On the assets side, holdings of liquid assets have increased substantially, after they declined for many years. Australian dollar denominated liquid assets are now equivalent to about 7 per cent of banks’ total assets, up from around 1 per cent in early 2008. If the CLF is added in, the current figure is around 15 per cent.

http://www.rba.gov.au/speeches/2015/images/sp-dg-2015-05-27-graph3.gif

There have also been significant changes on the liabilities side of the balance sheet.  The most noticeable has been a shift away from short-term wholesale debt towards deposits. In early 2008, deposits accounted for around 40 per cent of the Australian banks’ total funding. Today, that figure is just a little below 60 per cent. In part, this switch has been driven by the judgement that the risk of a run by depositors is less than the risk of a run by investors in short-term wholesale debt. To the extent that this judgement is correct, this switch has increased the effective maturity of banks’ liabilities in a stress event, even if it has not increased the contractual maturity.

http://www.rba.gov.au/speeches/2015/images/sp-dg-2015-05-27-graph4.gif

There has also been some lengthening in the average contractual maturity of the various types of liabilities. The share of deposits at the major banks with a maturity of less than three months has declined since 2007, although this share has increased a little more recently as competition for term deposits has waned. Similarly, there has been a noticeable increase in the maturity of banks’ other debt liabilities since 2007. Of particular note, the share of other debt liabilities with maturities of less than three months has declined substantially.

http://www.rba.gov.au/speeches/2015/images/sp-dg-2015-05-27-graph5.gif

He made that point that taken as a whole, these measures have made the system more resilient. But they have increased the cost of financial intermediation somewhat. They have also increased the likelihood that such intermediation will take place outside the banking sector. After all, to some extent this is what was intended. So we need to keep a close eye on how the overall system responds and make sure that in addressing the very real risks associated with maturity transformation, that we don’t create a new set of risks. This is likely to be an ongoing challenge for us all.

It is also important to point out that while the various measures have made the system more resilient, they do not guarantee stability.  Because of the very nature of the business that banks undertake, they can still find themselves in a liquidity crisis. Here the role of the central bank acting as a lender of last resort is critically important.

Effects of Income, Fiscal Policy, and Wealth on Private Consumption

An IMF working paper discusses an important issue, relating to what should have been the appropriate fiscal policy in the aftermath of the global financial crisis is very much open. There is considerable controversy over the impact of fiscal consolidation on economic activity and on why sluggish economic growth persists across many advanced economies several years after the onset of the financial crisis.

This paper looks at private consumption because, on average across countries, it is the component of GDP that accounts for the largest proportion of the overall changes to real GDP. Using econometric modelling the paper looks at the possible effects of fiscal policy on private consumption, but also explore the negative wealth effects stemming from the collapse of housing and financial assets in the context of high household debt. They argue that wealth effects played an important role weighing down consumption growth, suggesting that the effect of fiscal policy on economic activity may be overestimated if such factors are overlooked.

Two interesting data sets relating to the relative position of Australia and other countries in the analysis which shows the relative significance of private consumption in Australia since 2003. In the context of slowing income growth and very high household debt levels today, we cannot expect households to create significant GDP momentum in the next few years. Yet we have been very reliant on this for some time. In essence we have a structural economic problem.

IMF-Consumption-2 IMF-Consumption-1More generally they find that consumption is impacted by wealth effects, in addition to fiscal policy. They find a significant long-term relation between consumption and the different components of income and wealth. Labor income remains the main driver of consumption. Personal income taxes and social security contributions are found to have a negative impact on consumption, while social benefits are found to have a larger positive impact. Financial assets and housing assets are found to have a positive coefficient, while household debt is found to have a negative coefficient. Furthermore, the results suggest that the contribution to consumption from an increase in financial or housing assets would be more than offset if financed fully through in increase in household debt.

Note that IMF Working Papers describe research in progress by the author(s) and are published to elicit comments and to encourage debate. The views expressed in IMF Working Papers are those of the author(s) and do not necessarily represent the views of the IMF, its Executive Board, or IMF management.

The Fed and the Global Economy

Stanley Fischer, Vice Chairman, Board of Governors of the Federal Reserve System gave a speech entitled “The Federal Reserve and the Global Economy“. He discusses aspects of our global connectedness,  spillovers from the United States to foreign economies and the effect of foreign economies on the United States.

In a progressively integrating world economy and financial system, a central bank cannot ignore developments beyond its country’s borders, and the Fed is no exception. This is true even though the Fed’s statutory objectives are defined as specific goals for the U.S. economy. In particular, the Federal Reserve’s objectives are given by its dual mandate to pursue maximum sustainable employment and price stability, and our policy decisions are targeted to achieve these dual objectives. Hence, at first blush, it may seem that there is little need for Fed policymakers to pay attention to developments outside the United States.

But such an inference would be incorrect. The state of the U.S. economy is significantly affected by the state of the world economy. A wide range of foreign shocks affect U.S. domestic spending, production, prices, and financial conditions. To anticipate how these shocks affect the U.S. economy, the Federal Reserve devotes significant resources to monitoring developments in foreign economies, including emerging market economies (EMEs), which account for an increasingly important share of global growth. The most recent available data show 47 percent of total U.S. exports going to EME destinations. And of course, actions taken by the Federal Reserve influence economic conditions abroad. Because these international effects in turn spill back on the evolution of the U.S. economy, we cannot make sensible monetary policy choices without taking them into account.

The Fed’s statutory objectives are defined by its dual mandate to pursue maximum sustainable employment and price stability in the U.S. economy. But the U.S. economy and the economies of the rest of the world have important feedback effects on each other. To make coherent policy choices, we have to take these feedback effects into account. The most important contribution that U.S. policymakers can make to the health of the world economy is to keep our own house in order–and the same goes for all countries. Because the dollar is the primary international currency, we have, in the past, had to take action–particularly in times of global economic crisis–to maintain order in international capital markets, such as the central bank liquidity swap lines extended during the global financial crisis. In that case, we were acting in accordance with our dual mandate, in the interest of the U.S. economy, by taking actions that also benefit the world economy. Going forward, we will continue to be guided by those same principles.

The Future Shape of Banking Regulation

In a speech entitled “The fence and the pendulum“, by Martin Taylor, External Member of the Financial Policy Committee, Bank of England, he discusses the thorny problems of macroprudential policymaking, which very much include the bank capital and too-big-to-fail agenda. It is worth reading in full.

He concludes:

This is a crucial time for the new international order in bank regulation. We are close to agreement on new standards that the industry, in the UK at least, is not too far off meeting. Four years ago that would have seemed a highly desirable outcome but quite an unlikely one. It’s good for our economies, and it will turn out to be good for the financial industry over the next quarter-century. At the same time the emergence – well, they never went away – the increasingly shrill emergence of voices calling for a regulatory softening is both structurally wrong and conjuncturally wrong. It remains the ungrateful job of the supervisors to save the banks from themselves. The shortness of human memory span and the speed with which we forget the ghastly misjudgements of the recent past: these are the enemies, the unresting enemies, alas, of financial stability.

Banking: Australian Banks’ Moves to Curb Residential Investment Lending Are Credit-Positive – Moody’s

In a  brief note, Moody’s acknowledged that the bank’s recent moves to adjust their residential loan criteria could be positive for their credit ratings, but also underscored a number of potential risks in the Australian housing sector including elevated and rising house prices, declining mortgage affordability, and record levels of household indebtedness. As a result, they believe more will need to be done to tackle the risks in the portfolio.

Moody’s says the recent initiatives are credit positive since they reduce the banks’ exposure to a higher-risk loan segment. At the same time, it is likely that further additional steps will be required because the growing imbalances in the Australian housing market pose a longer-term challenge to the Australian banks’ credit profiles, over and above the immediate concerns relating to investment lending.

Therefore they expect the banks first to curtail their exposure to high LTV loans and investment lending further over the coming months; and second, they will gradually improve the quantity and quality of their capital through a combination of upward revisions to mortgage risk weights and capital increases. This is likely to happen over the next 18 months or so.

Westpac’s Revised LMI Arrangements Are Credit Negative for Australian Mortgage Insurers – Moody’s

Moody’s says that according to media reports, last Monday, Westpac Banking Corporation advised its mortgage brokers that it had revised its mortgage insurance arrangements so that effective that day, 18 May, all new Westpac-originated loans with a loan-to-value ratio (LTV) above 90% would be insured with its captive mortgage insurer, Westpac Lenders Mortgage Insurance Limited and reinsured with Arch Capital Group Ltd.

Westpac’s decision to shift its mortgage insurance policies away from domestic third-party lenders’mortgage insurance (LMI) providers is credit negative forGenworth Financial Mortgage Insurance Pty Ltd and QBE Lenders’ Mortgage Insurance Limited. Westpac accounted for around 14% of Genworth Australia’s gross written premium during 2014, and potentially a meaningful, albeit undisclosed, proportion of QBE LMI’s business. At the same time, existing policies will not be affected and the effect o nthe insurers’ net earned premium should only become material beginning in 2016. LMI customer contractual relationships are long term in nature and any further erosion of the customer base, when and if it occurs, remains contingent on market and individual customer developments.

Westpac’s move follows its earlier disclosures and the Genworth Australia announcement in February 2015that Genworth’s contract for the provision of LMI to Westpac was being terminated. Our understanding from Westpac’s disclosures and media reports is that Westpac’s LMI arrangements with QBE LMI have also been affected. Moody’s says that Westpac’s move is indicative of a longer-run trend towards reduced usage of the domestic mortgage insurance product. Australia’s major banks are not currently deriving regulatory capital benefits from using LMI. Similarly, product innovation, such as the use of self-insured low-deposit mortgage products, will affect the need for third-party LMI. Diminished third-party LMI usage elevates the insurers’ risk of losing pricing power and reducing their customer base, putting downward pressure on the firms’ profitability and volumes.