IMF Warns On Housing, Launches New Index

The IMF has launched its Global Housing Watch, a selected set of data highlighting potential pressures in the housing market across countries. “Housing is an essential sector of every country’s economy, but it has also been a source of instability for financial institutions and countries. Understanding the drivers of house price cycles, and how to moderate these cycles, is important for economic stability.In its first release, they warn of high prices, and tensions between central bank policies and broader economic issues”. They argue that housing has been the subject of “benign neglect”.

Here are the initial findings, with Australia highlighted where appropriate.

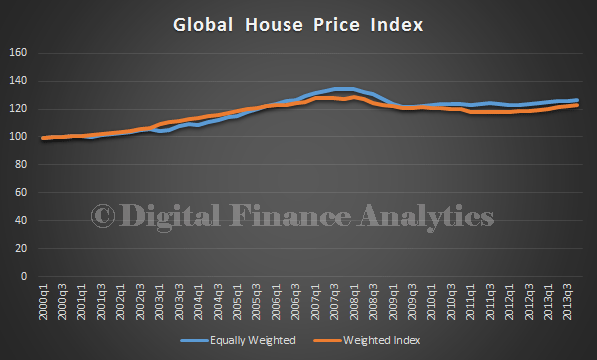
First, the Global House Price Index is a compilation of average housing prices in different countries that tells us if prices are going up globally. The global house price index highlights the fact that after the GFC in 2007, there was only a minor correction, so house prices remain high by historic standards.

IMFJun14-0
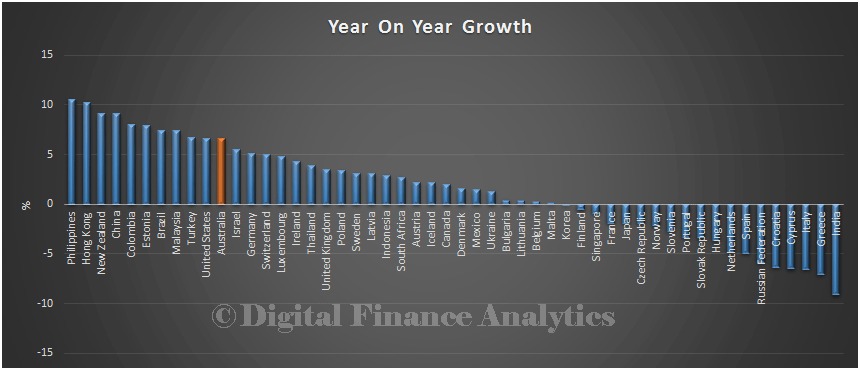
Year on year growth in prices does vary by country, Australia is towards the top of the growth trend, although New Zealand is even higher, and the Philippines is top.

IMFJun14-3
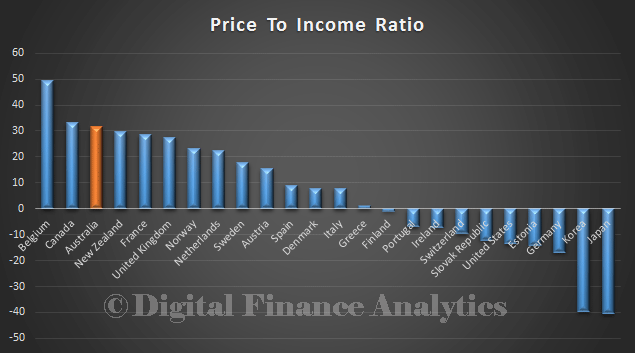
Looking at relative price to income, Australia is on average third highest (they do not split out specific markets in countries). Belgium is the most expensive, Japan the least.

IMFJun14-2
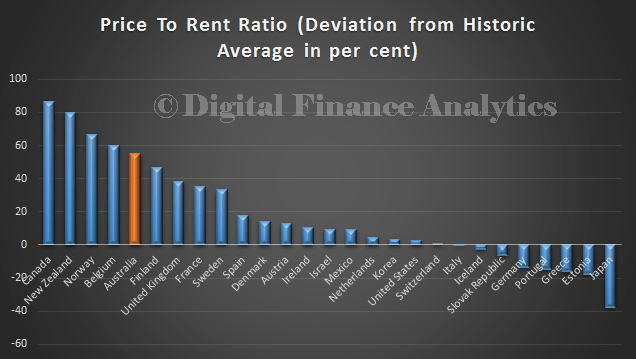
Finally, the ratio of house prices to rent also highlight that Australia is at the high end, behind Canada, New Zealand, Norway and Belgium. Japan is the lowest.

IMFJun14-1They conclude:

We do have a set of policy tools that can help – sometimes these are referred to as “Mip-Map-Mop.” Microprudential (Mip) policies look at an individual bank’s balance sheet, for example to determine if it is making too many real estate loans. But it could be that the individual banks are doing what seems healthy for them, but what the banking system as a whole is doing needs results in an unhealthy growth in lending.

So, in addition, macroprudential regulations (Map), operating at the level of the financial sector as a whole, come into play. The most commonly used measures cap how much individuals may borrow relative to their income. These prudential measures are being increasingly used by countries to prevent an unsustainable build-up in debt.

Finally, there is the monetary policy (Mop) that involves the central bank raising interest rates if they want to cool off the housing sector. This can be tricky, because sometimes the economy is weak but the housing sector is booming, and raising the interest rate can harm the overall economy.

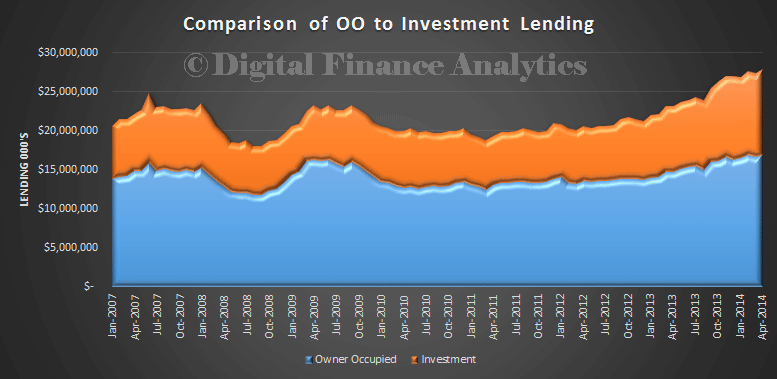
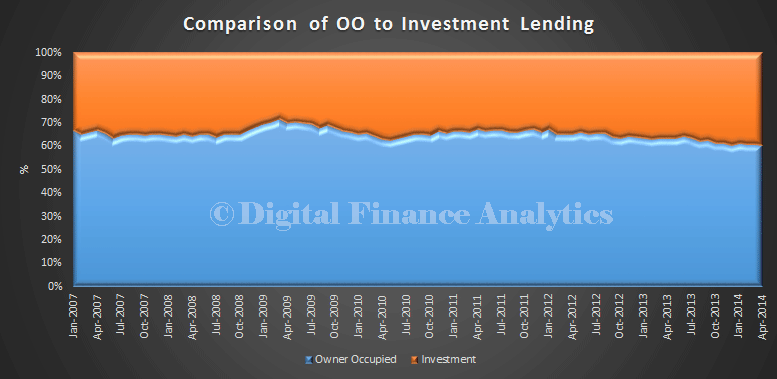
We have argued for some time that Australia need to use macroprudential  policies to help to bring the run-away housing market under control. Focus on investment lending should be first priority. Over emphasis on lending for housing sucks the air from the broader economy and makes it harder for potentially productive businesses to get the lending support they need. Households servicing larger debts have less spending power, which dampens economic activity.

Is Peer To Peer Lending Going Big Time?

On the day, Sarv Girn, the Chief Information Officer at the RBA gave a speech entitled Digital Disruption – Opportunities for Innovation and Growth to the Committee for Economic Development of Australia (CEDA), the AFR reports that Peer-to-peer lender SocietyOne has attracted the interest of James Packer and Lachlan Murdoch, although nothing is signed yet.

This is on top of the  $5 million investment Westpac Banking Corporation equity stake in the business made through its venture capital fund, Reinventure Group. The Australian head of global private equity giant KKR, ­Justin Reizes, has also invested in SocietyOne in a personal capacity.

In a recent article, SocietyOne is said to have made almost 150 loans, totalling $2 million. About 11% of applications are accepted. SocietyOne’s default rate at June 30 was 2.3 per cent. The market place includes auction functionality like ebay to match borrowers and investors.

You can read our recent article on P2P lending here. We included a summary of SocietyOne. Recently SocietyOne introduced a personal loan rate for prime borrowers at more than 5 per cent lower than the major banks. For example, borrowers with excellent credit that translates to a comparison rate of 9.80 per cent per annum which is 5.48 per cent lower than the average personal loan rate from the big four banks.

We think P2P Lending has the potential to be a disruptive force and could change the face of regular banking, quite soon. As the AFR concludes:

Westpac’s interest in SocietyOne was partly driven by a desire to be close to the development of such technology. Investor interest in SocietyOne also illustrates the extent to which banking is fast becoming a technology business. The winds of change may have arrived late to an industry historically defined by high barriers to entry and oligopolistic structures, but they now blow hard.


Investment Loans Break More Records In April

The ABS published their housing finance data for April 2014. It is slightly below expectations, but the most significant element is the further rise in investor lending, which accounted for $10.9bn, or 39.4% of loans written. The highest ever was in December 2013, when Investment loans reached 39.6%.

According to the ABS, the trend estimate for the total value of dwelling finance commitments excluding alterations and additions rose 0.4%. Investment housing commitments rose 0.5% and owner occupied housing commitments rose 0.4%. In seasonally adjusted terms, the total value of dwelling finance commitments excluding alterations and additions rose 1.7%. In trend terms, the number of commitments for owner occupied housing finance rose 0.1%, the number of commitments for the construction of dwellings rose 1.1% and the number of commitments for the purchase of established dwellings rose 0.1%, while the number of commitments for the purchase of new dwellings fell 1.3%.

OO-and-Inv-April-2014

OO-and-Inv-PC-April-2014
In original terms, the number of first home buyer commitments as a percentage of total owner occupied housing finance commitments fell to 12.3% in April 2014 from 12.6% in March 2014. This trend continues to show that first time buyers are unable or unwilling to enter the market. We will be publishing some of our recent survey results soon which will show affordability is the main factor preventing them entering the market.

First-Time-April-2014

Rampant Mortgage Discounting Available, For Some!

We just updated our latest household survey responses, and today I update our findings on mortgage discounting. We last covered bank margins in May, and highlighted the selective discounting in play as funding costs ease. People who do not switch will not be enjoying the best rates. One question in our survey asks new borrowers the discount they achieved from standard rates. We have been maintaining this data for a number of years. We are interested in the discount achieved on average from the standard headline rate. Both the mean discount and range of discounts has been increasing significantly.

First, here is the latest discount data, plotted against the RBA cash rate (the light blue line). We see that the mean average is close to 1% off standard rates. This is a record high. The darker blue line plots the discount achieved.

DiscountJun

What is even more interesting is the spread or range of discounts achieved. Here we chart the low and high mean spreads. We see that the range is wider than its been since before the GFC.

DiscountJun-RangeBanks continue to be selective about the business they want to write, and are offering significant discounts off their standard rates to some customers. Other customers, including most first time buyers are not achieving the same outcome on rates, with significantly lower discounts achieved. We see the highest discounts been offered by some players for investment loans, and other for larger loans, especially at lower LVRs. If your loans has a higher LVR the discount on average is lower.

However, it is clear that the discount achieved partly depends on how firmly prospective borrowers negotiate. Those who don’t ask, won’t get. My message is, in the current low credit growth environment, banks are more than willing to lend. They cannot necessarily relax lending standards to power growth, thanks to the recent broadsides from the RBA and APRA, so they are willing to go out of their way to grab good business, and discounting is the lever of choice. A word of warning to borrowers though, make sure these offers are not just introductory rates, else you might get a rude shock later when the “special” rate morphs back to a higher and uncompetitive normal rate.

Australia’s New Payment Platform (NPP)

Following on from yesterdays discussion about current consumer payment trends, today we will look at the current status of the New Payments Platform. “The proposed centralised infrastructure and real-time nature of the system, combined with the flexibility of payment messaging, ability to carry additional remittance information and the easy addressing capability, will mean that payments can be better integrated with many other aspects of our lives. Businesses should be able to achieve substantial efficiency gains and there will be significant improvements to the timeliness, accessibility and usability of the payments system for consumers” according to Tony Richards, the Head of Payments Policy Department at the Reserve Bank. in his recent speech The Way We Pay: Now and in the Future.

A bit of history first. The current payment infrastructure in Australia is complex, quite old and will not provide the flexibility demanded by new devices and systems. It is supported by a complex web of networks and bilateral charging arrangements, which makes it difficult for new players to enter the payments market, and so protects the current incumbents. In May 2010 the RBA announced a review of the Australian payments systems and how innovation may be improved. It took a medium-term perspective, looking at trends and developments overseas in payment systems and at possible gaps in the Australian payments system that might need to be filled over a time horizon of five to ten years. In June 2012, the conclusions from the review were published. The headline findings reflected the potential gaps in the payments system identified during the course of the Strategic Review.

In the Review, the Payments System Board (PSB) identified a number of gaps in the services currently provided by the payments system. Among these were:

  • the ability for individuals to make electronic payments with real-time funds availability to the recipient
  • the ability to make and receive such payments outside of normal banking hours
  • the ability to address payments in a relatively simple way, such as to an individual’s mobile phone number or email address rather than to their BSB and account number
  • and, most relevant for businesses, the ability to send anything more than a minimal amount of information with an electronic payment.

A key objective was the establishment of a system that would provide real-time retail payments, with real-time funds availability, by the end of 2016. The review recognised that this type of system has been a focus of innovation in a number of other countries. Finally, the bank stated that they believed that a real-time retail payment system would best be delivered by the establishment of a real-time payments hub, rather than a web of bilateral links. It is also prepared to consider helping to facilitate these payments by providing a system for real-time interbank settlement via the Reserve Bank’s RITS system, which currently provides real-time settlement for high-value transactions.

So the New Payment Platform (NPP) was born. An industry steering committee is overseeing development of the NPP. The New Payments Platform Steering Committee first met on 20 June 2013. It comprises senior representatives from the Australian banking and mutual sector, an alternative payments provider and the APCA CEO. An independent Chair, Paul Lahiff, was appointed in September 2013. The Steering Committee appointed KPMG as program manager to the project to ensure a well-resourced, highly collaborative industry program.

The programme participants are:

According to The Australian Payments Clearing Association CEO, Chris Hamilton, these 17 of its 87 members have agreed so far to fund the network, although the costs are not currently known. Lahiff is quoted as saying that NPP will provide “the basic “rail-tracks” on which “overlays” or payments services would be built. “It is minimalist in what it needs to do. It will be constructed as a utility that will be industry owned,” he said. “That allows networking, switching, addressing and settlement. As long as you have an interface to the basic infrastructure, it allows everybody to compete on how they use it most effectively.”

A new utility entity, owned by the payments industry will be created. Tenders were issued earlier in 2014, and responses are being considered at the moment. About 80 people are working on the project. Once the enabling infrastructure in launched, there is the prospect of additional value-added services “overlay services” being offered. Here is the schematic which APCA draws:

npp-full-architecture-diagram

There are a number of issues worth reflecting on.

  1. The banks have considerable investments in the current bilateral systems and processes. Will they need to write off these investments if they migrate to a new platform?
  2. Whilst the establishment of a centralised payment switch is relatively simple (its been done elsewhere), the real challenge is to retrofit the current bank’s systems and processes into the new world. It is well known that some banks have problematic infrastructure, and as a result any migration will be complex and expensive. Banks with batch processing will have issues fitting into a real-time 24/7 world, and may need to create “shadow” real-time proxies such are used for internet banking.
  3. What will the revenue model which will underpin the new infrastructure be?
  4. Will the current 17 members put barriers in the way which means that the new payments infrastructure will be inaccessible by new players and innovators? Will new competitors be locked out?
  5. The intention will be to migrate from sort code and account numbers to a single number used for receiving payments. So should this infrastructure also be considered an a mechanism to establish account number portability. A number of recent submissions to the Federal Government’s financial system inquiry have proposed this.

The NPP has the potential to liberate payments and offer innovation to consumers and businesses. It is essential to evolve payments into a more innovative and open environment, we will see if NPP fits the bill.


Consumer Payment Trends In Australia – Cash Is No Longer King

The RBA released an important report today on The Changing Way We Pay: Trends in Consumer Payments. Their paper contains the results of the third Survey of Consumers’ Use of Payment Methods which was conducted in November 2013. The survey used a diary and end-of-survey questionnaire to collect data on the use of cash, cards and a range of other payment methods, both at the point of sale and via remote channels (online, mail and telephone). They say that 2013 data show that cash and cheque use has continued to fall. The use of cards has risen significantly, and there has also been an increase in the use of PayPal. The growth in the use of cards and the reduction in cash use are evident across households in all age and household income groups. The strong growth in remote payments is one contributor to the observed change in the use of cash and cards. However, the main contribution is from the increased use of cards at the point of sale, which is likely to reflect both growth in the availability of card terminals at merchants and changing consumer preferences as authentication methods have evolved.

In an accompanying speech, The Way We Pay: Now and in the Future, Tony Richards, the Head of Payments Policy Department outlined the main findings from the report. Here are some of the main points. First, lower-value payments were typically made with cash, while card payments became more common for larger payment values and other electronic payments were typically used for only for higher-value payments. Over time, electronic payments have increasingly been used for lower-value payments.

sp-so-040614-graph1 Looking across age groups, cash is used more by older individuals than by younger ones. But the decline in its share of all transactions is evident across respondents in all age-groups. The decline is also fairly broad-based across different types of merchants. It can be partly explained by the fact that the mix of transactions in the economy is gradually shifting from in-person to online, where cash is essentially not used. However, it is mostly a function of the decline in cash use in the traditional point-of-sale environment and the development of newer electronic technologies that can match or surpass the convenience and speed of cash in some types of transactions and transfers.

sp-so-040614-graph2The flip-side to the declining use of cash has obviously been the rise in the use of payment cards for transactions of all sizes. This has been associated with continuing growth in the number of card terminals in Australia (up by around 35 per cent over the six years to 2013), and advances in card technologies and authentication methods. The ongoing shift to the use of PINs in card transactions and the sharp pick-up in the use of contactless payments have both resulted in a reduction in the typical time needed to complete a card transaction.

sp-so-040614-graph3In the latest survey, two-thirds of respondents reported that they had a card with contactless functionality and almost half of these reported a contactless transaction in the week of the study. Contactless transactions accounted for 22 per cent of all face-to-face card transactions. This share was significantly higher for payments under $20

sp-so-040614-graph4The survey shows that there are significant differences in the use of debit and credit cards across demographic groups. Younger households are much more likely to use debit cards than credit cards, presumably reflecting reduced access to credit cards and a preference to ‘use their own money’. Lower income households also use debit more frequently than credit, most likely for similar reasons. However, those in the highest income quartile use their credit card significantly more than their debit card. This may well reflect the greater desire to get reward points associated with credit card use. The survey shows that an individual in the highest income quartile is six times more likely to have a premium credit card than a household in the lowest income quartile.

sp-so-040614-graph5The survey shows a significant decline in the use of cheques. Around 80 percent of respondents reported that they had not written a cheque over the previous year. Cheque use is especially low in younger age groups. However, it is also declining significantly in older age groups. We can expect the decline in the use of cheques to continue as other payment methods became available to meet either the needs of households that currently still prefer to use cheques or the needs of businesses that find there are few alternatives for some specific uses.

The survey also provides evidence on the growth of some relatively new means of making payments or transfers.

  • For example, it shows that PayPal was used for around 3 percent of transactions in 2013, up from around 1 per cent in 2010. This mostly reflects an increase in the share of transactions occurring online and an increase in PayPal’s share of that market.
  • Smartphone payments are an area of strong innovation in the payments system. The survey shows that there is a shift toward making more person-to-person transfers using smartphones, with around 9 per cent of transfers to family and friends made via smartphone. However, the use of smartphones for payments was still low, at less than 1 per cent of consumer payments to businesses. It appears that, for the time being, smartphones are mostly a convenient alternative method of internet access, rather than a means of payment in their own right. This clearly has the potential to change as new near-field communications (NFC) or Bluetooth technologies for point-of-sale smartphone payments emerge.

So overall we see a significant and continued migration away from cash and cheques to cards and electronic payments. This is consistent with our recent research on consumer banking channel preferences, the Quiet Revolution. The UK is further ahead with new mobile payment mechanisms. Next time we will discuss the current initiatives in Australia to migrate payments onto a new payments platform (NPP) by 2016.

Latest DFA/JP Morgan SME Report Launched Today

The latest report, volume 7 of the SME Report series was released today. As well as over-viewing current industry trends, this time we focus on sectoral rotation, with SME’s in the construction industry feeling more confident, whilst other sectors remain patchy. We do not see a significant rise in demand for credit anytime soon.

JPM authored their report using DFA research data as detailed in the DFA SME Report already published and available on request from DFA. Because of compliance issues the final JPM version of the report is only available direct from them.

Go here for more details of our research programmes, and for media requests, go here.

SMEJPM

RBA Holds Rates Again At 2.5%

The RBA have kept rates on hold today, and are indicating a period of rate stability.

“Monetary policy remains accommodative. Interest rates are very low and for some borrowers have edged lower over recent months. Savers continue to look for higher returns in response to low rates on safe instruments. Credit growth has picked up a little. Dwelling prices have increased significantly over the past year, though there have been some signs of a moderation in the pace of increase recently. The earlier decline in the exchange rate is assisting in achieving balanced growth in the economy, but less so than previously as a result of the higher levels over the past few months. The exchange rate remains high by historical standards, particularly given the further decline in commodity prices.

Looking ahead, continued accommodative monetary policy should provide support to demand, and help growth to strengthen over time. Inflation is expected to be consistent with the 2–3 per cent target over the next two years.

In the Board’s judgement, monetary policy is appropriately configured to foster sustainable growth in demand and inflation outcomes consistent with the target. On present indications, the most prudent course is likely to be a period of stability in interest rates.”

April Building Approvals Down – ABS

The ABS released the building approvals data for April 2014. They report that the trend estimate for total dwellings approved fell 1.6% in April and has fallen for four months.  The seasonally adjusted estimate for total dwellings approved fell 5.6% in April and has fallen for three months. Looking at private sector houses, whilst the trend estimate for private sector houses approved rose 0.5% in April and has risen for 16 months, the seasonally adjusted estimate for private sector houses fell 0.3% in April and has fallen for three months. The trend estimate for private sector dwellings excluding houses fell 4.6% in April and has fallen for five months. The seasonally adjusted estimate for private sector dwellings excluding houses fell 14.0% in April and has fallen for three months.

Here is the national seasonally adjusted trend for all units and houses across Australia. Note recent fall in the number of units, and the sustained growth in houses nationally.

BuildApprovals--April14--ALL

The trend estimate of the value of total building approved fell 5.6% in April and has fallen for five months. The value of residential building fell 1.8% and has fallen for four months. The value of non-residential building fell 12.8% and has fallen for five months. The seasonally adjusted estimate of the value of total building approved fell 17.4% in April and has fallen for four months. The value of residential building fell 7.4% and has fallen for two months. The value of non-residential building fell 36.6% and has fallen for four months.

Looking at the state data, we see some interesting variations.

In NSW there was drop last month in unit approvals, having seen run-away growth in the past year. The number of house approvals also fell slightly. But overall, more units and high density housing was approved than houses, reflecting investment demand and affordability issues.

BuildApprovals--April14--NSWIn VIC house approvals is on the rise, and is still outpacing unit approvals.

BuildApprovals--April14--VICIn QLD, unit approvals have fallen away, an house approvals are down slightly.

BuildApprovals--April14--QLDIn SA, house approvals are way ahead of unit approvals, though we see a slight fall in house approvals recently, and a slight rise in units.

BuildApprovals--April14--SAFinally, in WA, we see growth in house approvals in recent months, but a turn down recently. Units are up slightly, but are significantly below housing approvals.

BuildApprovals--April14--WAOverall then, with approvals down, we wonder about momentum in the property market. Maybe the demand supply gap is getting bigger. To meet the demand for property, and to help ease prices, we need greater supply. We estimate that over the next three years we will need more than 900,000 new properties to meet demand

Turning Banking Economics On It’s Head

Once in a while an insight will change the world. In this months Bank of England’s Quarterly Bulletin (2014 Q1), there is an article on money creation, and an primer on money. Actually these were pre-released on 12 March, and both are worth a read.

In the primer on money, we are reminded that it is essentially a trusted IOU and there are three main types, currency, bank deposits and central bank reserves. Each form is really an IOU between one sector of the economy and another. In the modern economy, most money is in the form of bank deposits, which are created by the commercial banks.

Money1You can see a video made by the bank here.

The second article though is revolutionary, in that is has the potential to rewrite economics. “Money Creation in the Modern Economy” turns things on their head, because rather than the normal assumption that money starts with deposits to banks, who lend them on at a turn, they argue that money is created mainly by commercial banks making loans; the demand for deposits follows.

“In the modern economy, most money takes the form of bank deposits. But how those bank deposits are created is often misunderstood: the principal way is through commercial banks making loans. Whenever a bank makes a loan, it simultaneously creates a matching deposit in the borrower’s bank account, thereby creating new money. The reality of how money is created today differs from the description found in some economics textbooks:
• Rather than banks receiving deposits when households save and then lending them out, bank lending creates deposits.
• In normal times, the central bank does not fix the amount of money in circulation, nor is central bank money ‘multiplied up’  into more loans and deposits.
Although commercial banks create money through lending, they cannot do so freely without limit. Banks are limited in how much they can lend if they are to remain profitable in a competitive banking system. Prudential regulation also acts as a constraint on banks’ activities in order to maintain the resilience of the financial system. And the households and companies who receive the money created by new lending may take actions that affect the stock of money — they could quickly ‘destroy’ money by using it to repay their existing debt, for instance. Monetary policy acts as the ultimate limit on money creation. The Bank of England aims to make sure the amount of money creation in the economy is consistent with low and stable inflation. In normal times, the Bank of England implements monetary policy by setting the interest rate on central bank reserves. This then influences a range of interest rates in the economy, including those on bank loans. In exceptional circumstances, when interest rates are at their effective lower bound, money creation and spending in the economy may still be too low to be consistent with the central bank’s monetary policy objectives. One possible response is to undertake a series of asset purchases, or ‘quantitative easing’ (QE). QE is intended to boost the amount of money in the economy directly by purchasing assets, mainly from non-bank financial companies. QE initially increases the amount of bank deposits those companies hold (in place of the assets they sell). Those companies will then wish to rebalance their portfolios of assets by buying higher-yielding assets, raising the price of those assets and stimulating spending in the economy. As a by-product of QE, new central bank reserves are created. But these are not an important part of the transmission mechanism. This article explains how, just as in normal times, these reserves cannot be multiplied into more loans and deposits and how these reserves do not represent ‘free money’ for banks.”

They made a video which explains some of the key concepts.

This could be seen as a self-justification for the years of QE, and low interest rates in the UK, but I think it is really a radical insight. The world of money just changed!