
Stocks are not cheap. Thus, equities are vulnerable to a deep slide in the event profits contract or interest rates undergo a disruptive climb. The latter would probably include an increase by the 10-year Treasury yield to at least 2.75%.
However, for now, benchmark bond yields have moved in a direction opposite to that taken by the federal funds rate. In spite of the December 2016 and March 2017 rate hikes, the 10-year Treasury yield eased from mid-December’s 2.6% to less than 2.4%.
The drop by the 10-year Treasury yield following two Fed rate hikes was in response to reduced expectations for GDP growth that partly stemmed from the diminished likelihood of meaningful fiscal stimulus. The Blue Chip consensus now looks for nominal GDP growth of 4.3% in 2017, which is only a bit above early November 2016’s pre-election forecast of 4.2%. In view of how the 10-year Treasury yield averaged 1.82% during the 10 trading days ending with Election Day, the 10-year Treasury might conceivably dip under 2.25% barring an upwardly revised outlook for nominal GDP.
Next correction of overvaluation will trigger a “flight to quality”
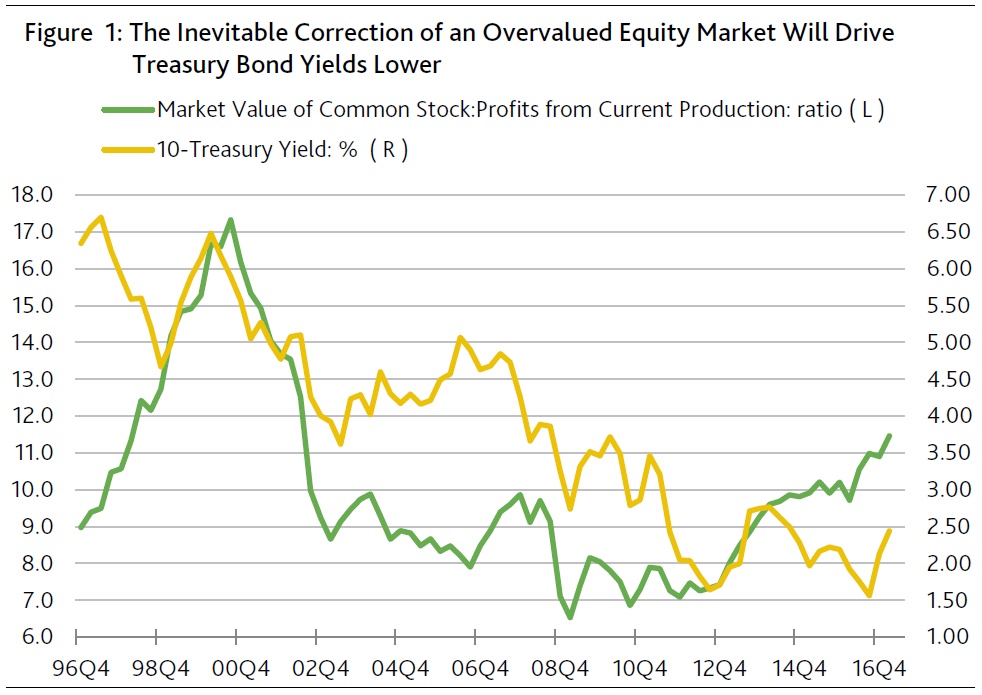
US equities remain untenably overvalued. The market value of US common equity now resides at a multiple of pretax profits from current production that was unheard of prior to 1998. More specifically, the ratio of the market value of US common stock to yearlong pretax operating profits rose to 11.5:1 in Q4-2016, which was the highest such ratio since Q2-2002’s 12.5:1. After averaging 14.8:1 in 1999, common equity’s market value crested at a record 17.3-times profits in Q3-2000. (Figure 1.)
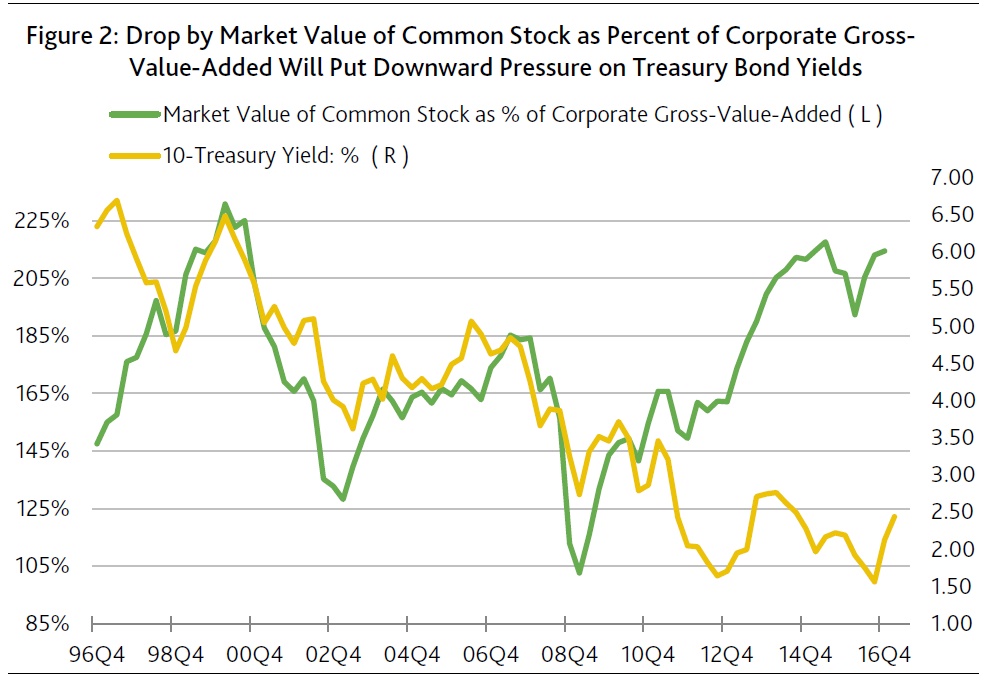
In addition, stocks are richly priced relative to corporate revenues. As of Q2-2015, the market value of US common stock rose to a cycle high of 218% of corporate gross-value-added, where the latter is a proxy for total corporate revenues. Second-quarter 2015’s ratio for the market value of common equity to corporate gross-value-added (GVA) was the highest since the 225% of Q3-2000. Earlier, the market value of equity peaked at a record high 231% of corporate GVA in Q1-2000. During 2002-2007’s business cycle upturn the ratio failed to reach 200% and the market value of common stock crested at 185% of corporate GVA in Q2-2007. After falling to Q1-2016’s 192%, the market value of common stock has since risen to 214% of corporate GVA in Q4-2016. The latter surpasses all ratios prior to Q2-1999’s 215%. (Figure 2.)
Today’s very high valuation of equities vis-a-vis both profits and revenues does not preclude even richer share prices, but it does warn of substantially lower valuations in the event of an adverse shock. Moreover, a deep drop by equity prices will quickly prompt a ballooning of high-yield bond spreads, which currently undercompensate for long-term default risk.
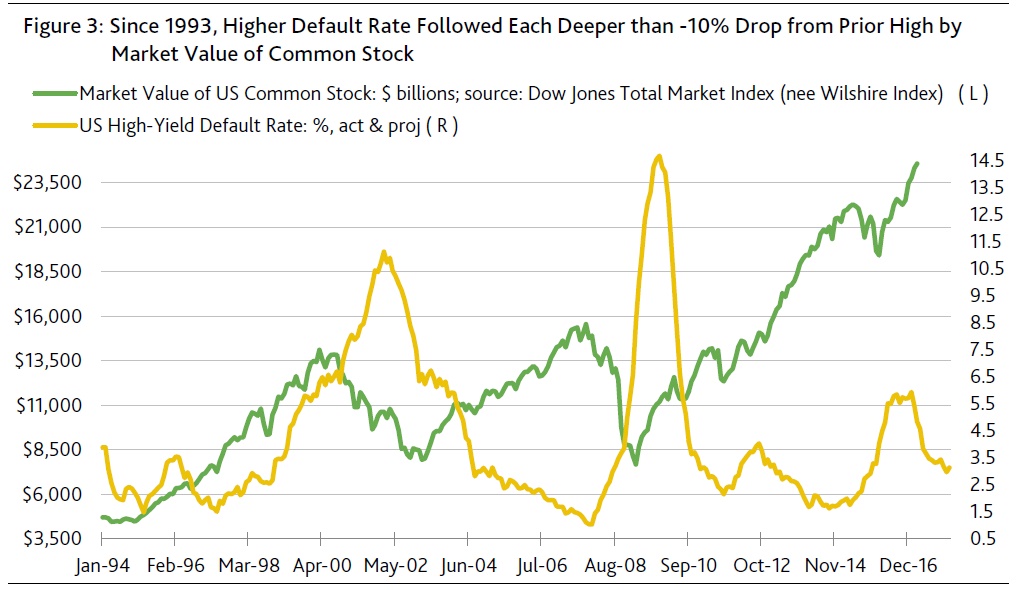
An eventual bursting of the equity bubble will diminish systemic liquidity. In turn, much costlier financial capital will prompt an increase in defaults. No longer will a relaxation of loan covenants, injections of common equity capital, and the liquidation of business assets provide badly needed relief to distressed borrowers. (Figure 3.)
Thus, when the equity bubble bursts, both the federal funds rate and Treasury bond yields will fall. Though unsustainably high benchmark interest rates may precipitate the bursting of an equity bubble, the ensuing deflation of the bubble will drive benchmark rates sharply lower. The bursting of the equity bubbles of 1987 and 1999-2000, the high-yield and commercial real estate bubbles of 1989-1990, and the housing bubble of 2004-2006 were followed by substantially lower benchmark interest rates.
Consensus outlook on rates contradicts fundamentals
Currently, the consensus expects interest rates to rise steadily at least through year-end 2018. The three-month Treasury bill rate is projected to climb from a recent 0.80% to 2.0% by Q4-2018, while the 10-year Treasury is expected to ascend from just under 2.4% to 3.3%. These forecasts implicitly assume that the equity bubble will not burst into 2018’s final quarter. In other words, the consensus senses that the considerable downside risk of an overvalued equity market will not be realized, notwithstanding the projected return of a quarter-long average of more than 3% for the 10-year Treasury yield for the first time since Q2-2011’s 3.21%. The latter proved unsustainable partly because real GDP growth failed to conform to early June 2011’s consensus expectations of 2.6% for 2011 and 3.1% for 2012. Instead, real GDP rose by merely 1.6% in 2011 and 2.2% in 2012.
Not only did the consensus exaggerate business activity’s forthcoming pace, the consensus also extrapolated too much about future inflation from mid-2011’s speeding up of consumer price inflation. Second quarter 2011’s 4.1% annualized surge by PCE price index inflation was the fastest since 2008 and included a 2.5% advance by the core PCE price index. However, by 2011’s final quarter the sequential annualized rate of inflation had eased to 1.4% for the PCE price index and 1.6% for the core PCE price index.
Having badly overstated near-term economic growth and inflation risk, the consensus would grossly overstate the 10-year Treasury yield’s trajectory. As of early June 2011, the consensus had projected a 3.7% average for Q4-2011’s 10-year Treasury yield, which was well above the actual 2.05%. The miss for Q4-2012’s 10-year Treasury yield was even greater, as the actual yield of 1.71% came in well under the predicted 4.4%.
Core consumer goods price deflation will continue
Today’s consensus has yet to fully appreciate the low-inflation implications of a continued stay by consumer goods price deflation excluding energy products. As millions of late model vehicles come off lease during the next several years, a glut of used cars can be expected to put downward pressure on the prices of new vehicles. Moreover, the loss of demand as inferred from Q1-2017’s -1.4% yearly decline by unit sales of light motor vehicles will reinforce the auto industry’s loss of pricing power.
Worse yet, the inability of very attractive sales incentives to boost car purchases materially does not bode well for auto prices. March’s seasonally-adjusted unit sales fell by -5.4% from February despite sales incentives that averaged 10.4% of the sticker price, which was the highest such percentage since 2009 according to JD Power and Dow Jones.
Elsewhere, reports have surfaced telling of a US retailing giant’s intention to pressure an e-commerce behemoth with more aggressive price discounting. And, for the first time in a long while, a leading producer of non-durable consumer goods will cut prices in order to better compete with recent start-ups.
The progression of communication and manufacturing technologies will continue to contain price inflation. Consider how advancements in oil & gas drilling technology have diluted OPEC’s once unrivalled pricing power.
Consensus forecast of interest rates seems too high
Only if US real GDP growth approaches 3% on a recurring basis might the current consensus 10-year Treasury yield forecast of a 2.8% average for 2017’s second half and 3.1% for yearlong 2018 prove correct. Given the problematic outlook for proposed fiscal stimulus, so rapid a rate of economic growth is unlikely. In the event the 10-year Treasury yield somehow approaches 3% absent a sufficient upward revision of the outlook for operating profits, then a likely deflation of the equity bubble would quickly drive the benchmark Treasury yield well under 3%.
Is revenue-neutral fiscal stimulus an oxymoron? Too much may have been made of the stimulatory powers of revenue-neutral fiscal stimulus. In response to the Great Recession of 2008-2009, fiscal stimulus was enacted that was far from revenue-neutral. For example the moving yearlong US federal budget deficit widened from year-end 2007’s -$371 billion (or -2.9% of GDP) to -$1.417 trillion (or -9.7% of GDP.
Nevertheless, real GDP’s reaction to the massive injection of fiscal stimulus was quite muted. Instead of growing by at least 3% to 4% annually, real GDP rose by a mild 2.5% in 2010. Moreover, 2011 saw real GDP growth sag to 1.6%.
What was striking was the inability of economic activity to capitalize more on 2010’s very low rates of resource utilization. For example, 2010’s yearlong averages were 9.6% for the unemployment rate, 16.7% for the U6 underemployment rate, and 73.6% for the rate of industrial capacity utilization. By contrast, February 2017’s rates of 4.7% for unemployment and 9.2% for U6 underemployment.
Whatever fiscal stimulus emerges in late 2017 or 2018 probably will not be enough to assure a 3% annual increase by yearlong real GDP. In turn, the likelihood for higher short- and long-term interest rates is less than the consensus now believes.