Data this week showed the impact of ever higher mortgages, with more households in debt for longer, and thanks to rising property prices, more households cannot get even into the market and are forced to rent. Welcome to this week’s edition of the Property Imperative.
This week we had the first look at the latest Census data, and it was a mixed bag. The Census counted 23.7 million people in Australia on the night. In the last 10 years’ average population has been 1.7% each year, compared with 1.4% in the prior decade. Strong migration is part of the story, with 1.3 million new migrants arriving since 2011, from some 180 countries.
Superficially, households appear to be more wealthy, but in fact the real issue is that there are more and more jobs being created which are not paying enough to live on. One-fifth of households in 2016 recorded a gross income, including all government benefits, of less than $650 a week. Many of these households are left behind by the skyrocketing housing market, stuck in the rut of under-employment, attacked as a drain on the budget or for not paying more tax, seeing their penalty rates cut, or forced to jump through undignified job-seeker hoops.

The census also suggested that housing supply is not the issue many are claiming it to be. The key myth-busting statistic is the average number of people per dwelling, which has not budged an inch in the five years since the last census. It’s staying at 2.6 which is where it was back in 2000 well before the house price boom began. Moreover, the number of unoccupied dwellings grew at 11.3 per cent over five years. That equates to 105,000 more empty dwellings since 2011, whereas the census shows the number of occupied dwellings increased by 6.8 per cent over five years, which is less than population growth over the same period: 8.8 per cent. That said, more households are renting, and more households have larger mortgages.
Other data also showed that rising mortgage debt is affecting everything from employment to spending, as Australians approach retirement. Australians are having to work for longer to pay off their mortgage, indeed many are expecting to take the debt into retirement. In addition, overall, the percentage of home owners aged 25 years or over who are carrying a mortgage debt climbed from 42% to 56% between 1990 and 2013.
More banks hiked investor loans and tightened underwriting standards this week. CBA changed their mortgage rates for owner occupied and investor mortgage holders. This included a significant hike for interest only borrowers, and they already tightened serviceability requirements a couple of weeks ago, whilst Principal and Interest Owner Occupied holders got a 3 basis point reduction! All this has, they say, nothing to do with the bank tax. But it has everything to do with margin repair.
ME Bank lifted the rates for existing and new interest-only mortgages by 40 basis points, or 0.4%, whilst decreasing rates for lower LVR new owner-occupied loans by 10 basis points.
St George announced tighter serviceability requirements when borrowers seek to move to interest only mortgages
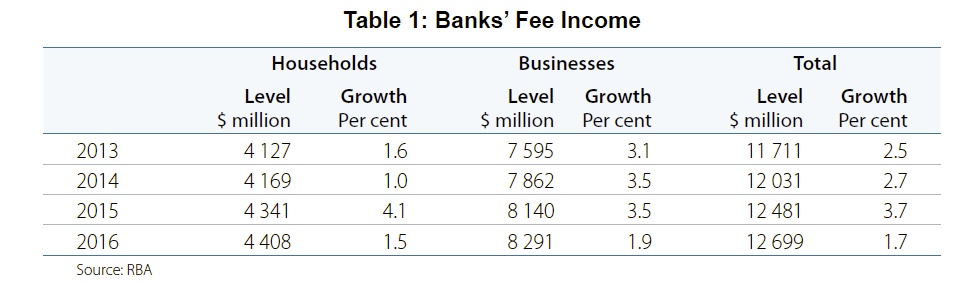
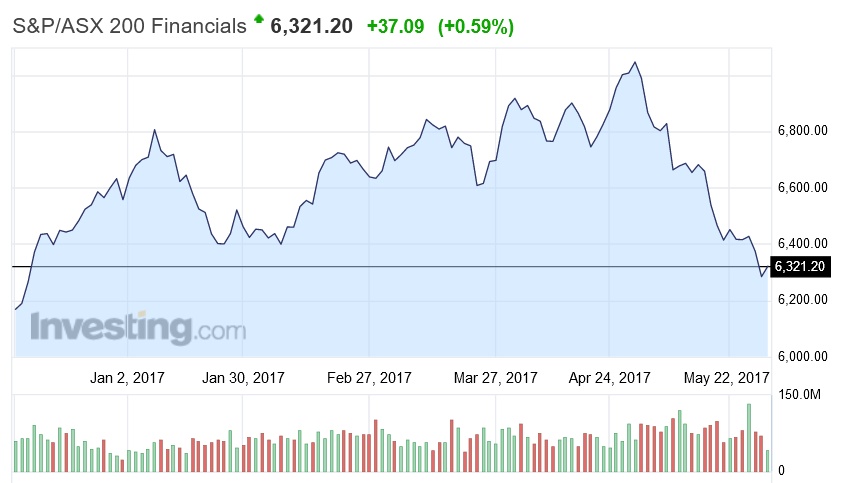
Bank profits will be bolstered thanks to ongoing mortgage growth, and the benefit of the recent mortgage repricing, under the alibi of regulatory pressure.
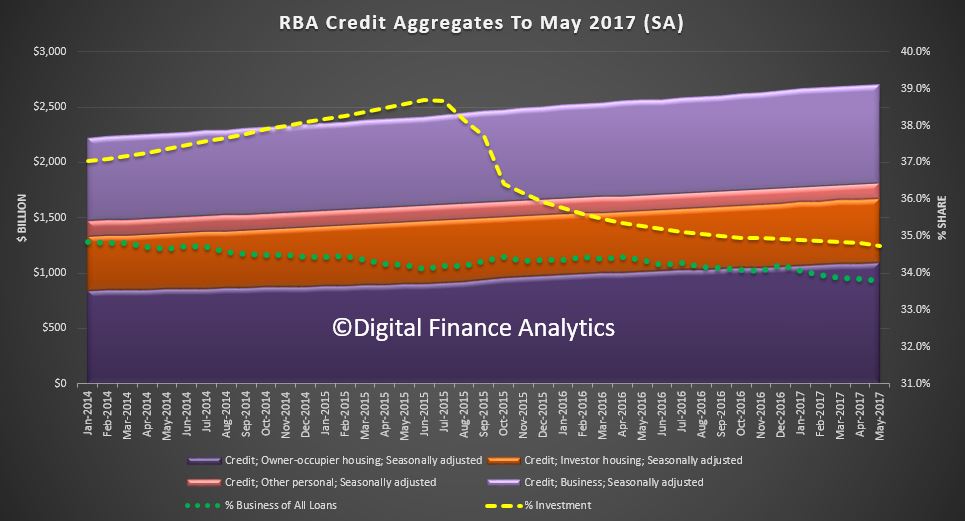
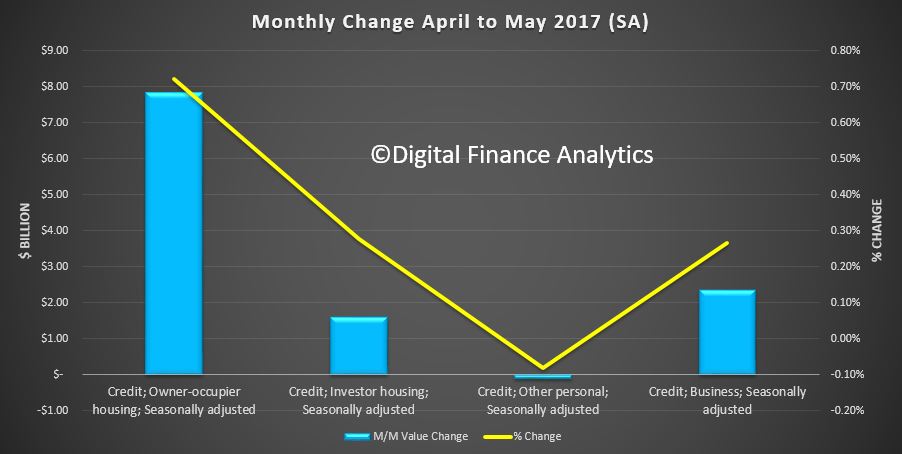
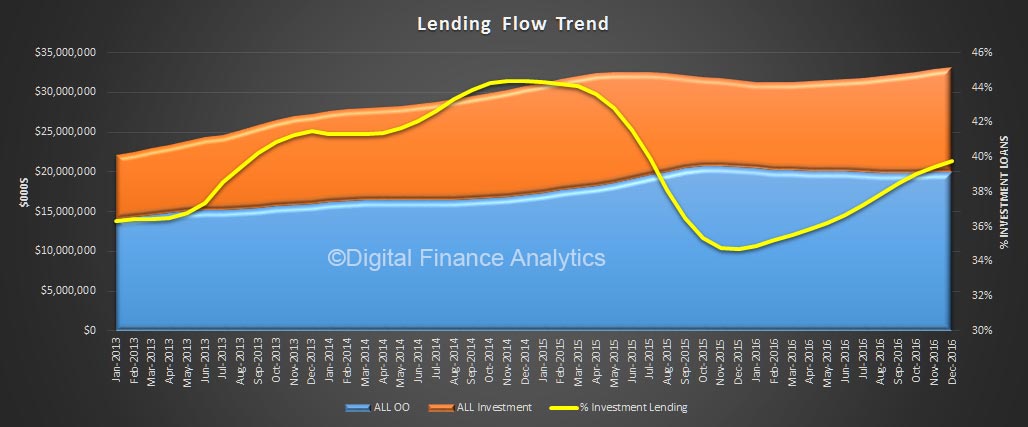
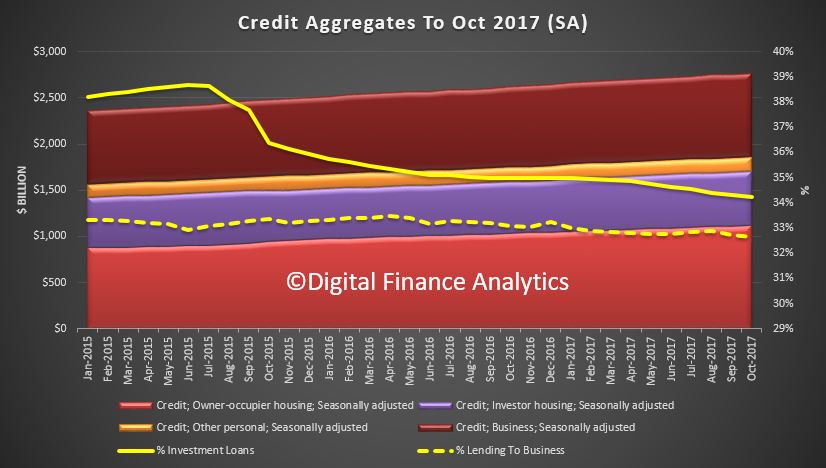
The latest RBA data showed that mortgage lending grew again in May to $1.67 trillion, up 6.6% in the past year, compared with 6.9% a year ago. Owner occupied lending rose $7.8 billion (up 0.72%) and investment lending rose $1.6 billion (up 0.28%), both seasonally adjusted. Surprisingly another $1.4 billion of loans were reclassified in the month between owner occupied and investor, taking total adjustments to an amazing $53 billion. We will probably never know how much of these switches related to legitimate changes of use, and how much is because of poor bank data or borrowers seeking out routes to cheaper loans.
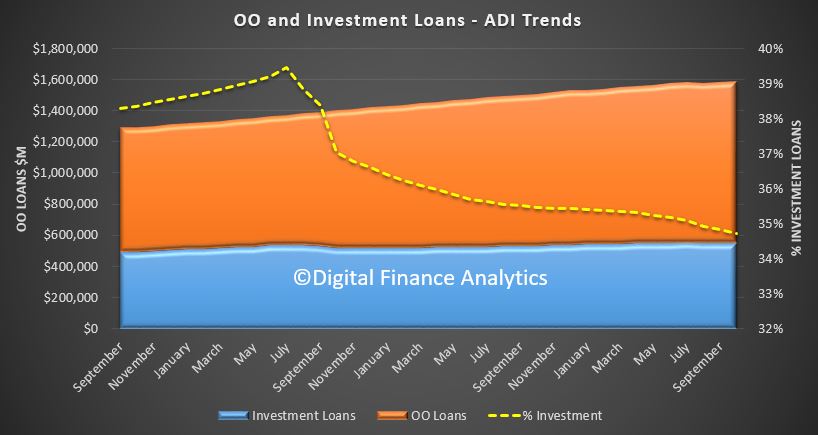
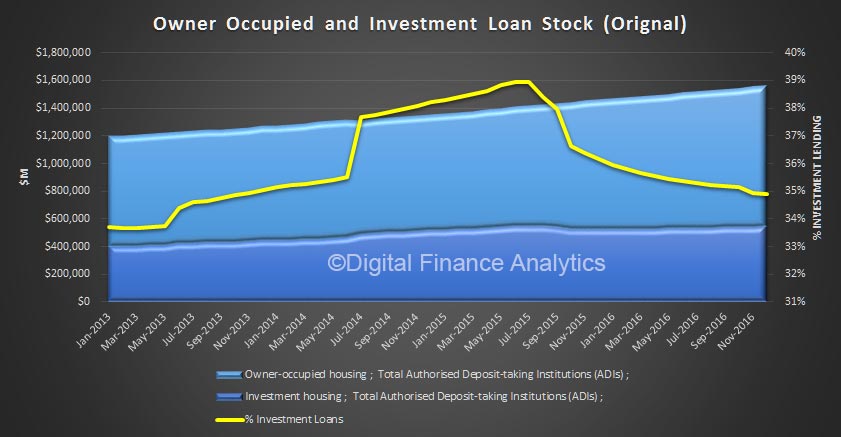
The APRA data, which covers just the banks, also showed a rise in the value of their mortgage books, up $9.2 billion to $1.56 trillion. Within this, owner occupied loans grew 0.7% to $1,010 billion and investment loans grew 0.42% to $550 billion (higher than the 0.39% last month). The proportion of loans for investment purposes stands at 35.4% on a portfolio basis. In fact, overall mortgage growth is accelerating – so much for the regulatory pressure to slow lending.
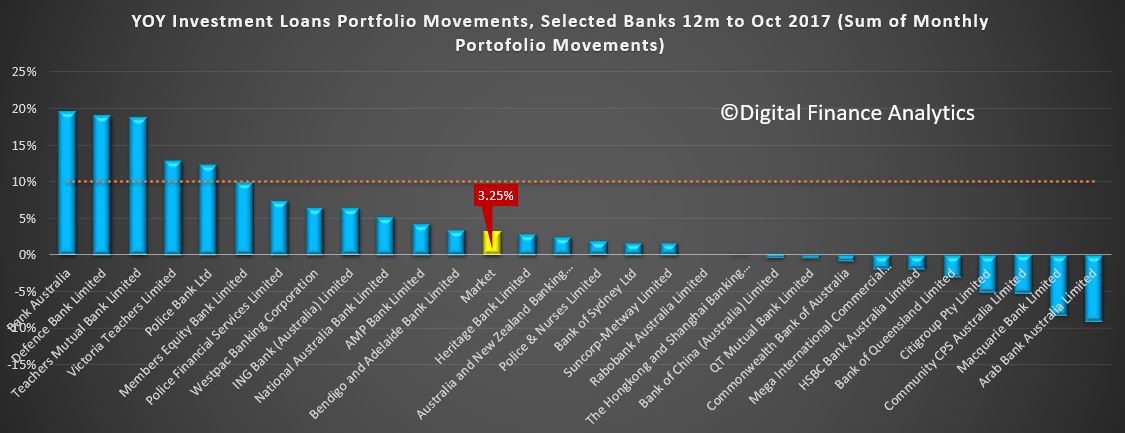
It is also worth noting that some lenders are still well above the 10% speed limit for investor loans. We think further steps need to be taken to cool the mortgage market – too much debt is being loaded on to households in a rising interest rate, low/no income growth environment. This also suggests home prices will continue to rise, after recent slowing trends were reported. We saw quite good auction clearances last week, and after a dip, home prices might indeed be on the up again.
The Productivity Commission’s review of Financial Services competition kicked off this week, with APRA arguing that financial stability and banking competition are not mutually exclusive. The peak body for Customer Owned Banks made the case that the competition landscape is really tilted in favour of the big banks, thanks to the implicit Government Guarantee, and more generous capital rules. The banking sector is an oligopoly, they say.
Big deals were announced by online real estate platforms and mortgage lenders. Domain Group has announced it is expanding into home loans broking with the launch of ‘Domain Loan Finder’ in partnership with digital home loan platform Lendi.
Realestate.com.au and NAB are building a realestate.com.au-branded mortgage broking business and will launch later this year. All Choice Home Loan brokers will be invited to join the new business, which will benefit from realestate.com.au’s near 5.9m unique visitors a month. Separately Realestate.com.au acquired an 80.3% controlling stake in Smartline mortgage brokers.
These deals highlight the digital transformation underway, as consumers use online tools to search for real-estate, and then can apply for a loan within the same environment. Essentially, this disruptive play is really just another plank in the end-to-end lending value chain, and such vertical integration may not, in the long term, be good for consumers. We wonder if the Productivity Commission have this type of deal on the competition radar.
Finally, the spectre of eight, yes eight rises in the cash rate ahead were flagged by a former RBA board member this week. But in fact it was mis-reported by many. What he said was, if the economy started to track in line with RBA projections, they would be able to lift the cash rate.
The truth is, the economy is bumping along, with too little investment by the business sector (which can create real growth), and too much flowing into the overpriced housing sector. Until more radical action is taken, as for example the Bank of England did this week, we think future growth will be significantly below forecast, so the cash rate will only rise slowly.
But we still think mortgage rates will go higher, and so pressure on households will get significantly worse.
If rates were to rise by 2%, the number of households in mortgage stress would nearly double and, again – as the Bank of England highlighted – this would translate to significant dampening on future growth. We are in an uncomfortable position, with no easy way out, thanks to poor policy settings in recent years, and housing affordability reduced to a spurious debate about property supply.
And that’s the Property Imperative week to 1 July 2017. Check back next time for the latest update.

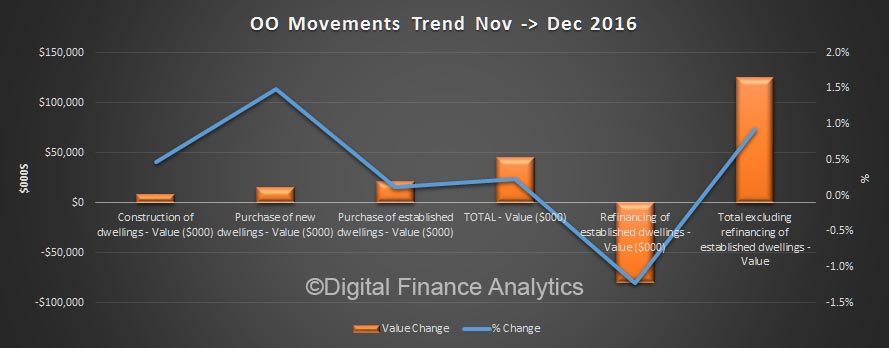
 Total mortgage lending is now above $1,7 trillion, with owner occupied loans up 0.6% or $6.6 billion to $1.12 trillion, and investor loans up 0.2% or $1.2 billion to $584 billion. Comparing this with the APRA data, out today, we see continued relative growth in the non-bank sector.
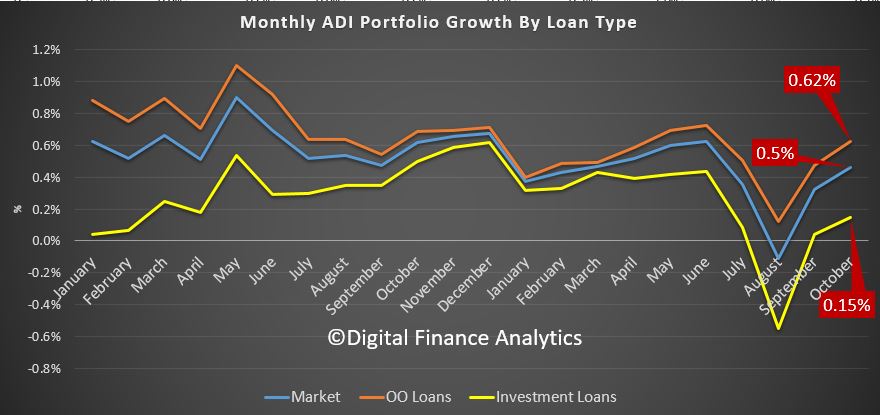
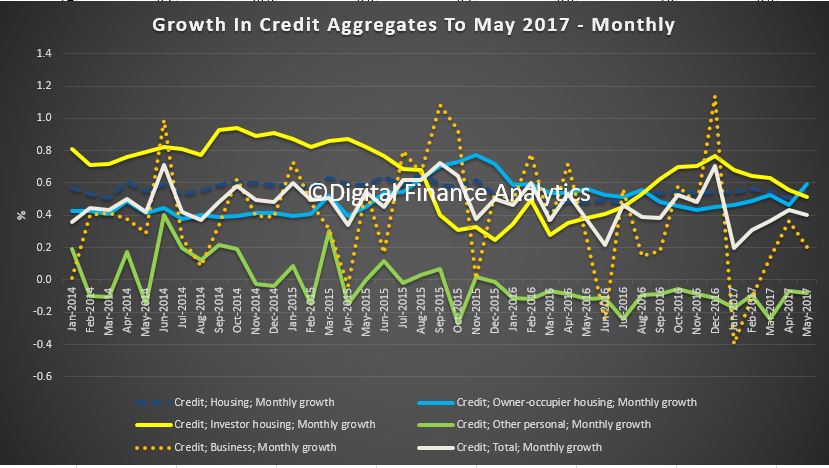
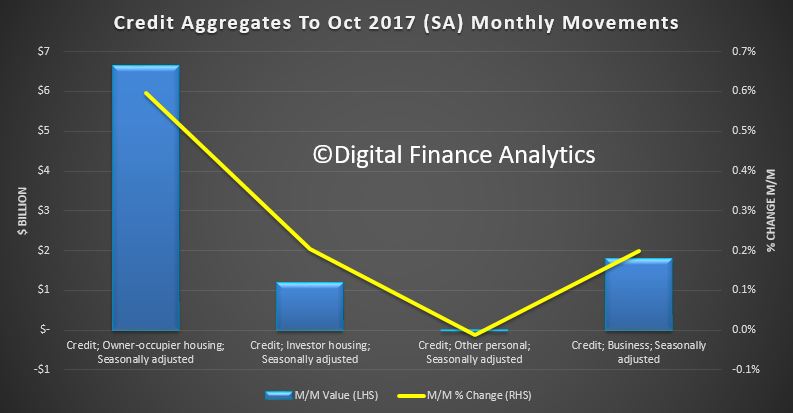 Here is the monthly growth plots, which even seasonally adjusted are noisy.
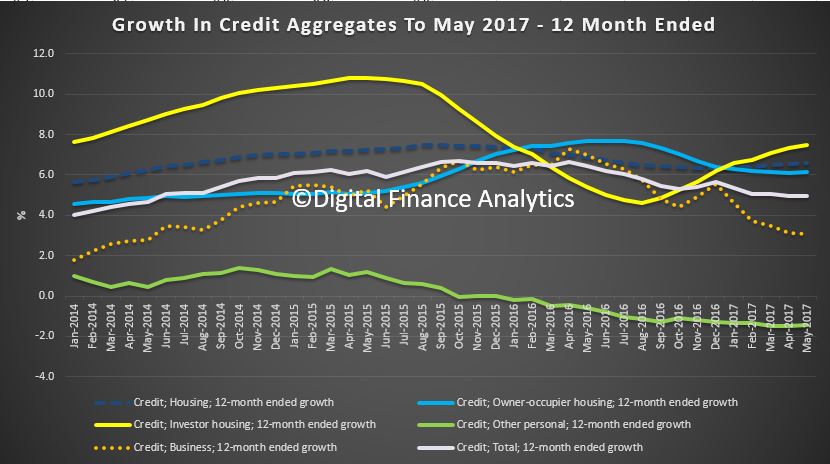
 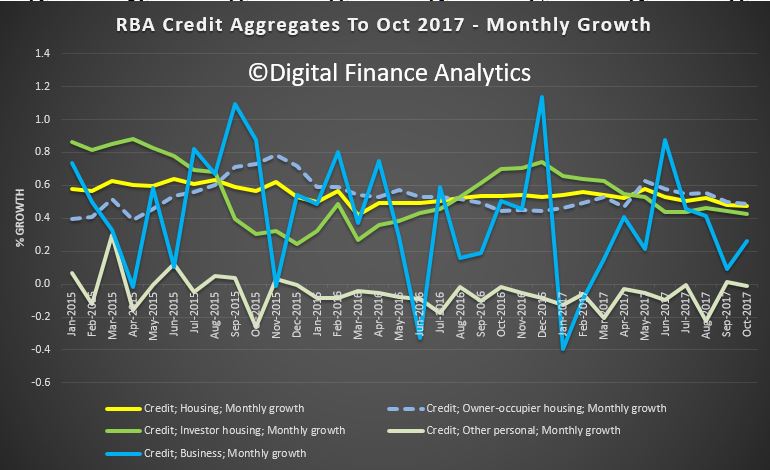 The smoother annual plots shows a slowing trend across the mortgage sector, but with investor sector still growth at 6.9%, ahead of the owner occupied sector at 6.5%, or business at 4%. Further evidence the settings are wrong.
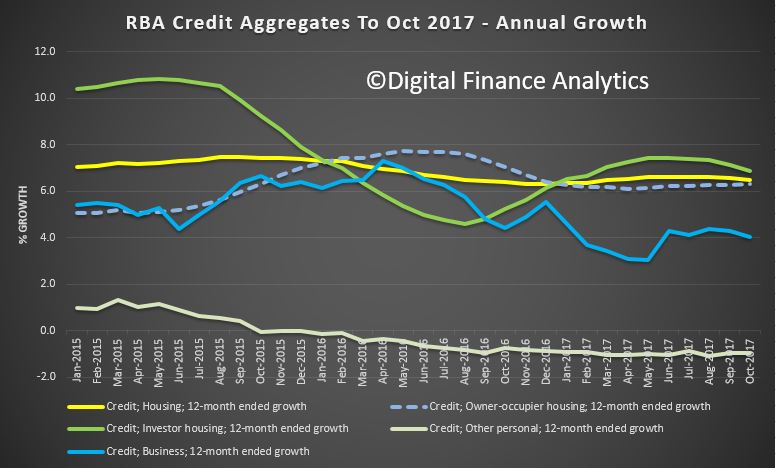 There is simply no excuse to allow home lending to be running at more than three times inflation or wage growth at the current dizzy price and leverage levels. Still too much focus on home lending and not enough on productive growth enabling business lending. This is something which the Royal Commission is unlikely to touch, as it is a policy, not a behaviourial issue.