Prime mortgage arrears rise 25% from a year ago

From Mortgage Professional Australia.

Prime mortgage arrears are up 25% from a year earlier, but remain relatively low, a report by S&P Global Ratings shows.

However, the number of prime home loan delinquencies fell in November 2016 from the previous month.

A total of 1.15% of the mortgages underlying Australian prime RMBS were more than 30 days in arrears in November, as measured by Standard & Poor’s Performance Index (SPIN), down from 1.16% in October.

Arrears fell month on month for most originator categories apart from regional banks, which recorded an increase in arrears to 1.88% from 1.85% a month earlier.

Nonbank financial institutions have maintained the lowest arrears, at 0.63%, followed by nonbank originators, at 0.95%, then other banks, at 0.96%. Major bank arrears were unchanged month on month in November.

APRA Says Banks Home Lending Up In December … But

APRA has released their monthly banking statistics, which shows the portfolio movements of the major banks. Total lending for housing was up 0.68% to $1.52 trillion, with owner occupied lending up 1% to $987 billion and investment lending up 0.06% to $537 trillion. But there are adjustments in these numbers which make them pretty useless, especially when looking at the mix between investment and owner occupied loans.

The trend here is quite different from the RBA data also out today, which showed growth of 0.8% for investment loans and 0.4% for owner occupied loans (and includes non-banks in these totals). A quick look at the monthly movements shows that there was a significant ($3bn+) adjustment at ING, which distorts the overall picture. No explanation from APRA, and this movement is much bigger than the $0.9 billion net figure the RBA mentioned in their release.

For what it is worth, here is the sorted 12 month growth trend by lending, showing the 10% “hurdle”. ING is to the right of the chart thanks to their adjustment.

But the point is, we really do not know where we stand as i) data quality from the banks is still poor, and ii) the regulators are unable to provide a reconciled and transparent picture of lending. Given the debate about housing affordability, we need better and consistent data to aid the debate.

Credit Growth Strong In December; But By How Much?

The RBA released their Credit Aggregates to December 2016 today.  Total housing was a new record at $1.62 trillion.

The headline statement from the RBA says housing grew 0.5% in the month and 6.3% annually, personal credit fell 0.1%, down 1.3% annually, and business credit role 1.1% in December, making 5.6% annually. All these are well above inflation, and wage growth.

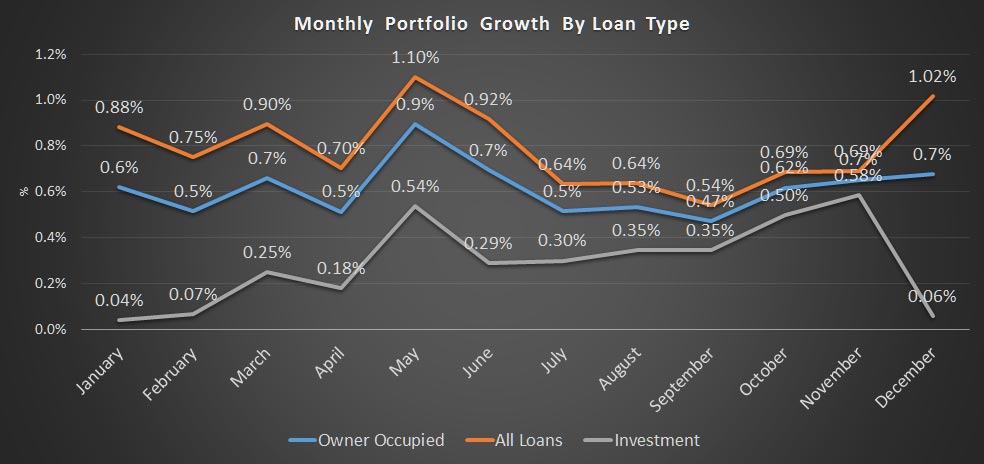
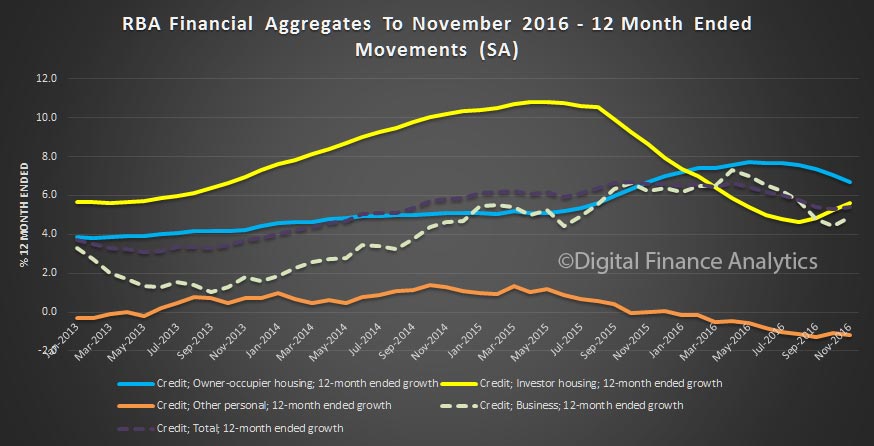
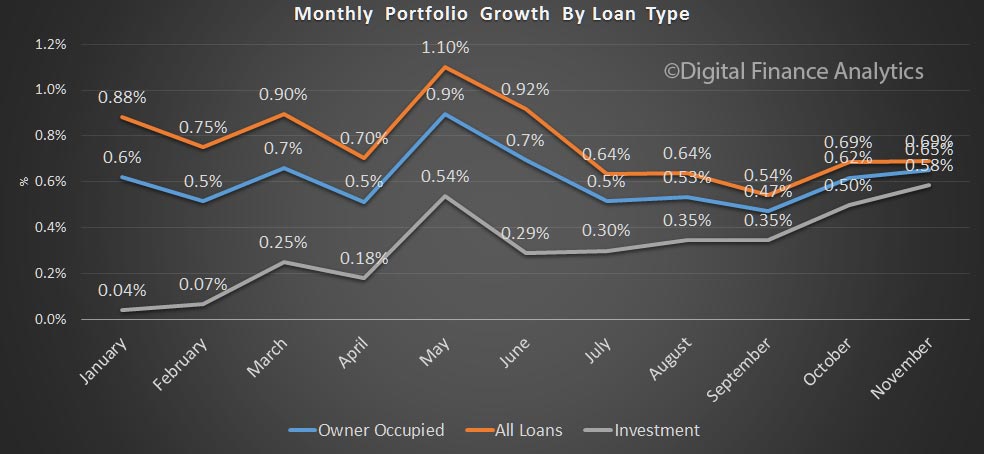
Within housing, investment lending continued to grow up 0.8%, compared with 0.4% for owner occupied lending, making annual changes of 6.2% and 6.4% respectively.  So, once again we see growth in the investment sector moving up, which is in line with our surveys.

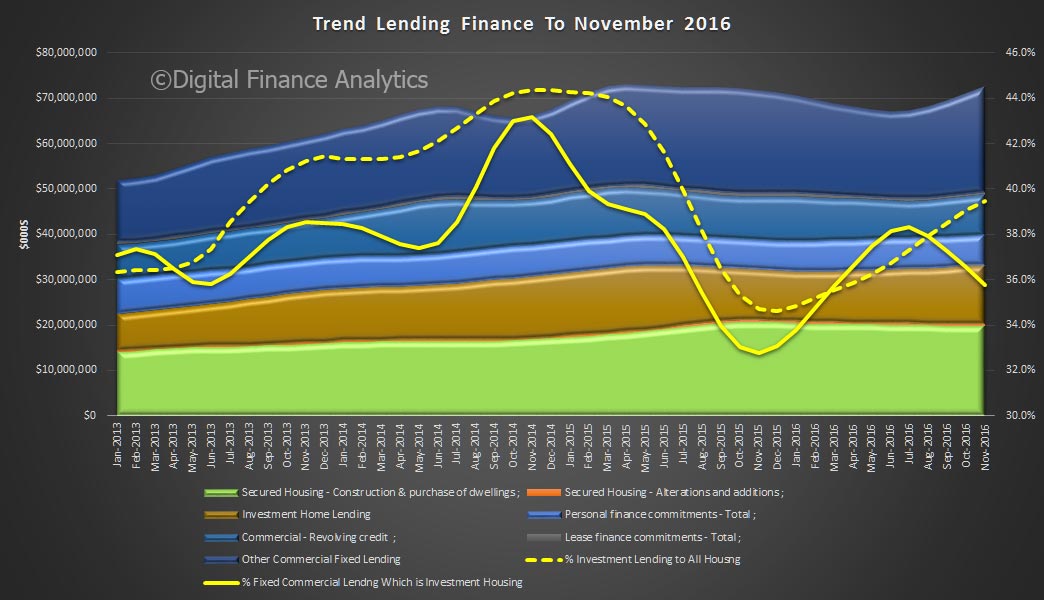
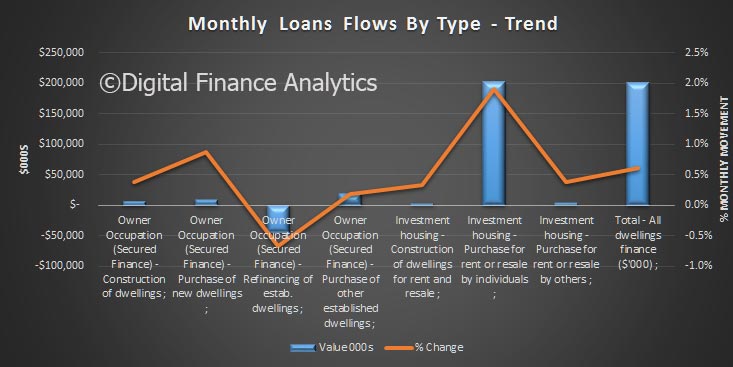
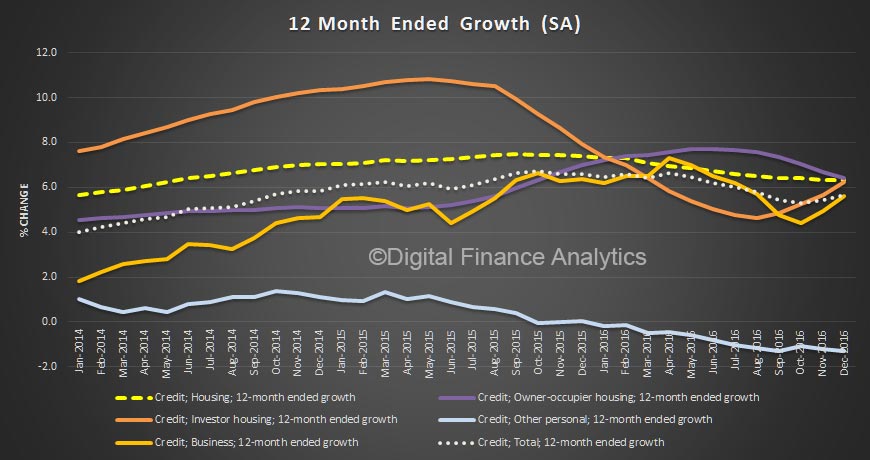
The monthly data shows the spike in both investment lending for housing and other business lending. This dataset, says the RBA has been adjusted for series breaks, to reflect as accurate picture as possible.

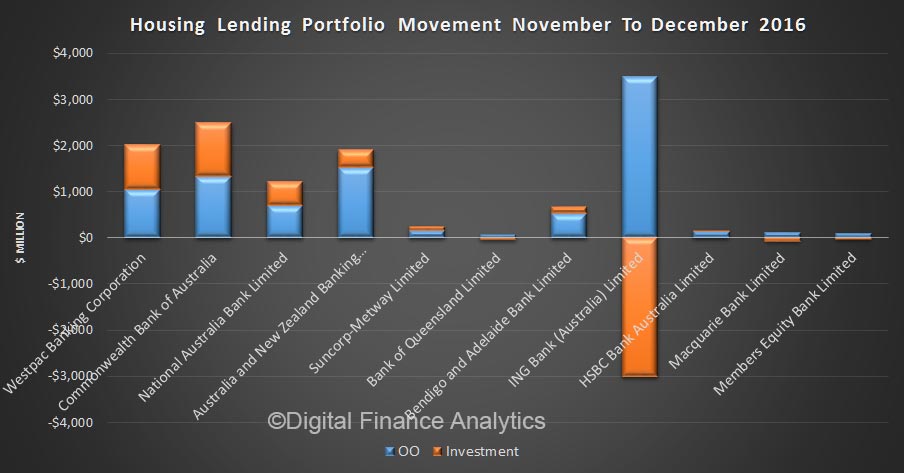
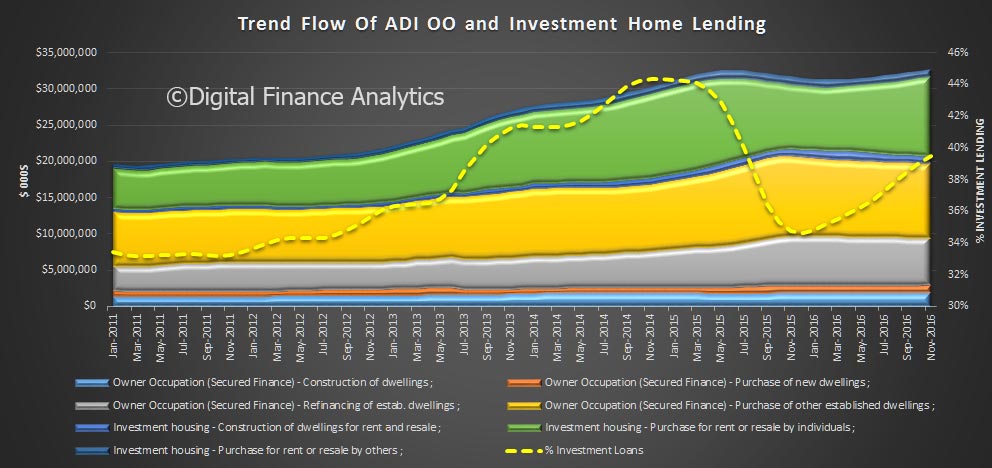
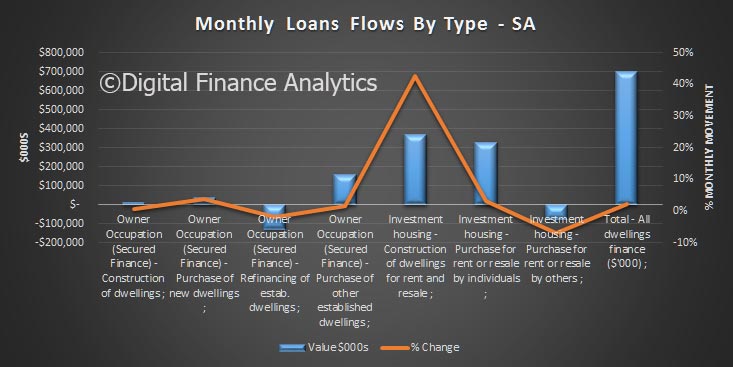
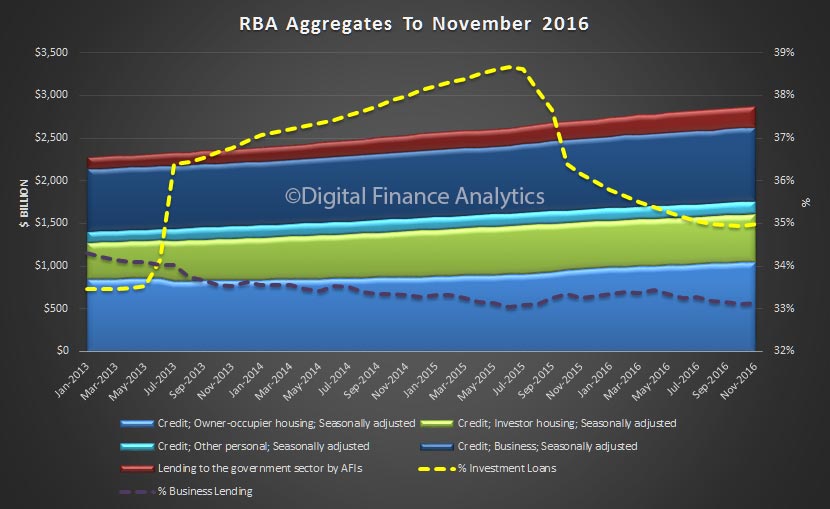
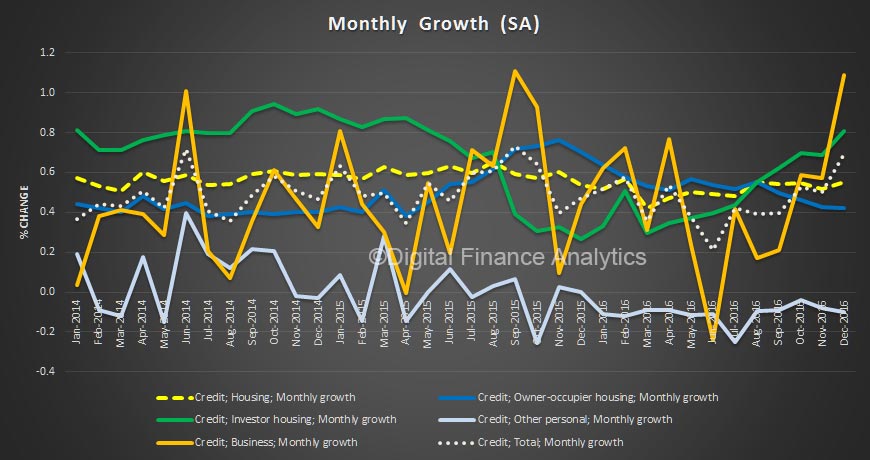
Now, things get interesting if we look at the more detailed data, which does not include series adjustments, although they are seasonally adjusted. Clearly there was further switching between loan categories.

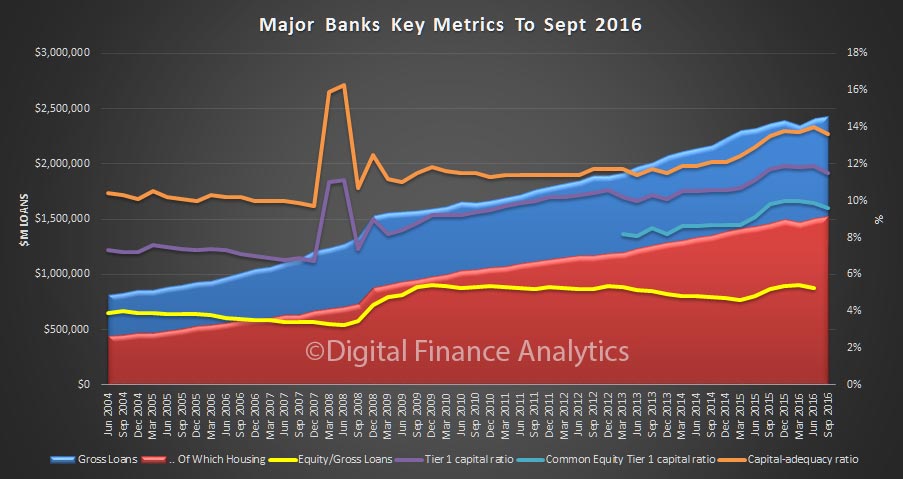
Total lending for housing rose to $1.62 trillion, up $14 billion in the month. This is a new record and is up 0.88% from last month. On these figures, owner occupied loans grew 0.9% ($9.4 billion) and investment loans grew 0.84% ($4.68 billion). We see variations in the personal credit series too, with borrowing up 0.1% in the month, by $0.15 billion to $144 billion; business credit rose by 1.29% or $11.2 billion to $879.8 billion. But there is no way we can reconcile the two data series, so actually, we just have to take the RBA’s word on the figures – hardly open and transparent. Perhaps they prefer to paint the lower “adjusted figure” to support their view all is well in the housing lending sector, but it is mighty strange to have such varied outcomes.

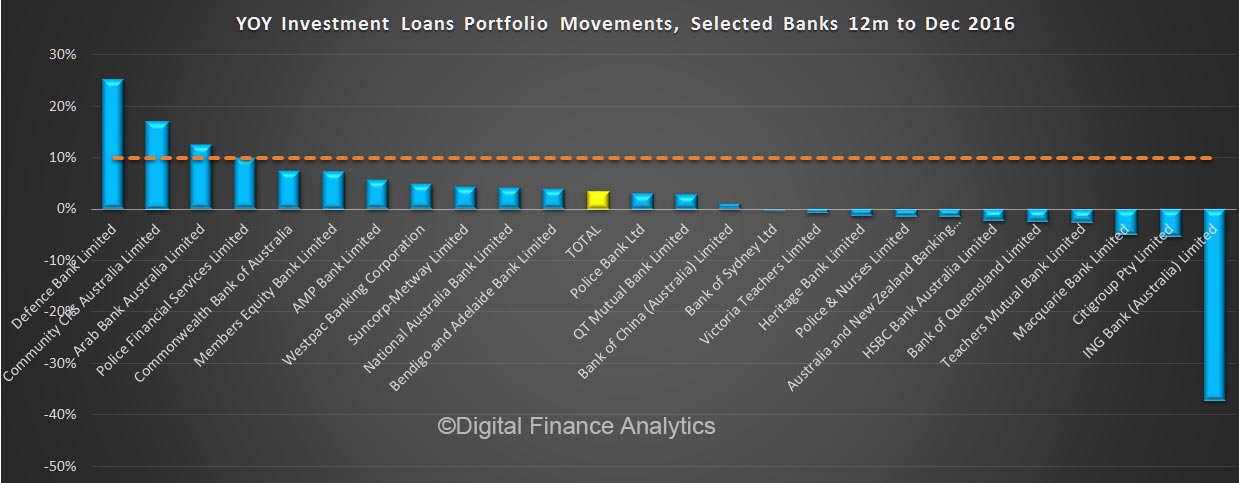
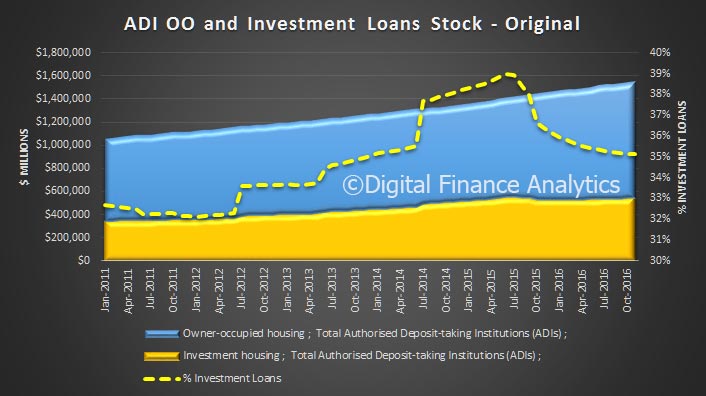
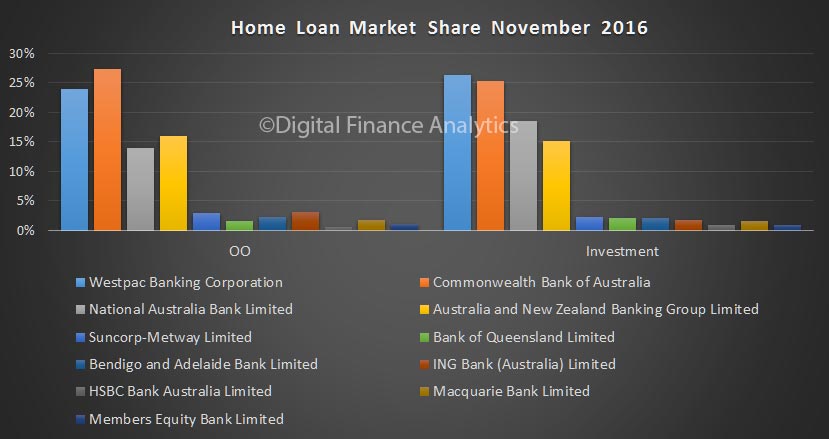
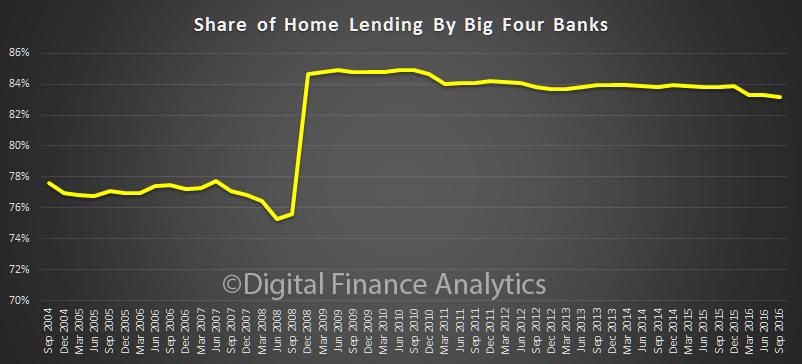
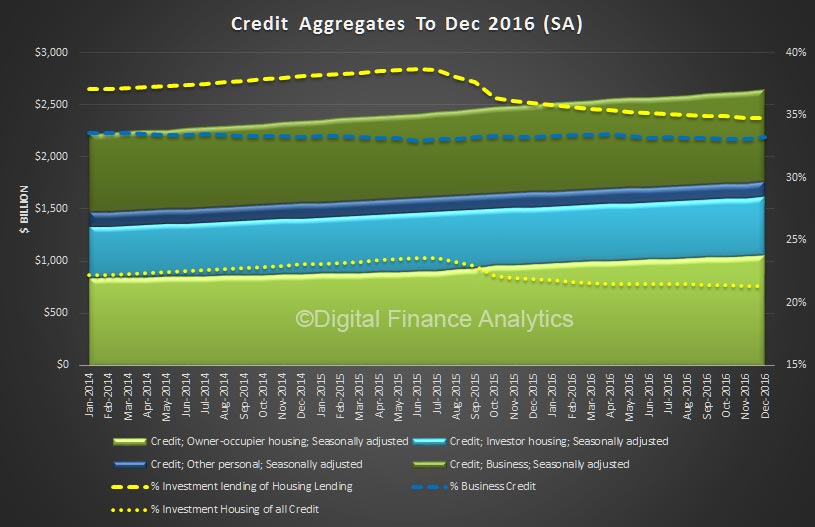
We also see the proportion of housing lending for investment purposes remained at 34.8% of all lending, still too high in our view and the proportion of lending to business rose a little to 33.2% of all lending. We are still over leveraged into housing generally, and to investment housing in particular.

The RBA noted:

All growth rates for the financial aggregates are seasonally adjusted, and adjusted for the effects of breaks in the series as recorded in the notes to the tables listed below. Data for the levels of financial aggregates are not adjusted for series breaks. Historical levels and growth rates for the financial aggregates have been revised owing to the resubmission of data by some financial intermediaries, the re-estimation of seasonal factors and the incorporation of securitisation data. The RBA credit aggregates measure credit provided by financial institutions operating domestically. They do not capture cross-border or non-intermediated lending.

Following the introduction of an interest rate differential between housing loans to investors and owner-occupiers in mid-2015, a number of borrowers have changed the purpose of their existing loan; the net value of switching of loan purpose from investor to owner-occupier is estimated to have been $48 billion over the period of July 2015 to December 2016, of which $0.9 billion occurred in December 2016. These changes are reflected in the level of owner-occupier and investor credit outstanding. However, growth rates for these series have been adjusted to remove the effect of loan purpose changes”.

We will discuss the APRA monthly banking stats later.

Credit Grew In November 2016 Thanks to Commercial Flows

The latest trend finance data from the ABS shows that total lending flows were up in November 2016. Overall $72 billion of credit was written, up 2.3% from the previous month, thanks to momentum in the commercial sector.

Within that, secured lending for residential construction and purchase was $19.8 billion, down slightly from October, whilst finance for alterations and additions rose 0.13%. Personal finance grew just a little, at 0.07%.

Looking at total fixed business lending, this grew $1.4 billion, up 3.74% to $45 billion, comprising  a rise of $1.2 billion, or 5.26% to $23.2 billion for commercial lending other than housing investment, and $0.2bn for investment housing, up 1.6%, to $12.9 billion.

Revolving business credit flows grew 2.95% to $8.9 billion, and leasing rose 0.19% to 0.5 billion.

So we see a rise in investment housing lending to 39.5% of all housing lending flows, driven by strong growth in NSW mainly, and a slowing in owner occupied lending. We also see an overall rise in business lending, even after isolating investment lending. We need to see ongoing growth in non-housing related business investment if economic momentum is to be sustained.

Home Lending On The Rise

The latest housing finance data from the ABS underscores the renewed momentum in home mortgage lending, especially in the investment sector, and there was also a rise in first time buyers accessing the market.

  • The trend estimate for the total value of dwelling finance commitments excluding alterations and additions rose 0.6%. Investment housing commitments rose 1.7%, while owner occupied housing commitments was flat.  In seasonally adjusted terms, the total value of dwelling finance commitments excluding alterations and additions rose 2.2%.
  • In trend terms, the number of commitments for owner occupied housing finance fell 0.1% in November 2016 whilst the number of commitments for the purchase of new dwellings rose 0.7%, the number of commitments for the construction of dwellings rose 0.2%, and the number of commitments for the purchase of established dwellings fell 0.2%.
  • In original terms, the number of first home buyer commitments rose by 13.4% to 8,281 in November from 7,302 in October; the number of non-first home buyer commitments also rose. The number of first home buyers as a percentage of total owner occupier commitments rose from 13.7% to 13.8%.

Total commitments in trend terms was $32.7 billion, of which $19.8 billion was owner occupied loans, and $12.9 billion for investment purposes. 39.5% of new lending was for investment purposes, and we see the proportion of investment loans continuing to rise, it is already too high.

Looking at the month on month movements, the seasonally adjusted changes highlight the rise in the investment funding for new construction, with a 40% rise on last month. Owner occupied refinancing fell.

The more reliable trend analysis shows the monthly movements, with a strong surge in investment loans by individuals, and a stronger fall in owner occupied refinancing.

Looking at total loan stock (in  original terms) around 35% of all loans outstanding are for investment purposes, and the slide we saw late 2015 appears to be easing.

Turning to the first time buyer, original data, the number of first time owner occupied buyers rose compared with last month, and the overall mix also increased.

Combining the first time buyer property investor data from our surveys, we see a spike in overall first time buyer activity.

Last month, around 1,100 more first time buyers entered the owner occupied market than the prior month (12%), and around 150 more in the investment sector.  We also saw a rise in the fixed rate loans, as borrowers try to lock in lower rates ahead of expected rises.

So overall, still strong momentum in the housing sector, and powered largely by an overheated investment sector.


Housing Credit Jumps Again

The RBA has released their credit aggregates to end November 2016.  Total credit for housing has now risen to $1.607 trillion, seasonally adjusted, up 0.5% in the month and 6.3% in the past year. Within that, investment lending was 35% of the total, up 0.68% whilst owner occupied loans rose 0.4%. So we see investment lending continuing to regain momentum and total credit growth is still running ahead of inflation and wages – so expect the household borrowing ratio to continue to climb.

Business lending was up 0.5% in the month, or 4.9% in the year, whilst personal credit continued to fall (ahead of Christmas) down 1.2% in the year to end November.

We see that share of investment mortgages on the rise, whilst the proportion of lending to business, to the total continues to fall.

There is still noise in the data. The RBA says:

All growth rates for the financial aggregates are seasonally adjusted, and adjusted for the effects of breaks in the series as recorded in the notes to the tables listed below. Data for the levels of financial aggregates are not adjusted for series breaks. Historical levels and growth rates for the financial aggregates have been revised owing to the resubmission of data by some financial intermediaries, the re-estimation of seasonal factors and the incorporation of securitisation data. The RBA credit aggregates measure credit provided by financial institutions operating domestically. They do not capture cross-border or non-intermediated lending.

Following the introduction of an interest rate differential between housing loans to investors and owner-occupiers in mid-2015, a number of borrowers have changed the purpose of their existing loan; the net value of switching of loan purpose from investor to owner-occupier is estimated to have been $47 billion over the period of July 2015 to November 2016, of which $0.9 billion occurred in November 2016. These changes are reflected in the level of owner-occupier and investor credit outstanding. However, growth rates for these series have been adjusted to remove the effect of loan purpose changes.


Bank Home Loan Portfolio Now Up To $1.51 Trillion

APRA released their monthly banking stats for November 2016.  The total loan portfolio rose 0.65% in the month to a new high of $1.51 trillion. Within that, owner occupied lending rose 0.69% by $6.7 billion, to $977 billion and investment lending rose 0.58%, by $3.1 billion to $536 billion; accounting for 35.44% of all loans. We see investment lending still accelerating (as expected, based on our household surveys).

Looking at the individual lenders, CBA wrote more investment loans than WBC in the month, though WBC just holds on to its prime position for investment loans.

Overall WBC wrote the most new business, $2.48 billion. compared with CBA’s $2.26 billion.

The 12 month system investment portfolio movement is 3.5%, but has accelerated in recent months. Testing against the 10% APRA speed limit, we see that most lenders are well below this threshold. We think the limit should be dropped, as investment loan momentum is too strong, and well above inflation and wage growth. APRA never really explained why they picked 10% – time for more macro-prudential action!

The RBA data will be out soon, so we will see if the market – including the non-banks moved the same way.

Major Banks Still Highly Leveraged

APRA has published their quarterly summary of bank performance. Looking at the key metrics of the four major banks, we see growth in home lending and driving total loans higher to $2.4 trillion. Net interest income from home lending rose to 61.9%, up from 59.3% the previous quarter, reflecting changes in mortgage discounts and repricing. 83.2% of all ADI home lending is held by the big four.

apra-adi-sepq16-shareHome lending now comprises 62.8% of all loans with the big four. But in cash terms, lending provisions are lower now than in 2010, despite significantly larger balances.

apra-adi-sepq16-mix-and-provThe ratio of bank share equity to total loans sits at just over 5%, showing again how leveraged the banks are. We also see that CET1 and Basel Capital, whilst higher now than in 2013, has fallen somewhat recently.

apra-adi-sepq16The new Liquidity Coverage reporting shows the big four well above the required 100%.

apra-adi-sepq16-lcrTerm deposits rose compared with on-call deposits, thanks to the LCR requirements making term deposits more attractive to the banks.

More generally, on a consolidated group basis, there were 153 ADIs operating in Australia as at 30 September 2016, compared to 156 at 30 June 2016 and 159 at 30 September 2015.

  • G&C Mutual Bank Limited changed its name from SGE Mutual Limited, with effect from 12 September 2016.
  • Latvian Australian Credit Co-operative Society Limited had its authority to carry on banking business in Australia, with effect from 22 September 2016.
  • MyLifeMyFinance Limited changed its name from Transcomm Credit Co-operative Limited, and changed its classification from ‘Credit union’ to ‘Other ADI’, with effect from 3 August 2016.
  • “Quay Credit Union Ltd had its authority to carry on banking business in Australia revoked, with effect from 12 September 2016.”
  • “Select Credit Union Limited had its authority to carry on banking business in Australia revoked, with effect from 7 July 2016.”
  • “Select Encompass Credit Union Ltd changed its name from Encompass Credit Union Limited, with effect from 13 July 2016.”
  • “Sutherland Credit Union Ltd had its authority to carry on banking business in Australia revoked, with effect from 12 July 2016.”
  • “The Bank of Nova Scotia was authorised to operate as a foreign branch bank in Australia, with effect from 25 August 2016.”Looking at financial performance, the net profit after tax for all ADIs was $27.7 billion for the year ending 30 September 2016. This is a decrease of $9.2 billion (25.0 per cent) on the year ending 30 September 2015.

The cost-to-income ratio for all ADIs was 48.3 per cent for the year ending 30 September 2016, compared to 49.0 per cent for the year ending 30 September 2015.

The return on equity for all ADIs was 9.9 per cent for the year ending 30 September 2016, compared to 14.1 per cent for the year ending 30 September 2015.

The total assets for all ADIs was $4.52 trillion at 30 September 2016. This is a decrease of $58.3 billion (1.3 per cent) on 30 September 2015.

The total gross loans and advances for all ADIs was $3.01 trillion as at 30 September 2016. This is an increase of $105.8 billion (3.6 per cent) on 30 September 2015.

The total capital ratio for all ADIs was 13.7 per cent at 30 September 2016, unchanged from 13.7 per cent on 30 September 2015.

The common equity tier 1 ratio for all ADIs was 9.9 per cent at 30 September 2016, a decrease from 10.1 per cent on 30 September 2015.

The risk-weighted assets (RWA) for all ADIs was $1.97 trillion at 30 September 2016, an increase of $110.1 billion (5.9 per cent) on 30 September 2015.

For all ADIs:

  • Impaired facilities were $15.2 billion as at 30 September 2016. This is an increase of $1.4 billion (10.4 per cent) on 30 September 2015. Past due items were $12.9 billion as at 30 September 2016. This is an increase of $1.2 billion (10.5 per cent) on 30 September 2015;
  • Impaired facilities and past due items as a proportion of gross loans and advances was 0.93 per cent at 30 September 2016, an increase from 0.88 per cent at 30 September 2015;
  • Specific provisions were $7.2 billion at 30 September 2016 (chart 8). This is an increase of $0.9 billion (14.2 per cent) on 30 September 2015; and
  • Specific provisions as a proportion of gross loans and advances was 0.24 per cent at 30 September 2016, an increase from 0.22 per cent at 30 September 2015.