NSW and VIC Leads Residential Building

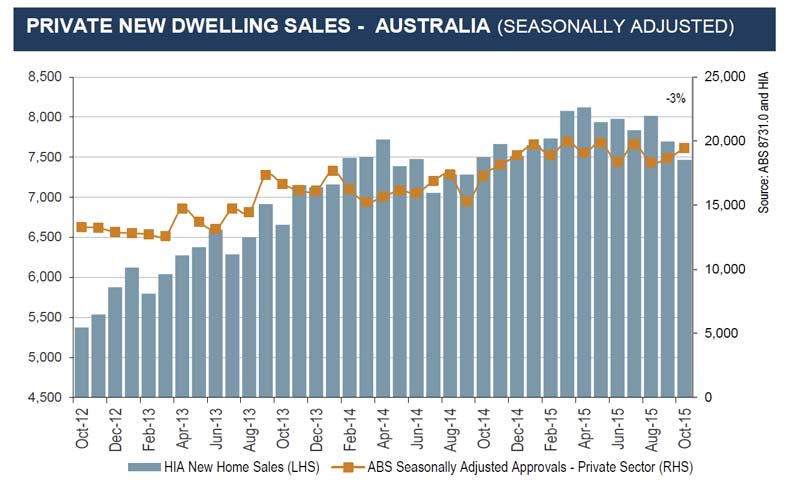
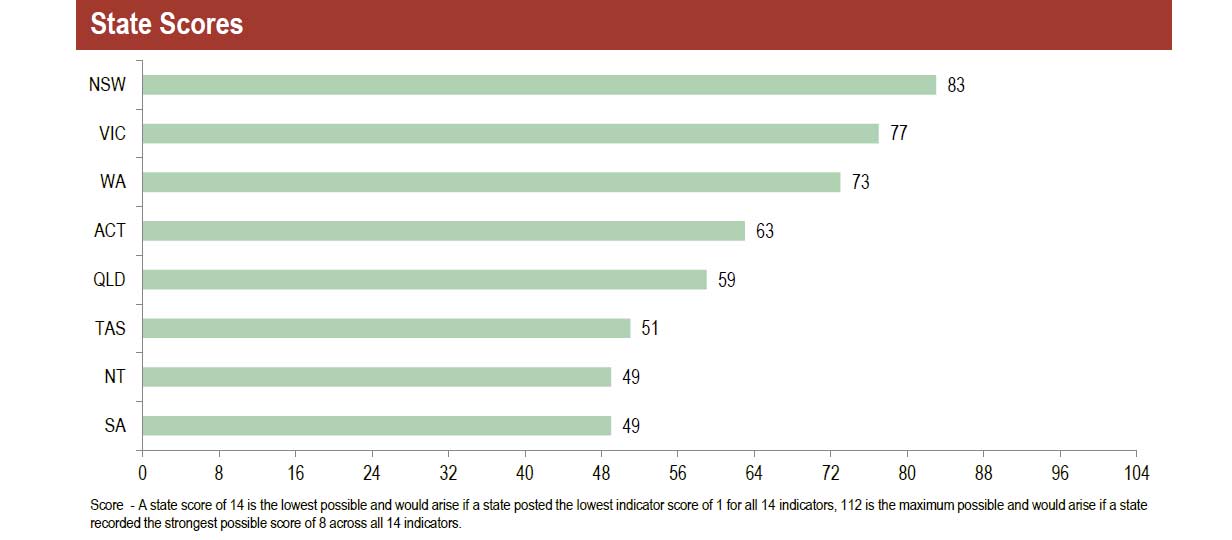
The latest edition of the HIA Housing Scorecard was released today. There are significant and important state variations in activity and outcomes and the scorecard nicely highlights some of the contracts. For example, first time buyers in NSW continue to languish, whilst WA has strong construction activity and NT housing finance fell. SA and NT registered the lowest scores.

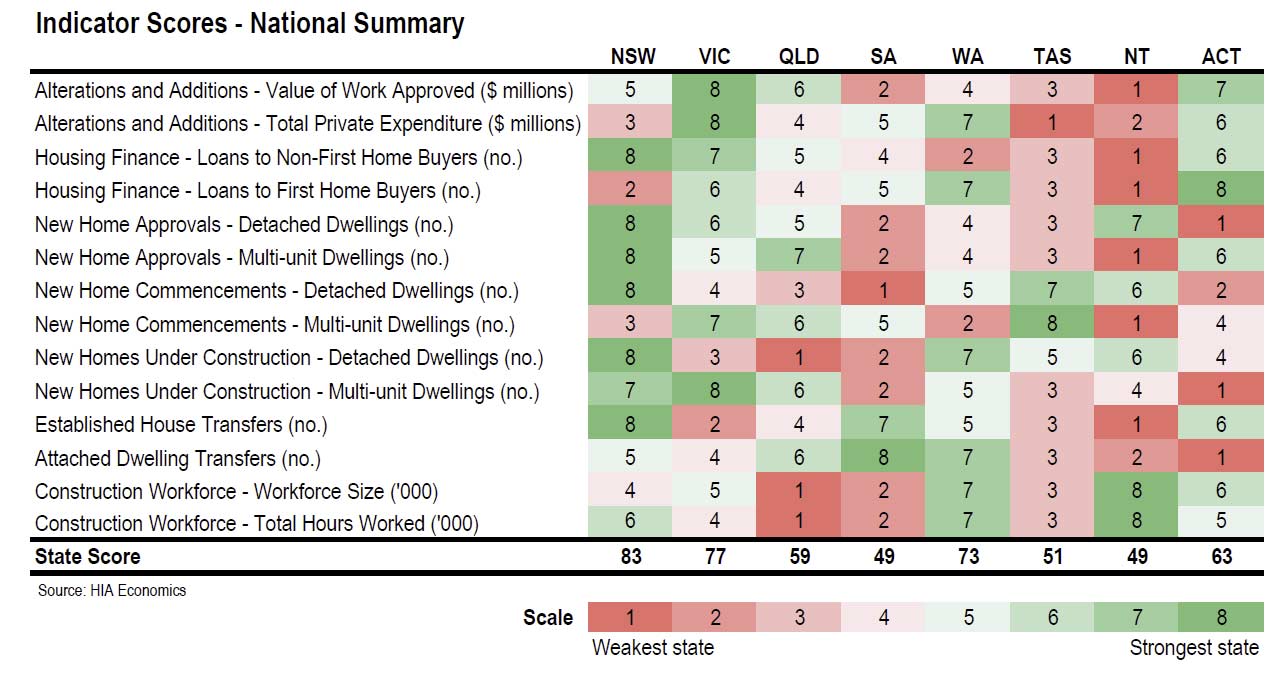
The Housing Scorecard provides a half yearly review of residential building conditions in each state and territory. Across a range of activity indicators, the most recent performance in each state is benchmarked against the state’s longer term average. This analysis is aggregated in a scoring system which provides a ranking that highlights the relative strength or weakness of residential building activity in each state and territory. The indicators include (using ABS data):

  • Detached house building;
  • Multi-unit dwelling building;
  • Renovations;
  • Construction labour force;
  • Housing finance; and
  • Turnover of established homes

HIA-SC-1

This analysis is aggregated in a scoring system to generate a league table ranking the relative strength/weakness of residential building conditions in each jurisdiction. For each indicator, each state is assigned an indicator score where a state receives a score of eight if they are the strongest relative to their long term average and progressively lower scores assigned for the weaker states. A score of one is assigned to the state with the weakest level of activity relative to their long term average.

The indicator scores assigned for each state are summed together which becomes the state score. The state score provides the basis for the overall ranking of the states. The states are ranked in descending order based on the state score. The highest scoring state is ranked number one and each state is ranked in descending order with the state achieving the lowest score ranking eighth.

HIA-SC-2NSW

New South Wales continued to hold down top spot with a score of 83, taking out the top indicator score in six of the fourteen indicators.

NSW scored strongly in the key leading indicators of new home building activity, and those relating to the housing market more broadly. Relating to new home building, NSW scored most favourably in the indicators tracking detached house construction – taking top spot for approvals of detached houses, as well as
commencements and the number of dwellings currently under construction.

NSW also scored well in the indicators of multi-unit dwelling approvals, with activity in the September 2015
quarter more than double the decade average – and the multi-unit dwellings under construction category. Against the backdrop of such strong leading indicators of multiunit building activity, NSW’s ranking for multi-unit dwelling commencements appears out of step. However, this is consistent with the accumulation of dwellings that have been approved, but have not yet been commenced.

Typically home price growth provides the catalyst for a rise in renovations activity, however this is yet to fully
materialise in in the current cycle. NSW ranks fourth in terms of the value of work approved, and sixth in terms of the aggregate value of renovations investment.

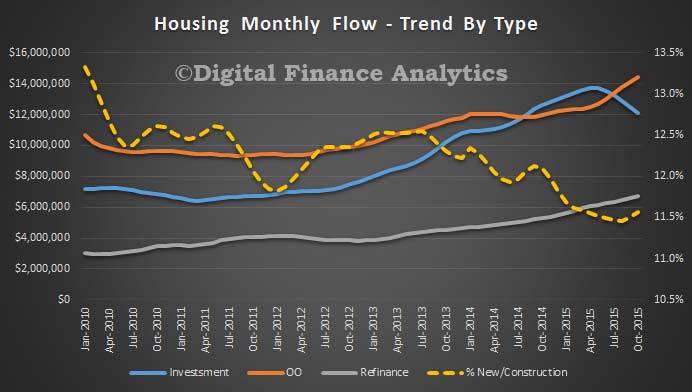
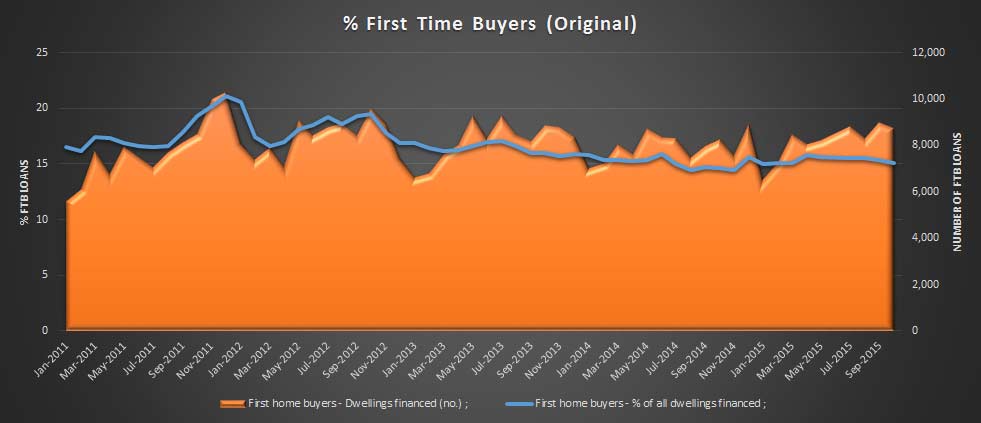
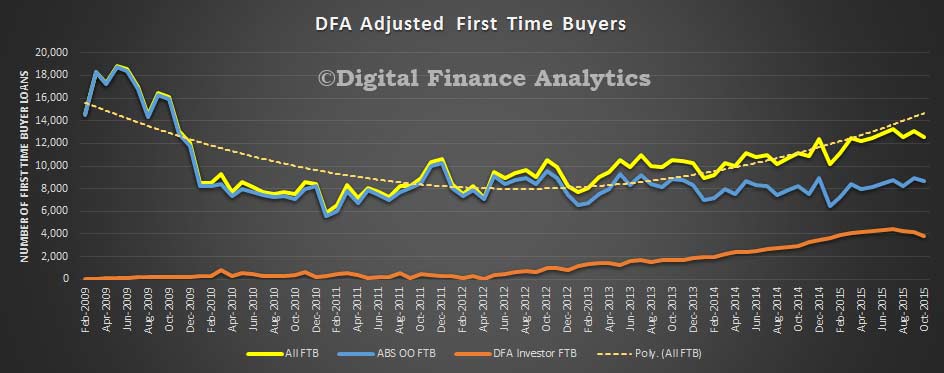
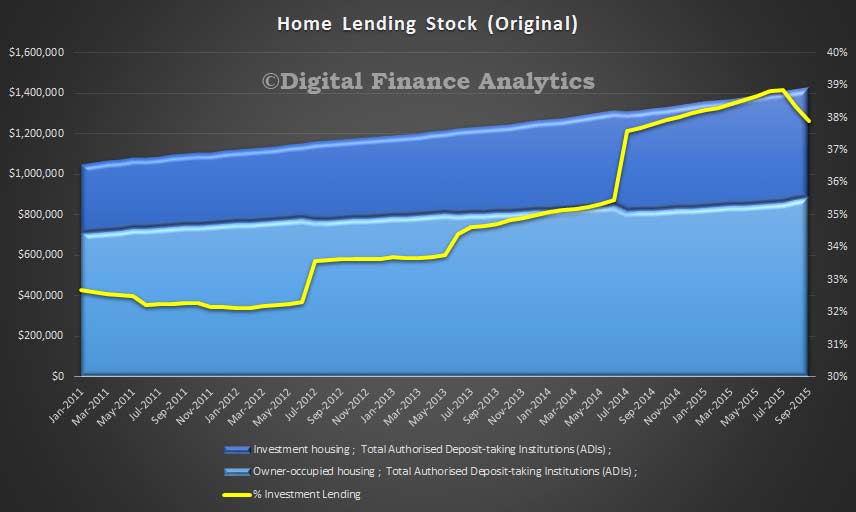
The weakest part of the NSW picture relates to first home buyers. This will come as little surprise given the extent to which the escalation in home prices in the state has outpaced household income growth over the last year or more. The number of loans to first home buyers in the September 2015 quarter was 21.7 per cent below the long term average, which ranks as the second weakest of the eight jurisdictions.

VIC

Whereas NSW is the king of new home building at the moment, Victoria is the king of home renovations. Once
again, the strong performance of the renovations market has underpinned Victoria’s high overall ranking.

In terms of private expenditure on home renovations, Victoria continues its run as the top ranked state to four consecutive quarters and has been the top ranked state on this indicator in eleven of the last thirteen quarters.

Victoria is the only jurisdiction in the nation to record a level of expenditure that was higher than its decade
average in the September 2015 quarter, and has been the only one to consistently do so over the last couple of
years. However, other states territories are now showing signs of improving so it will be a challenge for Victoria to hold on to the top ranking in the quarters ahead.

Victoria also continues to record strong performances for indicators tracking multi-unit dwelling construction.

The state ranks as the second strongest state in terms of the number of multi-unit dwellings commenced and the top ranked jurisdiction for multi-unit dwellings under construction. However, for the number of multi-unit
dwellings approved, which is a more forward looking indicator, the state has dropped to fourth in the rankings.

First home buyer lending activity in Victoria provides an interesting contrast to their neighbours to the north. While both Melbourne and Sydney have seen rapid home price growth push some first home buyer to the sidelines, the lending figures suggest the impact has been much smaller in Victoria. With the number of loans in the September 2015 quarter being only 5.4 per cent below the decade average, Victoria ranks as the third strongest market for first home buyers.

QLD

After the state score dropped to a lowly 22 back when Queensland was the lowest ranking jurisdiction for a spell during 2011, the state has made steady incremental improvements and now ranks fifth with a score of 59.

Furthermore, there is now daylight between QLD and the lower ranked states, and fourth placed the ACT is within striking distance.

The indicators of multi-unit activity have been a source of strength for QLD. In terms of multi-unit approvals, with 6,130 approvals during the September 2015 quarter providing a level 88.4 per cent higher than the decade average, the state ranks second amongst the states and territories. In addition, the state’s rankings for multi-unit commencements and the number of multi-unit dwellings under construction both increased two places to rank third overall in each indicator.

One of the key weak points in QLD’s overall position is indicative of a broader economic challenge the state is
facing. In terms of the number of people employed in construction and the aggregate hours worked by the
construction workforce, the state ranks stone cold last. The number of workers employed in the construction
industry is 13.6 per cent down on the decade average, while the aggregate number of hours was down by 15.0
per cent.

It is important to note that these labour market indicators track the entire construction workforce (not just those in residential building) and this is being influenced by the conclusion of a number of major resource projects. A recovery in non-residential building and a continuation of the recovery in residential activity will be essential if the state is to see a much needed revival of its non-resource industries.

SA

While South Australia’s state score lifted by three points over the last six months, the state’s ranking held steady at number seven which makes it equal last (alongside the NT) in this edition of the HIA Housing Scorecard.

Consistent with the last edition of this report, the turnover of established dwellings was a strong point for SA. The state ranks as the second strongest for turnover of established houses (bettered only by NSW), while the
state ranks as the top ranked state for turnover of attached dwellings. While this is a positive sign for the
real estate industry, it hasn’t correlated with positive signs for residential building.

The state’s detached house segment is a weak point. In terms of detached house commencements, the number of new housing starts in the latest quarter (June 2015) was 24.5 per cent below the decade average – ranking it is the weakest jurisdiction nationally. In addition, the state ranked second weakest in terms of approvals for detached houses and for the number detached houses under construction.

Again, there were mixed readings for indicators of renovations activity. The value of large renovation jobs
approved in the September 2015 quarter was relatively weak and ranked as the second weakest jurisdiction
nationally. However, SA ranked fourth in terms of the total value of private investment in alterations and
additions.

WA

While Western Australia’s place on the national league table has slipped again, third place is still a good result,
indicating that overall conditions in the state’s housing sector remain healthy. Most elements of the sector are
still outperforming their respective decade averages. The details highlight that WA is still benefitting from what appears to be quite a ‘long tail’ to the state’s new home building boom.

Of the 14 housing market indicators, WA achieved the second strongest score rankings in six: total expenditure of alterations and additions, lending to first home buyers; number of detached dwellings under construction; number of attached dwelling transfers; size of the construction work force, and; total hours worked by the construction workforce.

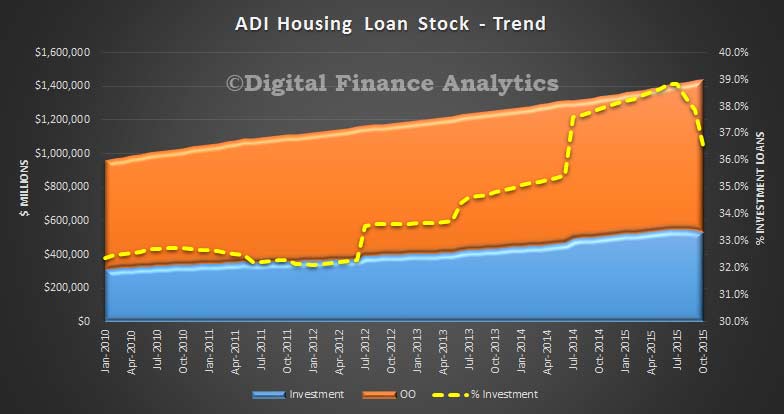
Where WA is starting to feel the effects of the emerging downturn, is in housing finance. Latest figures on lending to non-first home buyers show activity was 10.4 per cent lower than the state’s decade average.

While multi-unit dwelling commencements in WA were 14.3 per cent higher than the decade average in WA,
these kinds of starts in other states and territories are outperforming their respective decade averages by a
much greater magnitude

TAS

Following eleven consecutive quarters entrenched in last place, Tasmania finally climbed two places to reach sixth on the housing league table. As suggested in the previous edition of Housing Scorecard, a slow grinding
recovery in Tasmania’s overall ranking is slowly taking place. In this edition, it’s sixth-place ranking due to the state increasing its overall state score by 10 points to reach 51.

Tasmania has finally relinquished the wooden spoon to South Australia and the Northern Territory.

The strong improvement in the Apple Isle was due largely to the strong results for both detached and multi-unit dwelling commencements. The latest level of these commencements outstripped the state’s decade average by 27.7 per cent and 145.9 per cent, respectively. This meant that Tasmania was the strongest state for multiunit dwelling commencements and the second strongest for detached dwelling commencements.

Conversely, the latest level of total private expenditure on alterations and additions – worth $155 million – was 18.0 per cent lower than the state’s decade average, representing the worst performance among the states and territories. While a last-place ranking isn’t ideal, at least it has been limited to this one indicator. In the previous edition of Housing Scorecard, Tasmania ranked the weakest state in five indicators.

However, there is still room for further improvement, with the performance of the majority of Tasmania’s housing indicators (nine out of fourteen) placed the state as the third weakest state among the eight state and territories, summarised in the table below.

NT

Conditions in the Northern Territory’s housing sector continue to deteriorate, evidenced by the territory’s
sliding ranking – down three places to rock bottom – in this edition of Housing Scorecard. The NT’s overall state score declined by 12 points to reach 49, which saw the territory share the wooden spoon with South Australia.

This weak score was due to bottom-place rankings (and thereby a score of only 1) in six of the fourteen indicators. Specifically, these indicators were: value of alterations and additions work approved; housing finance (among both first home and non-first home buyers); multi-unit dwelling approvals; multi-unit dwelling commencements, and; established house transfers. The latest performance of these indicators was at a level well below their respective decade averages.

Nevertheless, the NT’s construction labour market is still outperforming, with the latest size of, and hours worked by the construction labour force, more than 50 per cent above the decade average, the strongest performance among all the states and territories. Furthermore, while all signs are pointing towards a
substantial deterioration in the multi-unit segment of the new home building market, the detached segment of new home building is the bright spot for the NT’s overall housing sector. The latest number of detached houses that are under construction, having recently commenced construction, and also approved for construction are still well above decade averages, thereby rating the NT strongly compared with other jurisdictions on these measures

ACT

The Australian Capital Territory retained its mid-table ranking of fourth place in this Summer edition of Housing Scorecard, despite its score increasing by 2 points since the previous edition, to reach 63. Driving the increased score was the multi-unit segment of new home building – the latest levels of multi-unit
approvals as well as multi-unit commencements were 84.1 per cent and 60.3 per cent above their respective
decade averages. This represents a sharp turn-around from the performance in the previous edition, where
levels were tracking below their decade averages.

Fortunes can obviously change very quickly in the multiunit segment of the market – which could well be evident in coming editions of Housing Scorecard. Furthermore, not all multi-unit indicators outperformed in this update.

The latest level of multi-unit dwellings under construction was just shy of the ACT’s decade average (down by 0.4 per cent), while the level of attached dwelling transfers was down by 35.7 per cent.

While the multi-unit segment of the market looks to be set for a bumpy ride, the renovations market is looking brighter. The latest level of major alterations and additions work approved was 12.6 per cent above the decade average. While the value of total renovations expenditure was actually down from the decade average by 2.5 per cent, this is no comparison to the malaise in total renovations expenditure in most of the other states and territories.

Another bright spot is the reinvigorated first home buyer market, where the ACT ranks as the strongest jurisdiction for lending to first home buyers. The latest level of lending is some 6.7 per cent higher than the decade average.

Latest Housing Finance Data Shows Market Is Turning But Still Rising

The latest data from the ABS on housing finance for October 2015, continues to tell the story of the turning market, with investors slowing, and owner occupied loans still rising (and supported by growth in refinanced loans). It also contains a number of adjustments, so trends are hard to read.  But, do not be deceived, the market still has significant momentum, and overall volumes and values are still high.

Looking at the national monthly trend flows first, we see that in October total housing loans of $33.2 bn were written, up 0.04% from the previous month, or $12.9m. Note that significant home lending is still happening, though overall growth has slowed.

Within these numbers, $14.4bn owner occupied loans were written, a rise of 2.1%, or $291m; whilst $12.1bn of investment loans were written, down 3.1% or $386m. Refinancing grew 1.7%, of $109m and equated to $6.7bn in the month. Loans for new houses or for construction of new dwellings (across investment and OO), rose 0.5% to $3.8bn.

Housing-Oct-1Taking a longer, and state based view of  loans for new construction for owner occupation, there are significant variations. New home lending to owner occupiers increased by 7.8 per cent in New South Wales and was unchanged in the Norther Territory. In the other six states and territories, the number of loans to owner occupiers purchasing or constructing new homes decline in October 2015 when compared with October 2014: Tasmania (-28.6 per cent); Western Australia (-24.5 per cent); Australian Capital Territory (-20.9 per cent); Queensland (-9.2 per cent); Victoria (-6.0 per cent); and South Australia (-2.5 per cent).  Construction momentum is waning.

Of course, there is a whole load of noise in the data, with loan reclassifications so we need to treat the numbers with care, but the trend is clear now. These adjustments show clearly in the ADI stock trend data, which shows how the proportion of investment loans were adjusted up (thanks to the bank reclassifying loans to investment loans in the year from June 2014, and more recently households telling the banks their loans were NOT investment loans, see our earlier post on this, referring to the more reliable(?) RBA numbers. At a portfolio level, in original terms, ADI loans for all housing were up 0.53% to $1.44 trillion,  of which OO contributed $911bn, up 2.6% and investment loans $526bn, down 2.9%.

Housing-Stock-Oct-2015Turning to first time buyers, owner occupied loans fell 2.85%, making 15.1% of all new loans taken by first time buyers. The average FTB loan rose again from $351,800 last month to $355,700 this month. An astonishing rise, given flat incomes.

FTB-Oct-2015Finally, if we add back in the hidden first time buyers who are going direct to the investment sector (using data from the DFA surveys), we see that momentum here continues to weaken, with a fall of more than 7% is loans written this month, a fall from 4,147 in September to 3,835 in October.  Together first time buyer numbers fell 5.5%, from 13,100 to 12,534.

FTB-Adj-Oct-2015  To further muddy the waters, the ABS also made revisions:

In this issue revisions have been made to the original series as a result of improved reporting of survey and administrative data, and updated first home buyer modelled estimates. These revisions have impacted on:

  • First home buyers owner occupied housing for August 2015.
  • Investment housing for August 2015.
  • Housing loan outstandings to households; owner-occupied and investment housing: for periods from March 2014 to September 2015.

Monthly First Home Buyer statistics will be subject to future revision, as the modelled component is adjusted to reflect improved reporting by lenders.

HIA Says New Home Sales Held Up Well In October

The HIA New Home Sales Report, a survey of Australia’s largest volume builders, reveals that while sales volumes are off their peak they are still holding up relatively well.

The latest update – for October 2015 – reveals a decline of 3.0 per cent in total seasonally adjusted new home sales. Detached house sales fell by 4.1 per cent while the sale of ‘multi-units’ notched up a 1.0 per cent gain.

HIA-Dec-2015In the month of October 2015 detached house sales declined in four out of the five the mainland states. Detached house sales fell by 9.3 per cent in Victoria, 5.4 per cent in Western Australia, 0.9 per cent in Queensland and 0.8 per cent in New South Wales. Detached house sales increased by 2.6 per cent in South Australia.

IMF Updates Global and National Housing Outlook, Australian Property Overvalued

In the latest release, the IMF have provided data to October 2015, and also some specific analysis of the Australian housing market. We think they are overoptimistic about the local scene, and we explain why.

But first, according to the IMF, globally, house prices continue a slow recovery. The Global House Price Index, an equally weighted average of real house prices in nearly 60 countries, inched up slowly during the past two years but has not yet returned to pre-crisis levels.

chart1_As noted in previous quarterly reports, the overall index conceals divergent patterns: over the past year, house prices rose in two-thirds of the countries included in the index and fell in the other one-third.

house prices around the world_071814Credit growth has been strong in many countries. As noted in July’s quarterly report, house prices and credit growth have gone hand-in-hand over the past five years. However, credit growth is not the only predictor for the extent of house price growth; several other factors appear to be at play.

house prices around the world_071814For OECD countries, house prices have grown faster than incomes and rents in almost half of the countries.

chart2_House price-to income and house price-to-rent ratios are highly correlated, as documented in the previous quarterly report.

chart2_ Turning to the Australia specific analysis, Adil Mohommad, Dan Nyberg, and Alex Pitt (all at the IMF) argue that house prices are moderately stronger than consistent with current economic fundamentals, but less than a comparison to historical or international averages would suggest. Here is just a summary of their arguments, the full report is available.

Argument: House prices have risen faster in Australia than in most other countries, suggesting, ceteris paribus, overvaluation.

OZ-House-Prices-to-GDPCounter argument 1: House prices are in line on an absolute basis – Price-to-income ratios have risen in Australia and now near historic highs. However, international comparisons suggest that Australia is broadly in line with comparator countries, although significant data comparability issues make inference difficult.
Counter argument 2: The equilibrium level of house prices has also risen sharply – Lower nominal and real interest rates and financial liberalization are key contributors to the strong increases in house prices over the past two decades. The various house price modeling approaches indicate that house prices are moderately stronger (in the range of 4-19 percent) than economic fundamentals would suggest.
Counter argument 3: High prices reflect low supply – Housing supply does indeed seem to have grown significantly slower than demand, reducing (but not eliminating) concerns about overvaluation.
Counter argument 4: It is just a Sydney problem, not a national one – The two most populous cities, Sydney and Melbourne, have seen strong house price increases, including in the investor segment. A sharp downturn in the housing market in these cities could be expected to have real sector spillovers, pointing to the need for targeted measures—including investor lending—to reduce risks from a housing downturn.
Counter argument 5: There are no signs of weakening lending standards or speculation – While lending standards overall seem not to have loosened, the growing share of investor and interest-only loans in the highly-buoyant Sydney market, is a pocket of concern.
Counter argument 6: Even if they are overvalued, it doesn’t matter as banks can withstand a big fall – While bank capital levels are likely sufficient to keep them solvent in the event of a major fall in house prices, they are not enough to prevent banks making an already extremely difficult macroeconomic situation worse.

Let us think about each in turn.

Thus, DFA concludes the IMF initial statement is correct, and despite their detailed analysis, their counterarguments are not convincing. We do have a problem.

Stronger New Dwelling Approvals in October

ABS figures released today show that building approvals increased by 3.9 per cent in October, the second consecutive month of growth, said the Housing Industry Association.

During October, total seasonally-adjusted new dwelling approvals rose to 19,652, the strongest monthly result since the all-time record high reached in July. The distribution of the growth was mixed, however; while multi-unit approvals increased by 10.1 per cent during October, detached house approvals fell by 2.1 per cent during the month. The back-to-back increases in approvals during September and October were the first consecutive monthly increases since the beginning of the year.

HIA-Approvals-October-2015During October 2015, total seasonally adjusted new home building approvals saw the largest increase in South Australia (+23.4 per cent), followed by New South Wales (+22.0 per cent) and Victoria (+21.2 per cent). Approvals fell in Tasmania (-41.6 per cent), Queensland (-28.7 per cent) and Western Australia (-1.1 per cent). In trend terms, approvals saw a 7.1 per cent increase in the NT but declined by 10.8 percent in the Australian Capital Territory.

Home Lending Rotation Continued In September

The latest home finance data from the ABS confirm the trend that investor loans are on the slide, and being replaced by growth in owner occupied loans and refinancing. In September, trend,  owner occupied housing commitments rose 2.0% to $20.5 bn while investment housing commitments fell 1.9% to $12.9 bn. The number of commitments for owner occupied housing finance rose 0.7% in September whilst the number of commitments for the purchase of new dwellings rose 1.3% the number of commitments for the purchase of established dwellings rose 0.8%. The number of commitments for the construction of dwellings fell 0.1%.

The proportion of investor loans fell back to 48%, whereas a few months back it was well above 50%. Refinance of owner occupied loans continues to rise, to nearly 20% of all loans written, a level not seen since 2012. So the relative shift away from investment loans is confirmed, in response to regulatory intervention.

Home-Loan-Flows-ABS-Sept-2015In stock terms, the mix of investment loans – as reported in original terms, has fallen back to 38%, but is still way higher than when regulators officially started to worry about the systemic risks of investment loans above mid thirties.  we can expect to see further data revisions in coming months, as banks continue to reclassify loans.

Home-Lending-Stock-ABS-Sept-2015Turning to first time buyers, the number of first home buyer commitments as a percentage of total owner occupied housing finance commitments fell to 15.4% in September 2015 from 15.8% in August.  However, this does not tell the full story.

FTB-Home-Loans-ABS-Sept-2015Looking at DFA adjusted data, to take account of first time buyers going direct to the investment sector, we see a further fall in new FTB investor loans, down more than 2% in the month. The number of FTB loans for owner occupation rose however, by 6%, so the overall volume of loans is up. The average FTB loan was 2% larger this month.

FTB-DFA-Sept-2015  The strategies of the banks are clear, focus on owner occupied loans, and offer deep discounts to wrest refinanced loans from competitors, whilst using back-book repricing to fund it. At what point will the regulators step-up their surveillance of owner occupied lending? We think they should do so now.


Building Approvals Fall In September

Australian Bureau of Statistics (ABS) Building Approvals show the number of dwellings approved fell 1.8 per cent in September 2015, in trend terms, and has fallen for six months.

Dwelling approvals decreased in September in Northern Territory (3.3 per cent), Western Australia (3.2 per cent), New South Wales (2.6 per cent), Victoria (1.8 per cent), Tasmania (1.2 per cent), Australian Capital Territory (0.7 per cent) and Queensland (0.3 per cent) but increased in South Australia (0.4 per cent) in trend terms.

In trend terms, approvals for private sector houses fell 0.2 per cent in September. Private sector house approvals fell in Western Australia (3.1 per cent) and New South Wales (1.2 per cent) but rose in Queensland (2.2 per cent) and Victoria (1.1 per cent). Private house approvals were flat in South Australia, in trend terms.

The value of total building approved fell 0.6 per cent in September, in trend terms, and has fallen for two months. The value of residential building fell 1.1 per cent while non-residential building rose 0.6 per cent in trend terms.

The root of Sydney and Melbourne’s housing crisis

From The Conversation.

As is well known, the shortage of affordable separate housing in Sydney and Melbourne means that most first home buyers and renters cannot currently find housing suited to their needs in locations of their choice.

The dominant response from the housing industry and commentators is that governments must unlock the potential for more intensive development of the existing suburbs. From this standpoint, the recent surge in high-rise apartment construction in Sydney and Melbourne is part of the solution.

For those looking at the issue from a financial perspective, escalating housing prices is seen as a reflection of low interest rates, as well as incentives for investors to take advantage of negative gearing and capital gains tax concessions. For the Australian Prudential Regulation Authority, this means the answer is to restrict access to borrowing.

While these factors are important in contributing to the affordability crisis in housing, the issue has deeper roots that lie in the changing demographic make-up of Sydney and Melbourne’s populations.

Our new study on new household and dwelling projections for Sydney and Melbourne from 2012 to 2022, highlights the need for rigorous academic research to inform public urban policy.

To date, policy has been driven by advice from commentators using a flawed evidence base. None have grasped the scale of need for family-friendly housing, or understood the full effects of ageing in place on the availability of detached houses in Sydney and Melbourne.

The projections build on the widely-assumed expectation that Net Overseas Migration (NOM) will continue at 240,000 to 2022 and that Sydney and Melbourne will receive almost of this number.

The household projections assume that the propensity to form households by age group and family type will remain the same as in 2011 in both cities. Projections for dwelling needs were then computed for both cities on the assumption that households will occupy the same type of dwelling (separate house, flat) by family type, age group and migration status in 2022 as was the case in 2011.

On these assumptions, Sydney will need to provide dwellings for an additional 309,000 households and Melbourne an additional 355,000 households over the decade 2012 to 2022.

The key finding is that contrary to most housing industry opinion, the greatest need will be for family friendly dwellings. This is because of the large number of young resident and migrant households who will be entering each city’s housing market. Most of these households are likely to start a family and when they do so, will look for a separate house.

Author provided
Author provided

It is true that there will be a large increase in the number of single person and couple families over the decade. However, most of this increase will be amongst older, already established households. The evidence indicates that the great majority are ageing in place. (See Table 11 in the report.)

The surge in the number of older households is a consequence of population ageing as successive ten-year cohorts replace smaller cohorts born in earlier years. This ageing effect is having an enormous but largely unrecognised effect on Sydney and Melbourne’s housing markets. It will generate the need for an additional 109,570 extra dwellings in Sydney over the decade to 2022 and 161,990 in Melbourne. In addition, net overseas migration will add a dwelling need of 198,810 in Sydney and 193,140 in Melbourne by 2022.

This combination of high dwelling needs of young residents as well as from NOM, along with the blocking effect of the ageing population, is contributing to a severe and continuing squeeze on the detached housing markets in Sydney and Melbourne. This is particularly marked in the inner and middle suburbs.

The reason is that, by 2011, 50 to 60% of this housing stock was occupied by householders aged 50 (See Table 10 in the report). This situation will get worse as the number of these older households increases.

The study compared the recent pattern of dwelling approvals by housing type in Sydney and Melbourne with the needs implied by the dwelling projections. The conclusion was that there are too few separate houses being approved in both cities and too many apartments, especially in Melbourne.

Current policies of urban renewal or urban consolidation in established suburbs will add little to the supply of affordable family friendly dwellings. This is primarily because of the increase in the price of potential building sites. There is a vicious circle in play as the scarcity outlined above contributes to further increases in the price of separate houses and thus to the cost of possible sites for higher density dwellings.

Implications

Because few families can afford detached housing in the inner and middle suburbs, more are being pushed into the outer suburbs and the fringes of Sydney and Melbourne. It is still possible to find such affordable housing in the outer and fringe suburbs of Melbourne, but not in Sydney. A detached house costs a minimum of $600,000 even in the remotest corners of Sydney. The only affordable option for most of these home seekers is a unit in these outer suburban locations.

There is no short term fix. In the long term more resident and migrant families are likely to seek affordable housing elsewhere, or in the case of migrants, may by-pass Australia altogether. Those who choose to stay will have to make adjustments to their life-style as by delaying starting a family.

On the other hand, a glut of high-rise apartments is inevitable, although it is being masked by the long lead time in the completion of newly approved apartment projects.

Author: Bob Birrell, Researcher , Monash University


Housing Affordability Deteriorates

The HIA Affordability Index for the September 2015 quarter indicates that housing affordability has deteriorated further, said the Housing Industry Association.

“Sluggish earnings growth and the strong pace of dwelling price growth in the two key markets means that home purchase moved beyond the reach of a greater number of Australian households,” explained HIA Senior Economist, Shane Garrett.

During the September 2015 quarter, housing affordability worsened by 4.0 per cent compared with the previous quarter and was 2.1 per cent less favourable than the same time last year. Developments in the eight capital cities were more detrimental from an affordability perspective, with a 4.1 per cent deterioration occurring compared with the previous quarter. Compared with a year ago, affordability in the capital cities is 3.6 per cent less favourable. However, affordability actually improved in six of the fourteen markets included in the report.

“Affordability is now at its least favourable since the final quarter of 2014,” noted Shane Garrett. “The two interest rate reductions in the first half of this year provided a temporary respite from the perspective of affordability,” Shane Garrett pointed out. “The surge in dwelling prices in Sydney and Melbourne, along with near stagnant earnings growth means that the pendulum has since swung backwards to the detriment of affordability.”

“Over 210,000 new dwellings were commenced during the 2014/15 financial year, an all-time high,” said Shane Garrett. “This remarkable pipeline of supply has helped soothe affordability pains in some markets. Were it not for the exceptional level of new home building, Australia’s affordability challenge would be even more severe.”

“In the round, the odds are still stacked far too heavily against the goal of more affordable housing. The burden of taxation on new housing is huge, which is exacerbated by chronic shortages of new residential land in key markets. This effect flows through to the existing housing stock in a way that puts potential buyers at a disadvantage. The unilateral increase in variable mortgage rates over the past month is further aggravating the situation,” concluded Shane Garrett.
Housing-Affordability-Sept-2015

New Home Sales Are Down – HIA

The HIA New Home Sales Report, a survey of Australia’s largest volume builders, showed monthly new home sales declined by 4.0 per cent in September 2015, with the level of activity down from the April peak by 5.2 per cent.

“The decline in total new home sales was reflected in both the detached and non-detached segments of the market in September 2015,” said HIA economist, Diwa Hopkins. “Following the peak level of sales that occurred in April this year, sales activity has trended lower only very modestly. This augers well for actual new home building activity in 2015/16. A fresh record level of building activity during this financial year could have been achieved – and could have been of strong benefit to the broader domestic economy – but increasingly restrictive credit conditions are likely to curtail the boom in new home building. The deterioration in credit conditions is likely to weigh more heavily on new home building activity beyond 2015/16. We have therefore pared back our forecasts for activity over our forecast horizon beyond the end of the current financial year.”

In the month of September 2015 detached house sales declined in four out of the five the mainland states. Detached house sales declined by 19.8 per cent South Australia, 8.6 per cent in Western Australia, 5.9 per cent in Queensland and 0.5 per cent in New South Wales. In Victoria, detached house sales increased by 3.1 per cent.

HIA-New-Home-Sales-Sept-2015