National Residential Land Sales Increased by 17.6 per cent to June 2015

The latest HIA-CoreLogic RP Data Residential Land Report provided by the Housing Industry Association, and CoreLogic RP Data, shows there was some relief from the tight conditions in Australia’s residential land market in the June 2015 quarter.

In the June 2015 quarter, national residential land sales increased by 17.6 per cent, while the weighted median residential lot price increased by 0.6 per cent over the quarter to be 5.2 per cent higher than 12 months earlier.

“Today’s update shows that a rise in land sales was accompanied by an easing off in the pace of price increase in Australia’s residential land market,” said HIA economist, Diwa Hopkins. “This compares with previous quarters which saw strong price increases amid declining land sales.”

“While the June quarter result is an encouraging development, what needs to occur is similar results being sustained over the longer run. That is, a larger and more consistent flow of shovel-ready land needs to be brought online.”

“For this to happen, policy reform needs to address the key land supply bottlenecks including unnecessarily long planning delays; slow and insufficient release of residential land; excessive and inappropriate infrastructure funding arrangements, and; excessive zoning restrictions,” added Ms Hopkins.

According to CoreLogic RP Data research director, Tim Lawless, the break in the trend of declining land sales is a positive outcome after three consecutive quarters of declining sales.

“A 17 per cent jump in vacant land sales is impressive, but land sales remain lower than the June quarter of last year and comes after three quarters where volumes consistently fell and prices rose. The most encouraging sign is that this quarterly rise in vacant land sales is broad based with five of the six states showing a substantial boost in sales.”

“With detached housing approvals remaining relatively flat since early 2014, the likelihood of this recent surge in vacant land sales developing into a stronger trend is unlikely.”

Residential Building Work Higher

The ABS released their Building Activity to June 2015. Residential building rose in the quarter on a trend basis. Victoria shows the greatest momentum currently. We may be reaching “peak construction”, but there is little to indicate an impending fall at the moment.

The trend estimate of the value of total building work done rose 1.5% in the June 2015 quarter. The trend estimate of the value of new residential building work done rose 2.5%, with value of work done on new houses up 2.2% and other residential building up 3.0%.

Work-Done-June-2015The state mix is interesting, with Victoria the largest contributor at $4.5bn, against NSW $4.0bn, helped by large volumes of units being constructed.

ResidentialByStateJune2015 The trend estimate of the value of non-residential building work done fell 0.1% in the June quarter.

The total number of dwelling units commenced rose 0.6% following a rise of 1.9% in the March quarter.

The trend estimate for new private sector house commencements fell 0.8% in the June quarter following a fall of 0.2% in the March quarter.

The trend estimate for new private sector other residential building commencements rose 0.6% in the June quarter following a rise of 3.0% in the March quarter.

Home Sales Higher In August – HIA

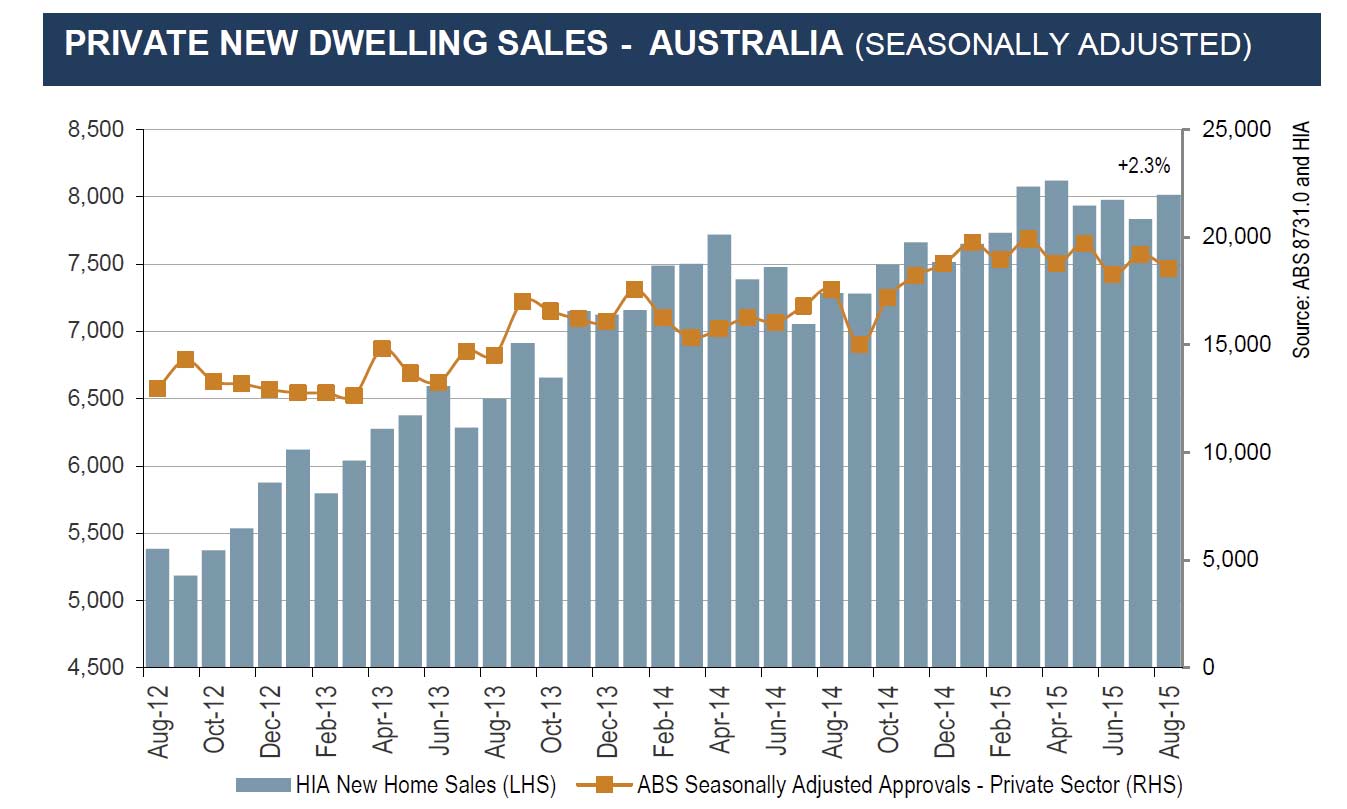
The HIA New Home Sales Report, a survey of Australia’s largest volume builders, recorded an increase in August 2015, with the level of activity only just short of the high reached in April this year. They report a decline in unit sales, but a rise in houses.

“Total seasonally adjusted new home sales increased by 2.3 per cent in August this year, driven by a 3.5 per cent rise in detached house sales,” said economist, Diwa Hopkins. “Multi-unit sales, however, declined by 1.7 per cent.”

“It is becoming increasingly apparent that total sales activity has already peaked this year, but today’s update shows that sales are remaining elevated.”

“The overall developments in both HIA New Home Sales and the equivalent ABS measure, building approvals, are consistent with our outlook for actual new home building activity in 2015/16.”

“We’re forecasting total dwelling commencements to ease back from what we expect to have been the peak level in the financial year just passed, but still remain elevated.”

Detached house sales increased by 3.5 per cent in August 2015, but were 5.1 per cent below the monthly peak that occurred back in April 2014. For ‘multi-units’, it is May 2015 that is shaping up to represent a peak in monthly sales, with declines occurring in each of the subsequent months. Multi-unit sales in August this year were down from the May level by 8.5 per cent.

In the month of August detached house sales increased in four out of the five the mainland states. Detached house sales increased by 10.2 per cent South Australia, 7.0 per cent in Queensland, 3.2 per cent in New South Wales and 3.4 per cent in Victoria. In Western Australia, detached house sales declined by 1.4 per cent.

HIA-Sales-August-2015

Building Approvals Fall Again

Australian Bureau of Statistics (ABS) Building Approvals data shows that the number of dwellings approved fell 0.7 per cent in August 2015, in trend terms, and has fallen for five months.

Dwelling approvals decreased in August in Tasmania (6.8 per cent), Victoria (4.2 per cent), Western Australia (1.8 per cent), Northern Territory (0.6 per cent) and Queensland (0.2 per cent) but increased in the Australian Capital Territory (8.1 per cent), South Australia (4.5 per cent) and New South Wales (1.4 per cent) in trend terms.

In trend terms, approvals for private sector houses fell 0.1 per cent in August. Private sector house approvals rose in Queensland (2.0 per cent), New South Wales (0.4 per cent) and South Australia (0.2 per cent) but fell in Western Australia (2.8 per cent). Private house approvals were flat in Victoria, in trend terms.

The value of total building approved rose 0.8 per cent in August, in trend terms, and has risen for four months. The value of residential building rose 0.2 per cent while non-residential building rose 2.1 per cent in trend terms.

Blaming the baby boomers for the housing crisis ignores the real issue: a lack of supply

From The Conversation.

Baby boomers have a greater share of the UK’s wealth than any previous generation in the modern era. And unlike their parents and grandparents, the boomer generation also holds a much higher share of this wealth in housing. Meanwhile, with house prices high relative to their incomes, many younger people and families are are unwilling or unable to accrue wealth through home ownership. Increasingly, 25 to 34-year-olds rent.

This housing wealth inequality between the generations seems unfair. But can we blame the housing wealth of the boomers for preventing younger generations from getting on the property ladder? While baby boomers have generally profited from rising property values, the real reason for the UK’s housing problem is a lack of supply.

Boomer beneficiaries

The boomer generation mostly owned their homes already before the housing boom started around 2001, as shown in the chart below. So they got to enjoy the wild ride in house values with relatively little debt to pay off. Meanwhile, wealth inequality across generations increased during this period.

Home ownership rates by age and birth cohort. IFS calculations using Family Expenditure and Family Resources surveys.

Younger households either managed to buy when prices were high with the help of large mortgages only to see their house value drop, perhaps, during the subsequent bust that began in 2008. Or, if they hadn’t got on the ladder yet, the falling earnings and rising credit standards of the post-financial crisis years meant they were then unable to climb onto the ladder at all.

Not the boomers’ fault

Now, with house values again rising faster than earnings around London, it is perhaps irritating to some that so many older households sit in underused homes, while younger generations struggle to find affordable housing. The Intergenerational Foundation is particularly upset. But for the most part, this isn’t the boomers’ fault.

The relatively large climb in home values is mostly the result of a restricted supply of housing combined with demand factors that are largely unrelated to the ageing of Britain’s population. While older households have benefited from this confluence, they share only perhaps some indirect blame for it.

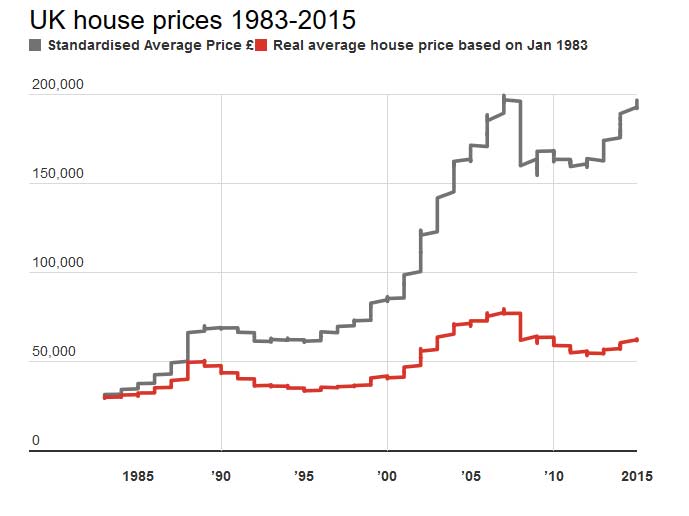
Boom1House prices rose sharply across England from 1996 to 2005, hugely benefiting the many boomers that had bought their homes during the previous decade. This turn of the millennium boom was the result of rising demand for a limited supply of housing stock. This was in turn fuelled by a number of smaller national trends including relaxed lending standards, increased immigration and, at least initially, widespread growth in household incomes and wealth. Perhaps underneath all this were “exuberant expectations” of continued out-sized capital gains. Changing demographics, a much lower-frequency phenomenon, probably contributed little to the demand-side push on house prices.

Geographic evidence

Since the subsequent housing bust, London has claimed the lion’s share of the increase in English house prices. Much of England north of London has seen relatively little – if any – increase in prices since then. This does not match up with where the majority of baby boomers are – they have been ageing in the wrong place to be the cause of this southerly tilt in the housing recovery.

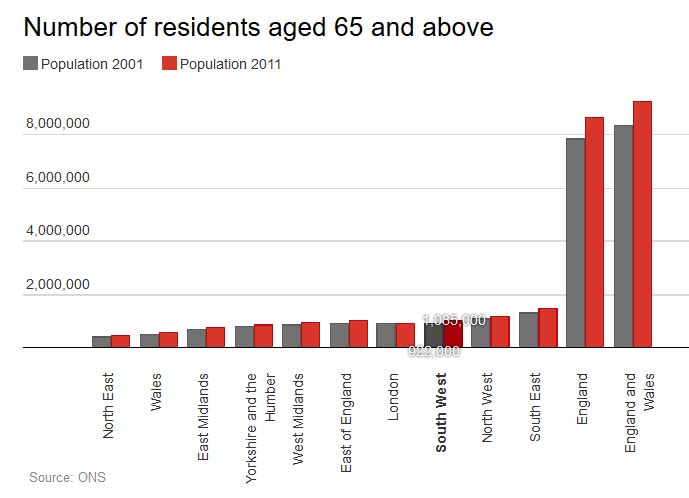
Outside of London, England and Wales are getting older:Boom2The young are moving in droves to London. If anything, those grandparents with all their superfluous bedrooms in the villages in the north are the only ones keeping the lights on (and keeping house values from collapsing). Instead, the London-based recovery in house values relies on youth and foreigners. The young want to live in London and foreigners want to invest in it.

All the above factors have been shifting housing demand. If Britain would simply build more houses, prices needn’t have responded so drastically to this rising demand. Of course, the British housing supply problem has long been known.

Moreover, if Britain built more houses, it could build them in the places most needed and with the specifications most demanded. Supply should expand more rapidly in London and the south-east, where demand is highest. Plus, Britain’s ageing population and shifting social norms has created an ever larger demand for housing better suited to the needs of older households. Older households would be far more likely to downsize if this kind of retirement housing were built.

Supply blockers

Of course, older households, who are more likely to vote as well as to own, probably do bear some responsibility politically for blocking supply. Voting homeowners, and disproportionately so older homeowners, tend to disapprove of politicians that approve new building in their neighbourhoods. This has led to brazen political cycles in construction, which perverts the planning process, misallocates housing and raising prices.

Picture a retired couple in their mid-60’s, with children who’ve long since moved out and grandchildren who may just be old enough to visit the odd week during the summer, an empty bedroom or two still furnished with their parents’ childhoods dustily waiting for them. Barring a large change in circumstance, this couple will likely stay in their family home for many years. They know their neighbourhood. The furniture they’ve collected over the years fits just so in their present space. And if they own the average house in England, its value has grown a bit under 4% (in real, inflation adjusted, terms) on average for the last 20 years.

Over the next decade, as the boomer generation slowly ages into its golden years, the UK will have more and more of these households. Given the many risks they face and the relatively few housing choices available to them, clinging on to a house that is too large for their everyday needs is mostly rational.

Besides their pension, a house is far and away the largest store of wealth for those in their 60’s and beyond. Releasing equity by downsizing to a smaller home in a new location may be attractive in theory but there are high transaction and psychological costs in these moves. And, besides, with house prices generally growing again, the returns to be had from staying are too tempting.

Rather than using economic incentives (such as capital gains and stamp taxes) to lever boomers into smaller houses, Britain should look to correct the misaligned political and economic incentives that local councils have to block new housing from being built.

A healthy housing market with the right policies would channel the huge foreign desire to invest in English housing towards building homes for younger (and older) households. House prices would be less buoyant. Retirees with “too much house” would downsize of their own volition, in turn releasing equity for their own consumption and putting a family home back into the market for a new generation to enjoy.


This article is part of a series on What’s next for the baby boombers?

r: Jonathan Halket, Lecturer in Economics at University of Essex


So, Is Housing Lending On The Turn?

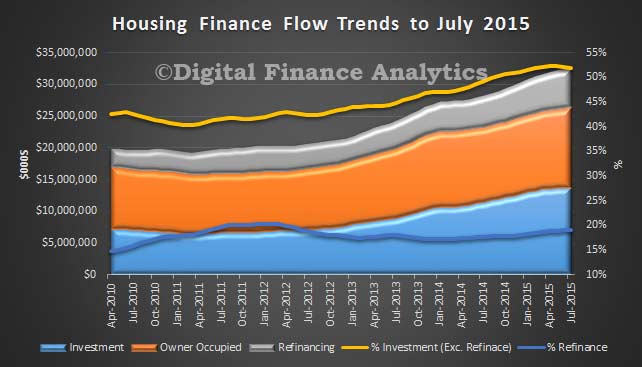
The ABS data on housing finance today suggests that the momentum in housing is shifting, as the tighter restrictions on investment lending bites; this despite strong market demand and the fact that investor property finance has never been higher at 38.9%.  Looking at the monthly flow trend data, lending overall rose 0.52% in the month, by $169 m. Within that, monthly approvals data shows that owner occupied lending rose 0.84% (up $105 m from last months approvals), refinancing up 0.72% ($44 m) and Investment lending up 0.14% ($19 m). In seasonally adjusted terms, the total value of dwelling finance commitments excluding alterations and additions rose 1.5%.

Housing-Flows-July-2015Within these numbers, we see that owner occupied construction fell 1% compared with last month, owner occupied new property purchases rose 2.24%, owner occupied refinance rose 0.72% and owner occupied “other” purchases rose 1%. On the investment side of the equation, investment purchases by individuals fell 0.47%, whilst investment construction rose 4.3% and investment by other entities (including SMSFs) rose 2%. Still momentum, but the investment sectors is shifting. We expect to see ongoing strong demand from the SMSF sector.

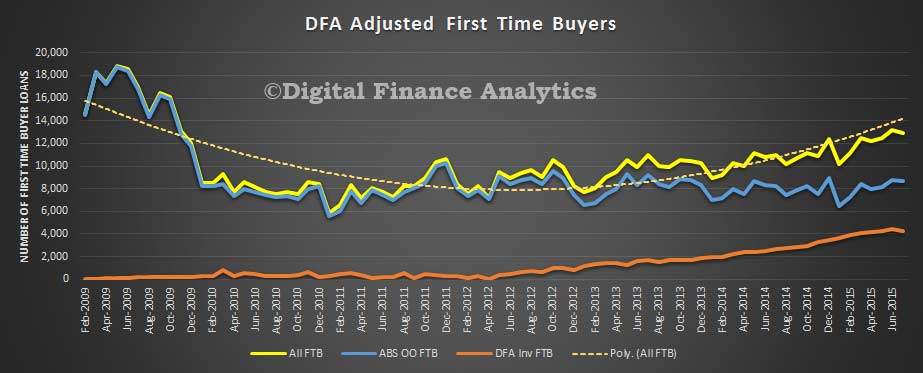
Housing-Flow-Movements-July-2015Looking at first time buyers, both the original data from the ABS, shows a small fall in the month to 15.4% in July 2015 from 15.8% in June 2015, and the DFA data for investor FTB also fell. The number of first time buyers are still sitting at around 12,000 a month in total, still well below the peaks in 2009. Our surveys indicate strong FTB investor appetite. The changed underwriting requirements however are having an impact.

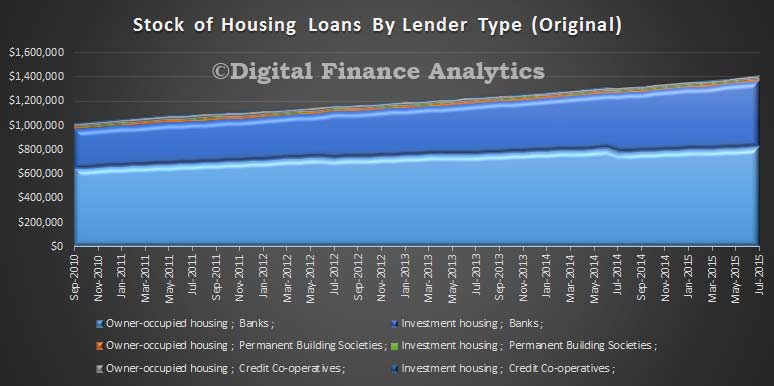
FTB-Adjusted-July-2015Looking at the loan stock data, the major banks still have the lion’s share, but we see that on the investment side, credit unions grew their books the largest in percentage terms, with a 1.1% rise in investment loans (compared with a rise of 0.52% by the banks and 0.68% for the building societies).  We suspect some investors are switching to smaller banks, credit unions and the non-bank sector when they find the larger players less willing to lend. Overall growth on the owner occupied side was 0.43%.

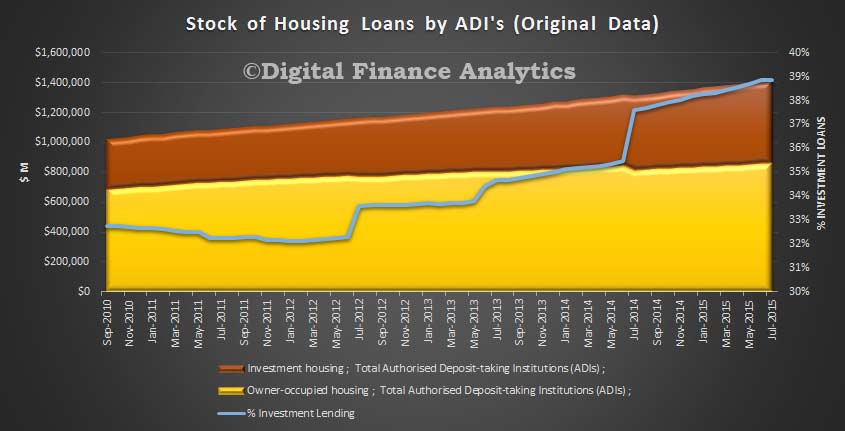
Housing-Loan-Stocvk-By-Lender-Type-July-2015Finally, looking at the overall stock of loans, we see that investment loans now make up a record 38.9% of the total portfolio, thanks partly to the recent restatement of loan types by some the banks. We think this is too-higher share of housing lending (it is more risky in a down-turn) and the banks 60% total loan portfolio in housing is also too high, sucking finance from business sectors which might contribute to real economic growth.

Stock-Housing-Loans-July-2015

Property developers pay developer charges, that’s why they argue against them

From The Conversation.

A good rule of thumb in debates on who bears the economic cost of a policy change is to look at the positions taken by vested interests in the matter. If anyone is going to know if they bear the cost, it is those who pay. In the case of infrastructure charges on new property developments, the vocal objections from the property industry are a sure sign that they bear the economic costs.

Infrastructure charges are levied by local governments on developers of new land estates, based on an increased load on essential infrastructure services the council is responsible for.

A research paper reported in The Conversation recently claimed that property developers could pass on these charges in the price of new homes with a mark-up of 400%. The paper also claimed that these charges had the same price effects on existing homes, meaning that new home buyers ultimately bear the cost of infrastructure charges, rather than developers.

But the logic of this should be challenged and is not borne out in the results of other rigorous academic studies of infrastructure charges, which have in fact found the opposite.

The idea that costs of developer charges can be passed on through new home prices sounds intuitive. But it is based on an incorrect notion that prices are determined by costs.

In fact, developers already charge the maximum the market will bear. To not do so would be the equivalent of selling your house for half the market price, just because it only cost you that amount 10 years ago when you bought it. You wouldn’t do it, and nor would a developer.

Using a statistical analysis of a simple regression of home prices with developer charges, along with many hedonic control variables – as this study has – will find a positive correlation simply because charges are set in proportion to housing size. But that isn’t a causal relationship.

As Ian Davidoff and former academic economist (now the ALP’s shadow assistant treasurer) Andrew Leigh succinctly describe in their study on how stamp duty affects the market:

…if one were to simply regress the sale price on the tax payable on that property, the coefficient would capture both the mechanical fact that the tax amount is a function of the price, as well as any behavioural impact of taxes on prices.

It’s true that observations of this mechanical relationship have been widely interpreted as a behavioural effect in the literature on developer charges. But the best analysis does not interpret such results in this way.

A better way to observe behavioural impacts is take advantage of natural experiments, such as when a developer charge is increased in one area but not in a comparable adjacent area, then look at any subsequent price changes compared to the “control group”.

These types of natural experiments can alternatively be attempted with statistical controls, and a recent paper does just that when looking at the house price effects from additional costs imposed to finance infrastructure.

They find that not only are proper statistical controls very difficult to implement, but that prices decrease per dollar of additional infrastructure charge by somewhere in the range of $0.33 to $2.09.

This range captures the standard view that costs cannot be passed on in prices, which in the case of developer charges means that the developer or previous landowner bears the full cost of the charge, and not the home buyer. Davidoff and Leigh’s controlled results support this view on the incidence of stamp duties in Australia.

These more properly controlled results are consistent with the political actions of the property industry who oppose developer charges because they bear the full cost.

Why is all this important? Vested interests benefit from any illusion of unsettled academic debate. In the case of developer charges the property lobby can maintain an intelligent-sounding “Goldilocks” view in public debates that goes something like this: “The research is not settled. But it is likely that we don’t pay the full charge, nor do we pass it on completely in home prices. The cost is probably shared between us and the homebuyer.”

They capitalise on this apparent uncertainty by claiming that their interests are aligned with the home-buying community; a seductive “Goldilocks” view that is hard for politicians to ignore.

Author: Cameron Murray, Economist at The University of Queensland

Building Approvals Fell 0.7% In July

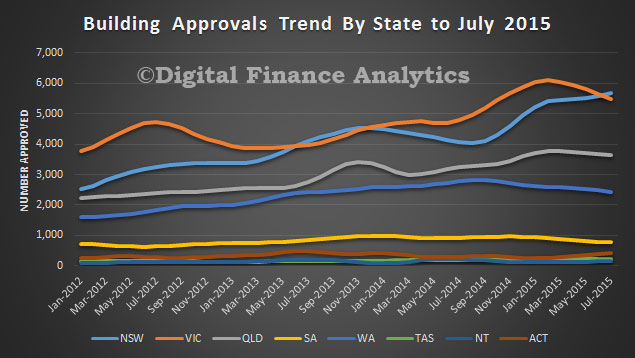
The Australian Bureau of Statistics (ABS) Building Approvals show that the number of dwellings approved fell 0.7 per cent in July 2015, in trend terms, and has fallen for five months.

Dwelling approvals decreased in July in Tasmania (5.6 per cent), Victoria (3.1 per cent), South Australia (2.1 per cent), Western Australia (1.8 per cent) and Queensland (0.8 per cent) but increased in the Northern Territory (7.3 per cent), Australian Capital Territory (4.4 per cent) and New South Wales (1.9 per cent) in trend terms.

BuildingApprovalsJuly2015BySTate
In trend terms, approvals for private sector houses fell 0.5 per cent in July. Private sector house approvals fell in Western Australia (2.3 per cent), Victoria (1.5 per cent) and South Australia (1.4 per cent) but rose in Queensland (1.2 per cent) and New South Wales (0.8 per cent).

The value of total building approved rose 0.6 per cent in July, in trend terms, and has risen for three months. The value of residential building fell 0.4 per cent while non-residential building rose 2.9 per cent in trend terms.

New Home Sales Past Peak – HIA

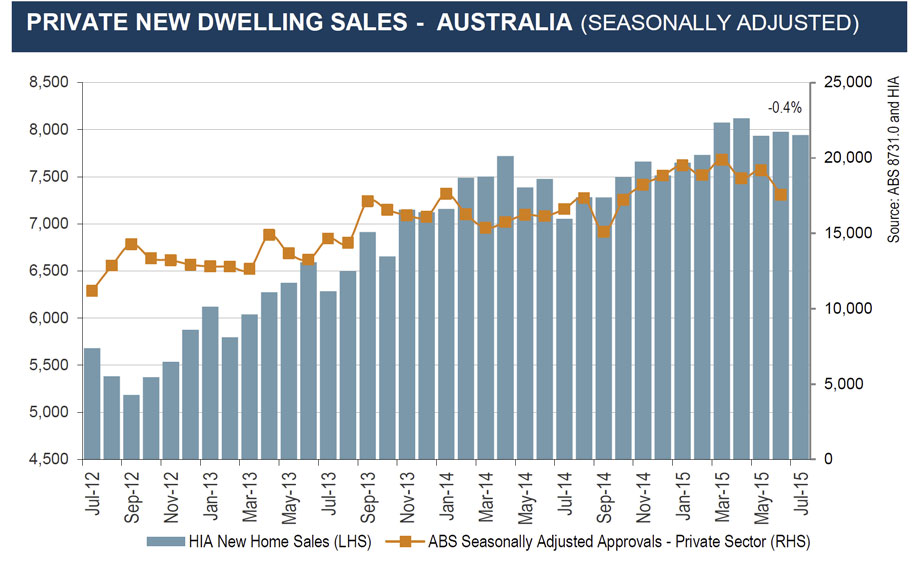
The HIA New Home Sales Report, a survey of Australia’s largest volume builders, showed a very modest decline of 0.4%. HIA say key leading indicators of home building, including HIA New Home Sales, suggest little prospect for further growth in new home construction in 2015/16.

Detached house sales increased by 0.7 per cent in July this year. The annual peak for detached house sales has passed. Over the three months to July this year detached house sales fell by 2.8 per cent to be 3.4 per cent lower when compared to the three months to July 2014. ‘Multi-unit’ sales peaked in May this year and fell by 4.2 per cent in July following a decline of 2.9 per cent in June. Over the three months to July this year multi-unit sales increased by 8.3 per cent, but it was the strength of the May result that drove the quarterly outcome.

In the month of July 2015 detached house sales increased by 4.2 per cent in New South Wales. Detached house sales fell by 2.3 per cent in Victoria and by 4.9 per cent in Western Australia. Sales were close to flat for the month in Queensland (-0.6 per cent) and South Australia (-0.2 per cent).

HIAHomeSalesJuly2015

New Home Sales Still Strong – HIA

The HIA New Home Sales Report, a survey of Australia’s largest volume builders, recorded its fifth rise in six months in June 2015. Total seasonally adjusted new home sales increased by 0.5 per cent in June. Detached houses drove the modest increase in new home sales with a 1.7 per cent rise offsetting a 2.9 per cent decline in the sale of multi-units.

The HIA say New South Wales and Victoria continue to display upward momentum in detached house sales, but the other three mainland states are heading in the opposite direction. In the month of June 2015 detached house sales increased by 3.5 per cent in NSW, 1.5 per cent in Victoria, and 4.2 per cent in Queensland. Detached house sales fell by 2.0 per cent in South Australia in June, while in Western Australia sales eased by 0.9 per cent. In the June 2015 quarter detached house sales increased by 7.9 per cent in NSW and 0.6 per cent in Victoria. Sales fell for the quarter in Queensland (-7.0 per cent), SA (-10.2 per cent), and WA (-3.1 per cent).

HIANewDwellings-June-2015