Land Supply Shortages are Shutting Out Home Buyers – HIA

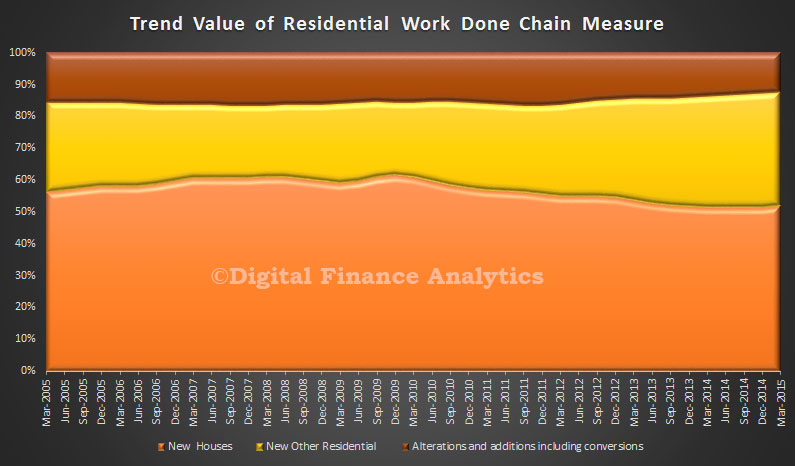
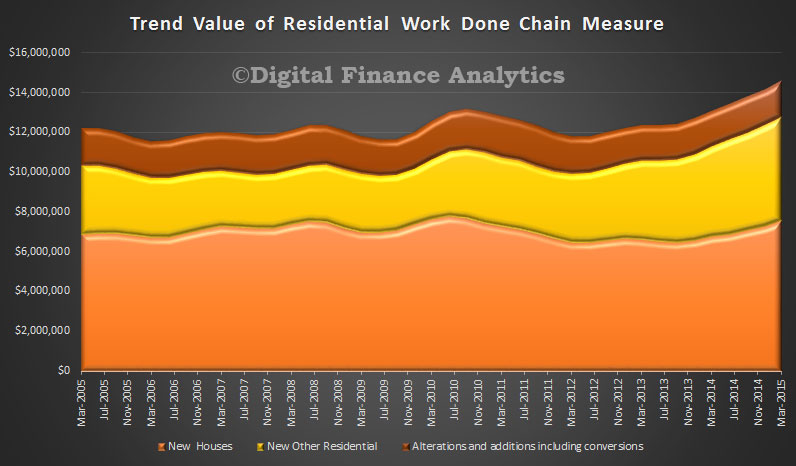
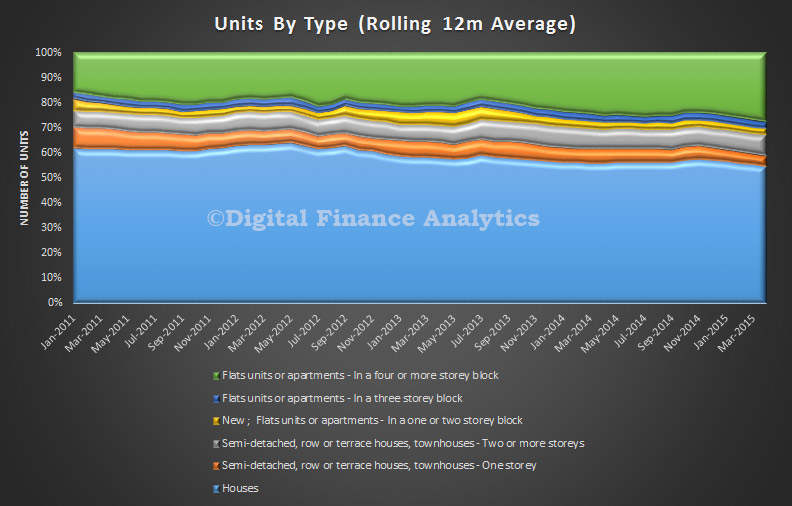
The HIA-CoreLogic RP Data Residential Land Report to the March 2015 quarter shows price growth accelerating as turnover falls sharply. The residential land price in Australia increased by 4.1 per cent compared with the previous quarter whilst residential land transactions fell by 5.2 per cent compared with the previous quarter. Higher land prices translate to more expensive housing, and is pricing new home buyers out of the housing market as well as capping the construction cycle.

“This is not a good combination – escalating residential land values and a related decline in sales volumes,” said HIA Chief Economist, Harley Dale. “The upcycle in detached and low density housing construction has been strong, without being stellar. The combination of significantly reduced turnover and strong price growth suggests that supply bottlenecks in residential land are intensifying. That is pricing new home buyers out of the housing market and capping the construction cycle at a lower level than would otherwise be the case.”

“The provision of adequate, affordable, shovel-ready land is a crucial element to addressing housing affordability pressures across the residential property market,” said Harley Dale. “More needs to be done to expedite supply in 2015/16. Removing the obstacles to affordable land supply is a core requirement of a successful taxation and federalism white paper reform process.”

During the March 2015 quarter, the residential land price in Australia increased by 4.1 per cent compared with the previous quarter. This represented an increase of 8.2 per cent compared to the same quarter of last year.  to be 17.6 per cent lower than the same period 12 months earlier. The March 2015 quarter represents the third consecutive decline in land transactions in Australia.

According to CoreLogic RP Data research director, Tim Lawless, the trend towards fewer land sales has been evident since mid-2013 and is visible across each of the capital city vacant land markets. “The number of vacant land sales peaked over the June 2013 quarter and have since reduced by almost 30 per cent. To see the price of land consistently rising over the same time frame suggests low supply is the main driver of this price growth rather than a slowdown in demand.”

“Higher land prices translate to more expensive housing which is an unfortunate circumstance for those looking to purchase a detached house. Sydney stands out as the most expensive land market with a rate per square metre of $678, followed closely by Perth with a rate per square metre of $664.”

Residential Building Growth All About Units

The ABS issued their March 2015 data on Building Activity. The trend estimate of the value of total building work done rose 2.0% in the March 2015 quarter. The trend estimate of the value of new residential building work done rose 3.6% in the March quarter. The value of work done on new houses rose 3.9% while new other residential building rose 3.1%. The trend estimate of the value of non-residential building work done was flat in the March quarter. The most striking trend is the continued relative growth in the value of units, versus houses.

ResidentialWorkDonePCMarch2015It was a strong result, reflecting the speculative demand for investment property.  The data says 53,900 dwellings were commenced during the March 2015 quarter. Units = ‘other dwelling’ commencements (predominantly multi-unit) jumped by 19.2 per cent to 25,140 whilst detached dwelling commencements were steady, increasing by 0.7 per cent in the March 2015 quarter to 28,761. Victoria was a stand out with more than 9,000 multi-unit dwellings started in the quarter, which is a record. In the part year, March 2015, almost 205,000 new dwellings were commenced, and breaking the 200,000 barrier for the first time.

ResidentialWorkDoneMarch2015There are some significant state variations, new home starts increased in New South Wales (up by 1.9 per cent), Victoria (up by 18.8 per cent), Queensland (up by 20.9 per cent) and the Northern Territory (up by 12.0 per cent). But there were significant declines, most notably in South Australia, down 18.0 per cent, Western Australia (down by 4.8 per cent), Tasmania (down by 14.7 per cent) and the ACT (down by 14.4 per cent).

Now, here is the thing. Property building has gained significant momentum at a point where investment mortgage lending is being tightened, and consumer confidence is falling. We wonder whether the supply demand balance is about to swing, with more property on offer than capable purchasers.

Building Approval Trends Flat

The ABS released their data on Building Approvals for May 2015. Using our preferred data view, trend, which irons out some of the variables, the estimate for total dwellings approved fell 0.1% in May after rising for 11 months. The trend estimate for private sector houses approved rose 0.1% in May and has risen for six months. The trend estimate for private sector dwellings excluding houses was flat in May after rising for 11 months. The trend estimate of the value of total building approved fell 0.9% in May and has fallen for three months. The value of residential building rose 0.1% and has risen for 11 months. The value of non-residential building fell 3.4% and has fallen for five months.

Overall levels of approvals are still running higher than anytime this century, thanks to the growth in units, which we this are correlated to the high demand for investment property. High density development is more profitable for builders, and we know demand remains strong in the current low interest rate environment from local and international purchasers. The fall in the AU dollar makes foreign investment even more attractive. However, high volume builds, constructed for profit, will tend to degrade quite quickly, and compliance to building regulations will not necessarily be sufficient to ensure quality long term homes.

Building-Approvals---May-2015Comparing the seasonally adjusted estimate for total dwellings approved rose 2.4% in May following a fall of 5.2% in the previous month. The seasonally adjusted estimate for private sector houses fell 8.4% in May after rising for two months. The seasonally adjusted estimate for private sector dwellings excluding houses rose 16.6% in May following a fall of 16.9% in the previous month. The seasonally adjusted estimate of the value of total building approved rose 2.1% in May following a fall of 3.1% in the previous month. The value of residential building rose 3.3% following a fall of 3.7% in the previous month. The value of non-residential building fell 1.1% and has fallen for two months.

These seasonally adjusted series are too volatile to draw any conclusions, in DFA’s view, though others will I am sure prefer to focus here!


Strong Dwelling Approvals in May – ABS

According to the latest ABS data, released today, during May 2015, total new dwelling approvals rose by 2.4 per cent to 19,414 in seasonally-adjusted terms, compared with 18,964 in April. An uplift in multi-unit approvals saw a 15.1 per cent rise during May although detached house approvals fell by 8.5 per cent. A total of 218,442 approvals were recorded in the year to May, which is a new record for approvals over any twelve-month period since records began in 1983.

There were significant state variations with seasonally-adjusted new dwelling approvals strongest increase in Victoria (+11.0 per cent), followed by New South Wales (+8.8 per cent) and Queensland (+3.6 per cent). A slight increase was also recorded in Western Australia (+0.2 per cent). New dwelling approvals fell significantly in Tasmania (-32.6 per cent) and in South Australia (-9.9 per cent).

New Home Sales Falter in May – HIA

The HIA New Home Sales Report, a survey of Australia’s largest volume builders, recorded the first decline for 2015 in May. The four month winning streak came to a modest end in May 2015 with total seasonally adjusted new home sales falling by 2.3 per cent. The decline was driven by a 5.1 per cent dip in detached house sales, reflecting weaker monthly demand in four out of the five states surveyed. DFA observes that the rotation from houses to units continues to build momentum, in answer to the demand for investment property, where returns to builders are also higher.

The mature stage of the new home building cycle primarily reflects further momentum in the ‘multi-unit’ sector, together with persistence of healthy conditions in New South Wales and Victoria. New sales of multi-units increased by 7.6 per cent during the month to yet a new record level, with sales volumes up by 26.7 per cent over the three months to May. Meanwhile strength in detached houses sales is evident in NSW and Victoria, with growth in the May 2015 ‘quarter’ of 5.2 per cent and 6.2 per cent, respectively.

HIA-May-2015In the month of May 2015 detached house sales increased by 3.3 per cent in Queensland, but fell by 2.3 per cent in NSW, 9.9 per cent in Victoria, 5.2 per cent in South Australia, and 8.1 per cent in Western Australia. In the May 2015 quarter, detached house sales increased in NSW (+5.2 per cent) and Victoria (+6.2 per cent). Sales fell over the three month period in SA (-8.1 per cent), Queensland (-7.5 per cent), and WA (-1.3 per cent).

Stamp Duty One Part of a Bigger Problem for Housing – HIA

The residential building industry is being weighed down by excessive and inefficient taxation, beyond just Stamp Duty, says the Housing Industry Association (HIA).

In some states the total tax bill amounts to over 40 per cent of the final price of a new home, taxes on new housing are a brake on economic activity, and represent a constraint on housing affordability and labour productivity.

There is no question that Stamp Duty is one of the key offenders, with research undertaken last year for HIA by Independent Economics identifying it as is the most inefficient tax in Australia’s entire taxation system.  As a tax on moving, it discourages households from relocation when this decision may better suit their needs in terms of size, location or employment opportunities. Unfortunately, the economy and the community do not get the best use out of the available housing stock. “However, there are many other taxes on new homes including developer infrastructure levies, which can be over $70,000 on a new house and land package, and which unfairly require new home buyers to fund community assets upfront.

Equally, GST is levied on new homes but not existing properties. Adding tens of thousands of dollars on a new home, GST creates a price differential between new and existing residential properties, which hits affordability, supply, employment and economic activity. Affordability is further eroded by the cascading effect of ‘taxing taxes’, whereby a tax such as stamp duty is levied on an amount that already includes a range of other costs. GST on infrastructure levies alone can add more than $5,000 to the final cost of a new home, while stamp duty on the total GST adds around $3,000. Infrastructure charges, GST and stamp duty add $140,000 and more to the cost of a new home in Sydney, while a plethora of other taxes, levies, fees, changes, rates and duties take the total tax grab to over 40 per cent of a new house and land package.

Taxes add more than $250,000 to the price of a new home in Sydney, accounting for 40 per cent ($1,350 per month) of repayments for the life of a home mortgage.  Incredibly, in supplying shelter for Australians, residential building contributes 13 per cent of all GST revenue collected by the Commonwealth. Sadly, that taxation revenue drives up the cost of housing.

Building Approvals Down In April – ABS

Australian Bureau of Statistics (ABS) Building Approvals show that the number of dwellings approved fell 0.4 per cent in April 2015, in trend terms, after rising for ten months. Whilst the number of houses approved rose, we still see a hike in the volume of high-rise developments.

Dwelling approvals decreased in April in the Northern Territory (6.2 per cent), South Australia (2.3 per cent), Victoria (0.8 per cent), Queensland (0.8 per cent) and Western Australia (0.6 per cent) but increased in the Australian Capital Territory (8.4 per cent), Tasmania (4.3 per cent) and New South Wales (0.1 per cent) in trend terms.

ApprovalsApril2015States In trend terms, approvals for private sector houses rose 1.1 per cent in April. Private sector house approvals rose in New South Wales (2.8 per cent), South Australia (2.0 per cent), Victoria (0.8 per cent) and Western Australia (0.8 per cent) but fell in Queensland (0.5 per cent). This was the largest rise since 2010.

ApprovalsApril2015HousesHowever, we continue to see a steady rise in the relative proportion of high-rise dwelling approvals.

ApprovalsApril2015TypePC The value of total building approved fell 1.0 per cent in April, in trend terms, and has fallen for two months. The value of residential building fell 0.1 per cent while non-residential building fell 3.3 per cent in trend terms.

HIA New Home Sales Push Higher in April

The latest result for the HIA New Home Sales Report, a survey of Australia’s largest volume builders, reveals a fourth consecutive monthly rise. New homes sales have increased in each of the first four months of 2015.  The April result for total seasonally adjusted new home sales comprised of two small gains, 0.4 per cent for detached house sales and 0.9 per cent for multi-unit sales. In terms of detached house sales, both NSW and Victoria posted monthly gains in April (as did Western Australia), although Queensland recorded a disappointing decline. Sales in South Australia continued to weaken and are at an 18-month low

In April 2015 private detached house sales increased by 7.2 per cent in New South Wales, by 2.7 per cent in Victoria, and by 0.9 per cent in Western Australia. Private detached house sales dropped by 9.0 per cent in Queensland and were down by 1.9 per cent in South Australia. In the April 2015 ‘quarter’, detached house sales increased in NSW (+0.5 per cent) and Victoria (+7.4 per cent), but declined in SA (-4.7 per cent), Queensland (-4.4 per cent) and WA (-1.6 per cent). This profile is broadly consistent with HIA forecasts for detached house commencements, with the exception of Queensland which is looking weaker than expected.

HIA-Sales-April2015

Investor Loans Still Hot – ABS

The ABS released their housing finance data to March 2015. Pretty common story, with the trend estimate for the total value of dwelling finance commitments excluding alterations and additions rising 0.8%. Owner occupied housing commitments rose 0.8% and investment housing commitments rose 0.8%.  In trend terms, the number of commitments for owner occupied housing finance rose 0.4% in March 2015.

In trend terms, the number of commitments for the purchase of established dwellings rose 0.7%, while the number of commitments for the construction of dwellings fell 1.4% and the number of commitments for the purchase of new dwellings fell 0.1%. The growth in investor property loans continued, with more than half in March (excluding refinance). Refinancing also grew in value and in percentage terms, from 18% of all loans a year ago, to over 20%, stimulated by ultra low rates.

Housing-FinanceMarch2015Looking at the First Time Buyer data, in original terms, WA had the highest share of FTB, and NSW the lowest.

FTBCountByStateMarch2015The percentage of FTB compared with all dwellings is relatively static.

FTBMarch2015However, if we overlay the DFA survey data on first time buyers who are going straight to investment property, this continues to rise, and pushes the true number of FTB higher. We continue to see a rotation away from owner occupation to investor first time buyers.

All-FTBMarch2015


NAB Validates DFA Research On Property Investors

The recently released Quarterly Australian Residential Property Survey Q1 2015 from NAB, included some data which chimes with DFA research (and highlights again that the FIRB do not have their figure on the overseas investor pulse).

First, with regards to First Time Buyers, NAB says that the say that around 1 in 4 purchases are being made by first home buyers (FHB), both as “owner occupiers” but also as “investors”. FHB going direct to the investment market was a theme we covered on the blog.

First homebuyers (FHBs) still account for around 1 in 4 of all new property sales, but the share of demand from FHBs owner occupiers fell to 14.7% while FHBs investors rose to 10.1%. Owner occupiers were broadly unchanged at 33.1%, while local investors were down slightly to 24.1%.”

Second, Foreign buyers were more active in new housing markets, accounting for 15.6% of demand.

NABPPtyForeignApr2015-6“There was however a notable shift in activity by location with the share of foreign buyers in NSW rising to a new high of 21% and falling to 20.7% in Victoria (from 33% in Q4 2014)”

NABPPtyForeignApr2015-5   NABPPtyForeignApr2015-2 In contrast, foreign buyers were less active in established housing markets, with their share of national demand inching down to 7.5% (8.7% in Q4’14).

Foreign buyer demand fell notably in Victoria (8.6%) and to a lesser extent in Queensland (5.1%), but increased slightly in WA (6.1%) and was broadly unchanged in NSW (11.2%).

NABPPtyForeignApr2015-4Nationally, 53% of all foreign purchases were for apartments, 30% houses and 17% for re-development. The bulk of foreign buyers (41%) spent between $500k to <$1 million, with 30% buying properties less than $500k and 5% buying premium property in excess of $5 million.

NABPPtyForeignApr2015-1Once again, this chimes with our research, when we showed a similar level of activity below $1m, and significant foreign investor activity in Sydney and Melbourne.

NABPPtyForeignApr2015-3Owner occupiers are still dominating demand for established property with a market share of 42.4% (42.6% in Q4’14), followed by local investors with a 21.6% share (22% in Q4’14). Property professionals estimate FHBs (owner occupiers) accounted for 15.8% of total demand for established property in Q1’15 (16.1% in Q4’14), with FHBs (investors) making up 10% (9.3% in Q4’14). Foreign buyers were less active in this market in Q1’15, with their share of national demand inching down to 7.5% (8.7% in Q4’14). Foreign buyer demand fell notably in VIC (8.6%) and to a lesser extent in QLD (5.1%), but increased slightly in WA (6.1%) and was broadly unchanged in NSW (11.2%).

NABPPtyForeignApr2015-8At the national level, capital growth expectations for the next 12 months have strengthened in all price ranges in both the housing and apartment markets. Capital growth expectations are assessed as “good” for all houses below $2 million and for apartments below $1 million. Expectations for capital growth at all other price points are assessed as “fair”. By state, expectations for capital growth continue to be strongest in NSW at all price ranges in both the housing and apartment markets, and significantly stronger for apartments valued at below $ 2million. In contrast, capital growth prospects are clearly lagging in WA at all price points, but especially at price points above $2 million, where prospects are considered “poor”

NABPPtyForeignApr2015-7