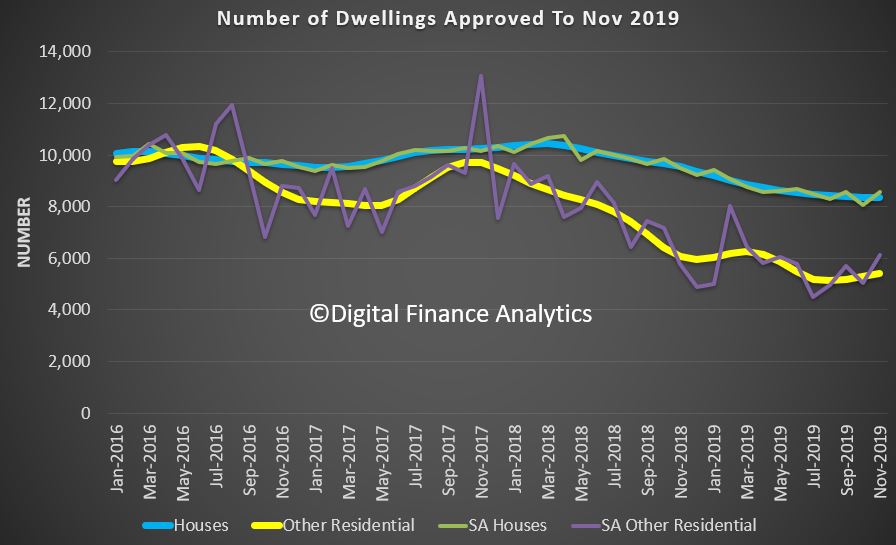
The dwelling approvals data is quite noisy, but the release from the ABS today reported a stronger rise in approvals than might have been expected in November 2019. We continue to report the trend series, as the seasonally adjusted is more volatile.
The trend estimate for total dwellings approved rose 0.8% in November. Within that, the trend estimate for private sector houses approved fell 0.3% while private sector dwellings excluding houses rose 2.9%.
However, the trend estimate of the value of total building approved fell 2.6% in November and has fallen for five months. The value of residential building fell 0.7% and has fallen for nine months. The value of non-residential building fell 5.0% and has fallen for four months.
The trend estimate for the value of non-residential building approved fell 5.0% in November and has fallen for four months.
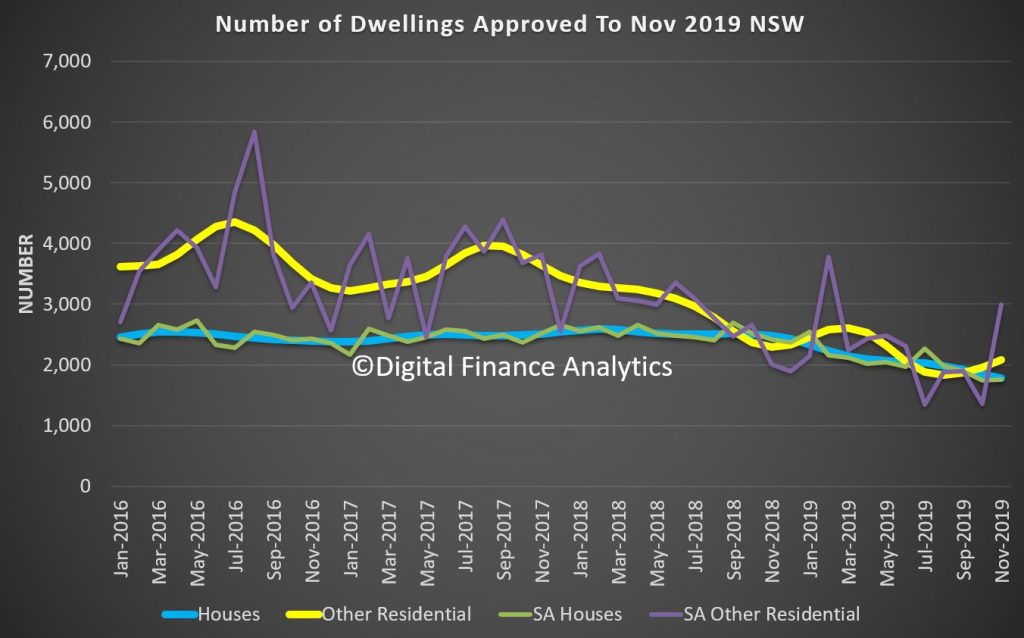
Across the states, trend estimate for total number of dwelling units approved in New South Wales rose 1.6% in November. The trend estimate for the number of private sector houses fell 3.4% in November. In Victoria, the trend estimate for total number of dwelling units approved rose 0.7% in November. The trend estimate for the number of private sector houses rose 0.2% in November. The trend estimate for total number of dwelling units approved in Queensland fell 0.4% in November. The trend estimate for the number of private sector houses rose 1.1% in November. The trend estimate for total number of dwelling units approved in South Australia rose 4.2% in November. The trend estimate for the number of private sector houses rose 0.9% in November. The trend estimate for total number of dwelling units approved in Western Australia fell 1.9% in November. The trend estimate for the number of private sector houses rose 1.5% in November.
So much of the change can be traced to a rise in unit development in NSW.
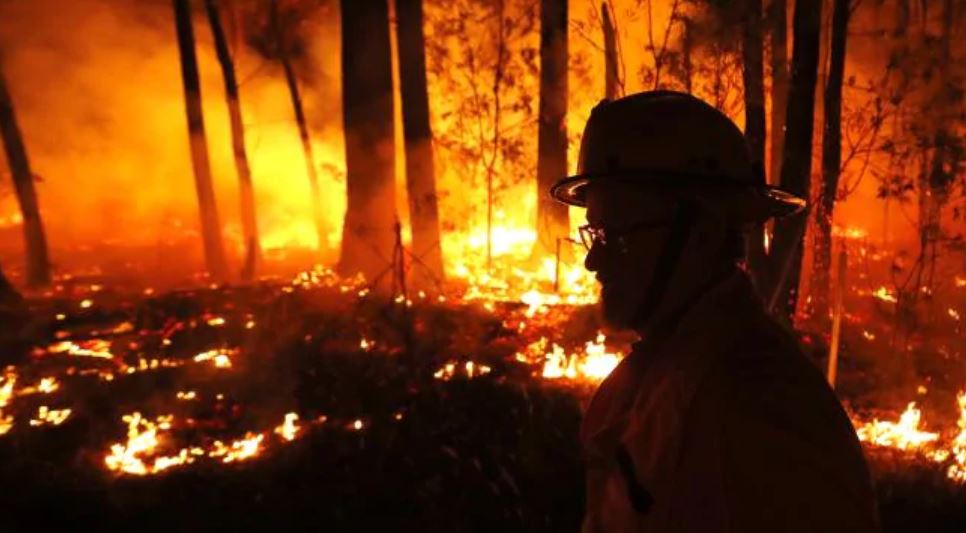
Australia is in the midst of a bushfire crisis that will affect local communities for years, if not permanently, due to a national crisis of underinsurance. Via The Conversation.
Already more than 1,500 homes have been
destroyed – with months still to go in the bushfire season. Compare this
to 2009, when Victoria’s “Black Saturday” fires claimed more than 2,000
homes in February, or 1983, when the “Ash Wednesday” fires destroyed
about 2,400 homes in Victoria and South Australia, also in February.
The 2020 fire season could end up surpassing these tragedies, despite the lessons learned and improvements in preparedness.
One lesson not really learned, though, is
that home insurance is rarely sufficient to enable recovery. The
evidence is many people losing their homes will find themselves unable
to rebuild, due to lack of insurance.
Research published by the Victorian government in 2017, meanwhile, estimated just 46% Victorian households have enough insurance to recover from a disaster, with 28%
underinsured and 26% having no insurance.
The consequences aren’t just personal.
They potentially harm local communities permanently, as those unable to
rebuild move away. Communities lose the vital knowledge and social
networks that make them resilient to disaster.
Miscalculating rebuilding costs
All too often the disaster of having your
home and possessions razed by fire is followed by the disaster of
realising by how much you are underinsured.
As researchers into the impact of fires,
we are interested why people find themselves underinsured. Our research,
which includes interviewing those who have have lost their homes, shows it is complicated, and not necessarily due to negligence.
For example, a woman who lost her home in
Kinglake, northeast of Melbourne, in the 2009 fires, told us how her
insurance calculations turned out to bear no resemblance to the actual
cost of rebuilding.
“You think okay, this is what I paid for
the property,” she said. “I think we had about $550,000 on the house,
and the contents was maybe $120,000.” It was on these estimates that she
and her partner took out insurance. She told us:
You think sure, yeah, I can rebuild my
life with that much money. But nowhere near. Not even close. We wound up
with a $700,000 mortgage at the end of rebuilding.
An extra mortgage
A common issue is that people insure based on their home’s market value. But rebuilding is often more expensive.
For one thing there’s the need to comply
with new building codes, which have been improved to ensure buildings
take into account their potential exposure to bushfire. This is likely
to increase costs by 20% or more, but is rarely made clear to insurance customers.
Construction costs also often spike following disasters, due to extra demand for building services and materials.
A further contributing factor is that
banks can claim insurance payments to pay off mortgages, meaning the
only way to rebuild is by taking out another mortgage.
“People who owned houses, any money that
was owing, everything was taken back to the bank before they could do
anything else,” said a former shop owner from Whittlesea, (about 30km
west of Kinglake and also severely hit by the 2009 fires).
This meant, once banks were paid, people had nothing left to restart.
She told us:
People came into the shop and cried on my
shoulder, and I cried with them. I helped them all I could there. That’s
probably why we lost the business, because how can you ask people to
pay when they’ve got nothing?
Undermining social cohesion
In rural areas there is often a shortage
of rental properties. Insurance companies generally only cover rent for
12 months, which is not enough time to rebuild. For families forced to
relocate, moving back can feel disruptive to their recovery.
Underinsurance significantly increases the
chances those who lose their homes will move away and never return –
hampering social recovery and resilience. Residents that cannot afford
to rebuild will sell their property, with “tree changers” the most
likely buyers.
Communities not only lose residents with local knowledge and important skills but also social cohesion. Research in both Australia and the United States suggested this can leave those communities less prepared for future disasters.
This is because a sense of community is
vital to individuals’ willingness and ability to prepare for and act in a
threat situation. A confidence that others will weigh in to help in
turn increases people’s confidence and ability to prepare and act.
In Whittlesea, for example, residents
reported a change in their sense of community cohesion after the Black
Saturday fires. “The newer people coming in,” one interviewee told us,
“aren’t invested like the older people are in the community.”
Australia is one of the few wealthy
countries that heavily relies on insurance markets for recovery from
disasters. But the evidence suggests this is an increasingly fraught
strategy, particularly when rural communities also have to cope with the
reality of more intense and frequent extreme weather events.
If communities are to recover from bushfires, the nation cannot put its trust in individual insurance policies. What’s required is national policy reform to ensure effective disaster preparedness and recovery for all.
Authors: Chloe Lucas, Postdoctoral Research Fellow, Geography and Spatial Sciences, University of Tasmania; Christine Eriksen, Senior Lecturer in Geography and Sustainable Communities, University of Wollongong; David Bowman, Professor of Pyrogeography and Fire Science, University of Tasmania
Data from the ABS today shows that the number of dwellings approved fell 0.8 per cent in October 2019, in trend terms, and has fallen for 23 months. Private dwellings excluding houses also fell, by 0.5 per cent.
The seasonally adjusted estimate for total dwellings approved fell 8.1 per cent in October, driven by a 11.3 per cent decrease in private dwellings excluding houses. Private sector houses fell 7.0 per cent.
The value of total building approved fell 0.7 per cent in October, in trend terms, and has fallen for two months. The value of residential building fell 1.2 per cent, while non-residential building fell 0.2 per cent.
Number of total dwelling units
The trend estimate for Australia fell 0.8% in October.
Number of private sector houses
The trend estimate for private sector houses approved fell 0.9% in October.
Number of private sector dwellings excluding houses
The trend estimate for private sector dwelling units excluding houses fell 0.5% in October.
Value of new residential building
The trend estimate for the value of new residential building approved fell 1.3% in October and has fallen for eight months.
Value of alterations and additions to residential building
The trend estimate for the value of alterations and additions to residential building fell 0.1% in October and has fallen for seven months.
Value of non-residential building
The trend estimate for the value of non-residential building approved fell 0.2% in October after rising for 14 months.
Across the states and territories, dwelling approvals fell in the Northern Territory (11.1 per cent), New South Wales (4.6 per cent), Queensland (1.4 per cent), and Western Australia (1.0 per cent). Tasmania (4.5 per cent), South Australia (3.1 per cent), Australian Capital Territory (3.1 per cent), and Victoria (1.3 per cent) recorded increases, in trend terms.
Approvals for private sector houses fell in New South Wales (2.3 per cent), Victoria (1.7 per cent), Western Australia (0.2 per cent), and Queensland (0.1 per cent). South Australia rose 2.0 per cent, in trend terms.
New South Wales
The trend estimate for total number of dwelling units approved in New South Wales fell 4.6% in October. The trend estimate for the number of private sector houses fell 2.3% in October.
Victoria
The trend estimate for total number of dwelling units approved in Victoria rose 1.3% in October. The trend estimate for the number of private sector houses fell 1.7% in October.
Queensland
The trend estimate for total number of dwelling units approved in Queensland fell 1.4% in October. The trend estimate for the number of private sector houses fell 0.1% in October.
South Australia
The trend estimate for total number of dwelling units approved in South Australia rose 3.1% in October. The trend estimate for the number of private sector houses rose 2.0% in October.
Western Australia
The trend estimate for total number of dwelling units approved in
Western Australia fell 1.0% in October. The trend estimate for the
number of private sector houses fell 0.2% in October.
The trend estimate for total dwellings approved fell 3.9% in August.
The seasonally adjusted estimate for total dwellings approved fell 1.1% in August.
The value of residential building fell 2.9% and has fallen for six months.
The trend estimate of the value of new residential building work done fell 2.5% in the June quarter. The value of work done on new houses fell 1.7%, while new other residential building fell 3.5%.
The seasonally adjusted estimate of the value of new residential building work done fell 4.7% to $16,097.2m. Work done on new houses fell 4.7% to $8,682.9m, while new other residential building fell 4.7% to $7,414.3m.
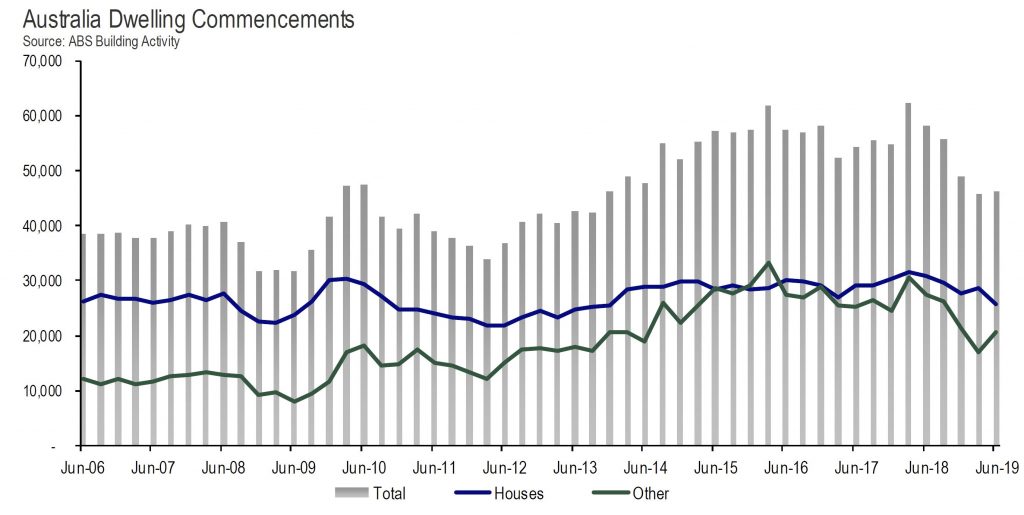
Despite a small improvement in new home starts in the June quarter, they remain 20 per cent lower than against the same period a year ago.
Annual housing starts during the 2018/19 financial year fell in all states and territories, with the exception of the Australian Capital Territory (+17.8 per cent) and Tasmania (+5.3 per cent).
The largest annual fall was recorded in the Northern Territory (-28.4 per cent), followed by South Australia (-22.6 per cent), Victoria (-17.8 per cent), Western Australia (-14.3 per cent), Queensland (-13.9 per cent), and New South Wales (-13.1 per cent).
“The number of new homes commencing construction in the June quarter
increased by 1.1 per cent, the first increase since December 2017,” said
Tim Reardon, HIA Chief Economist.
Commenting on the results, Tim Reardon, HIA Chief Economist said “The number of new homes commencing construction in the June quarter increased by 1.1 per cent, the first increase since December 2017.
“The increase in total starts was due to a 21 per cent lift in multi-unit starts, mainly in NSW and WA. Detached housing starts have slowed to their lowest level since December 2013.”
“More recent data informs us that the downturn in detached home starts has slowed. The impact of three cuts to interest rates and small fiscal stimulus has slowed the decline in work entering the pipeline.
“The slowdown in building activity over the past 18 months has adversely affected the national economy and has been one of the main drags on GDP growth.
“A return to normal lending conditions would provide a boost to home building and the wider economy.
“Indications are that the downturn in new projects entering the pipeline are starting to improve following cuts to interest rate but the market is not yet at the bottom of this cycle.
The ABS reported that the number of dwellings approved fell 3.9 per cent in August 2019, in trend terms, and has fallen for 21 months.
“The fall continues to be driven by private dwellings excluding houses, which decreased by 9.2 per cent in August,” said Daniel Rossi, Director of Construction Statistics at the ABS. “Private sector houses also fell, by 1.0 per cent.”
Across the states and territories, dwelling approvals decreased in August in the Australian Capital Territory (27.7 per cent), Northern Territory (8.7 per cent), New South Wales (5.4 per cent), Victoria (4.0 per cent), Queensland (2.3 per cent), South Australia (0.9 per cent), Tasmania (0.4 per cent) and Western Australia (0.2 per cent), in trend terms.
In trend terms, approvals for private sector houses fell in Western Australia (4.3 per cent), Queensland (1.7 per cent), South Australia (1.6 per cent) and Victoria (1.0 per cent), but rose in New South Wales (0.9 per cent).
The seasonally adjusted estimate for total dwellings approved fell 1.1 per cent in August, driven by a 2.4 per cent decrease in private houses. Private dwellings excluding houses rose 3.1 per cent in seasonally adjusted terms.
The value of total building approved rose 1.1 per cent in August, in trend terms, and has risen for eight months. The value of residential building fell 2.9 per cent, while non-residential building rose 5.7 per cent in trend terms.
“The value of non-residential building approved has risen for 12 months, to a record high of $4.8 billion. The rise in August was driven by approvals for health buildings in New South Wales,” said Mr Rossi.
Property expert Joe Wilkes and I discuss failed market intervention – and whether we should leave the market to be the market … rather than foist more debt on households.
The latest edition of our weekly finance and property news digest with a distinctively Australian flavour.
Contents:
1:11 – US Markets 4:25 – Bond Rates 5:29 – Q2 Earnings 6:40 – UK 7:51 – Europe 8:49 – Argentina
9:44 – Australian Section
10:00 – GDP Guidance
11:12 – Home Prices
16:56 – Auction Results
18:16 – Credit
19:52 – Construction
20:41 – Australian Markets
23:28 – Cash Ban