AMP reported their FY16 results today, a net loss of $344m compared with a profit last year of $972m last year. They also announced a share buy-back of up to $500m. The final dividend was maintained at 14 cents a share, franked to 90 per cent making the FY 16 dividend 28 cents a share.
It is a complex business, with many moving parts, and an offshore expansion strategy in sharp contrast to the major retail banks!
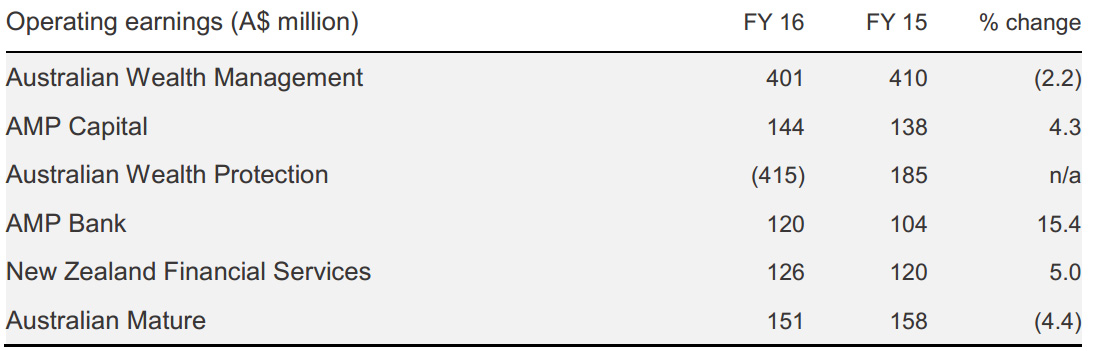
 The business took a hit from a $415 million loss in Wealth Protection reflecting negative claims experience and capitalised loss.
Underlying profit was A$486 million compared with A$1,120 million prior year, reflecting actions announced in October 2016 to stabilise Australian Wealth Protection.
The wealth management businesses performed better, (AMP Capital, AMP Bank and New Zealand).
International expansion in China, Europe and North America continues. China Life AMP Asset Management Company (CLAMP) is the fastest-growing investment manager in China, with assets under management (AUM) rising 55 per cent year on year.
They focusses on cost management: A$200 million, three-year efficiency program completed in 2016 and a new efficiency target set for 2017.
They have a strong capital position with A$2.3 billion surplus on 1 January 2017 following consolidation of life companies. Underlying return on equity 5.6 per cent, down from 13.2 per cent in 2015, reflecting Wealth Protection performance.
Business unit results
Australian Wealth Management
The impact of difficult trading conditions was partly offset by effective cost and margin management. AUM was up 5 per cent to A$121 billion following a strong end to the year. Total net cash flows of A$336 million (FY 15: A$2.2 billion) were lower, consistent with an industry-wide slow down amid market and regulatory uncertainty. Improving customer sentiment underpinned a lift in discretionary contributions in Q4 2016.
Targeted product enhancements supported strong cash flows on AMP’s flagship North platform, with net cash flows up 11 per cent on FY 15 and AUM up 30 per cent. Cash flows from AMP Flexible Super reduced as flows switched to North as expected. Corporate super cash flows were lower reflecting the lumpy nature of mandates. AMP’s developing omni-channel advice network, campaigns to capitalise on a more favourable market environment, corporate super pipeline and further product enhancements are expected to support cash flows in 2017 and beyond.
AMP deliberately reduced adviser numbers in 2016 by tightening the classification of authorised representatives. A higher-than-usual number of advisers also decided to retire or leave the industry in the face of challenging industry conditions and increasing education and professional requirements.
AMP Capital
AMP Capital’s strong performance reflected increased fee income driven by growth in real estate and infrastructure investments. Controllable costs increased as the business continued to invest in international growth and build its distribution capability.
External net cash flows were A$967 million (FY 15: A$4.4 billion) and were impacted by challenging market conditions in Australia and Japan, partly offset by good institutional flows into real estate and infrastructure asset classes. FY 16 finished with a strong origination pipeline, including A$3.1 billion of available investor commitments. In China, CLAMP’s AUM increased 55 per cent year on year.
Australian Wealth Protection
Performance was impacted by negative experience and the actions to stabilise the business announced in October 2016, including strengthened assumptions, which led to a one-off capitalised loss of A$484 million. Total experience losses for the year were A$105 million. Claims experience inQ4 2016, capitalised and other one-off losses, and the reduction in embedded value were all within guidance provided in October 2016. AMP group’s reported earnings were also impacted by aA$668 million charge for goodwill impairment as a consequence of declines in the potential recoverable amount of the Australian Wealth Protection business.
The consolidation of AMP Life and NMLA – a Part 9 transfer – released A$145 million in regulatory capital on 1 January 2017, while a reinsurance agreement for 50 per cent of the AMP Life portfolio (25 per cent of total exposure) released a further A$500 million of regulatory capital. These actions underpinned the board’s decision to return capital to shareholders through an on-market share buy-back. The process for a second tranche of reinsurance is now underway.
AMP Bank
Above system growth in residential mortgages at 13% and expansion in net interest margin contributed to 15 per cent growth in operating profit.
The bank is investing in operational capacity to support continued growth, with retail mortgage sales via the aligned adviser channel up 24 per cent on FY 15. The bank’s cost to income ratio fell to 29 per cent as the bank benefitted from increased scale.
New Zealand Financial Services
Performance was driven by improved margins in wealth management and experience profits in the life insurance business. Excluding the effect of the loss of transitional tax relief, operating earnings increased 14 per cent, with tight cost management improving the business’s cost to income ratio. AUM increased 9 per cent, reflecting positive market performance and net cash flows.
Australian Mature
Operating earnings of A$151 million reflected anticipated portfolio run off and lower bond yields, partly offset by cost control and better persistency
Capital management
AMP continues to actively manage capital with Level 3 eligible capital resources A$2,195 million above minimum regulatory requirements at 31 December 2016, up from A$1,917 million at 1 July 2016. Effective 1 January 2017, the consolidation of AMP’s two life companies (AMP Life and NMLA) increased excess regulatory capital by a further A$145 million.
The strengthened capital position also reflects the execution of the reinsurance agreement.
Capital released from reinsurance provides the capacity for capital to be returned to shareholders.An on-market share buy-back of up to A$500 million will begin in Q1 2017.
A FY 16 final dividend has been maintained at 14 cents per share, franked at 90 per cent, with the unfranked amount being declared as conduit foreign income. The total FY 16 dividend is 28 cents a share. This reflects the largely non-cash nature of the one-off losses incurred in Australian Wealth Protection. AMP’s dividend policy target range is 70 to 90 per cent of underlying profit. The dividend reinvestment plan will be neutralised by on-market purchases.
Cost program
AMP’s three-year business efficiency program completed in FY 16 with A$200 million in pre-tax recurring run rate cost benefits delivered in line with expectations.
AMP is committed to a 3 per cent reduction in controllable costs in 2017, excluding AMP Capital and allowing for continued investment in growth businesses and channel experiences. AMP Capital will be managed on a cost to income basis, which is appropriate for the profile and growth ambitions of this business.

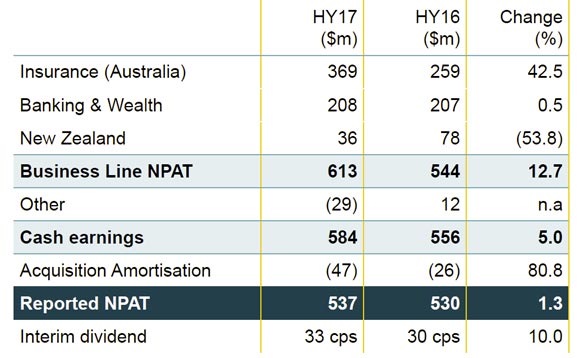
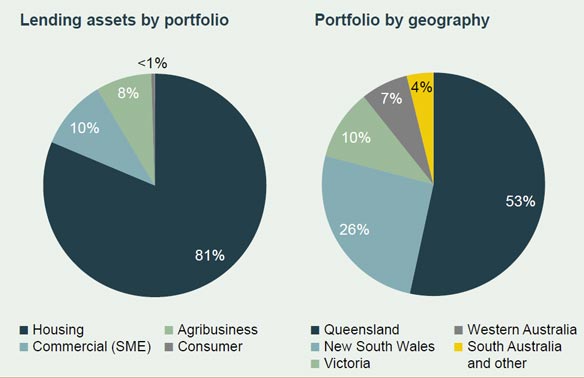
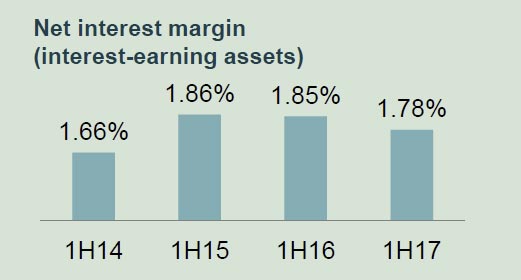
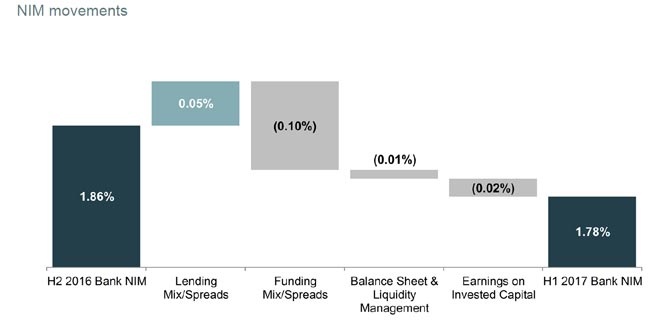
 Whist total assets were up by 3.5% on 1H16 to $70.9b, net interest margin dropped 6 basis points to 2.1%. It may be recovering a little now thanks to repricing of loans but volume may be slowing as a result. Home lending was 70.6% of loans. They are close to the 10% investment lending speed limit, so that will also trim growth.
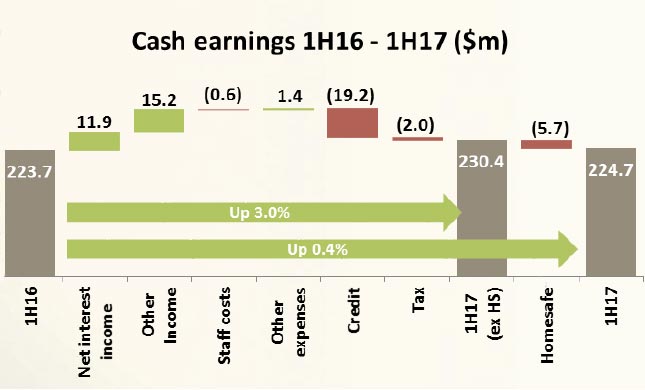
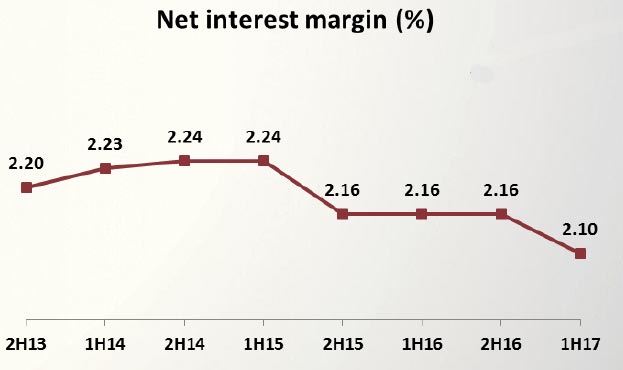 The expenses ratio improved, as shown by the Jaws momentum.
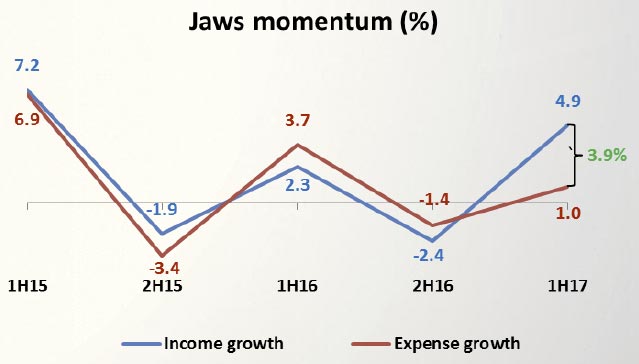 The Keystart loan acquisition meant their mortgage lending book grew 13.9%, but 6.8% excluding the acquisition. Residential loan approvals rose, including via third party channels, but broker loans seem to be slowing post the recent repricing.
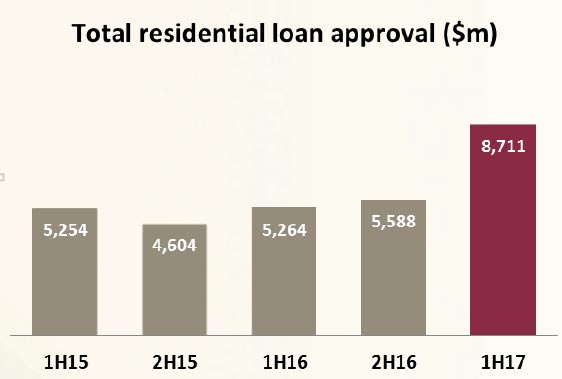 There was a 9% growth in offset portfolio loans since December 2015. They say 45% of home loan customers are ahead with their minimum repayments. 29% of customers are 3 or more repayments ahead. Loan settlements are running at around $1.5m a month.
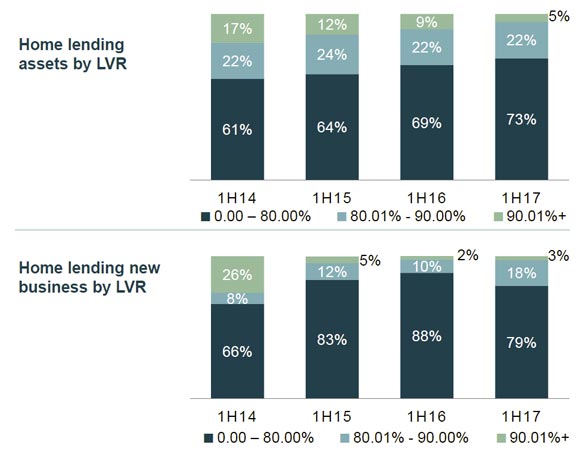
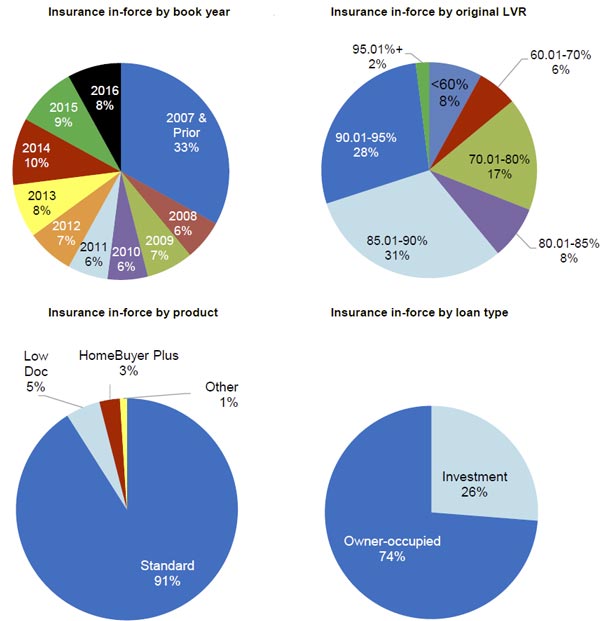
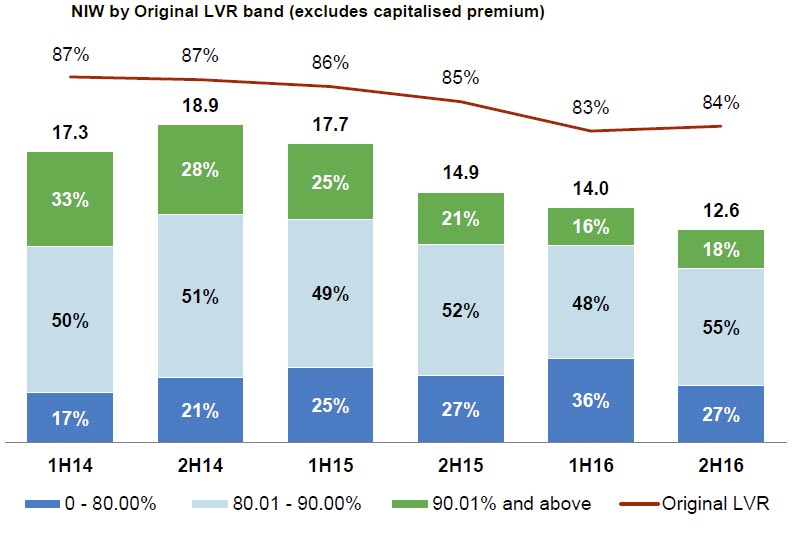
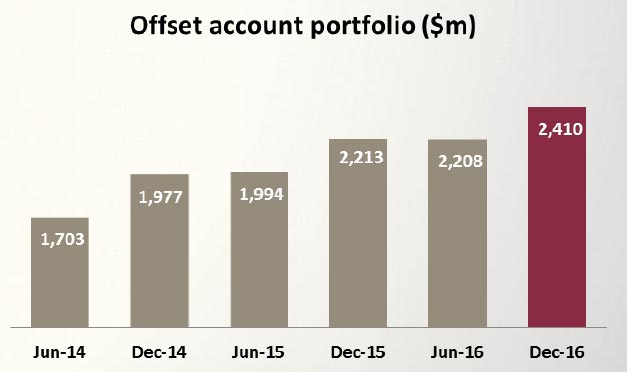 9% of loans are over 90% LVR.
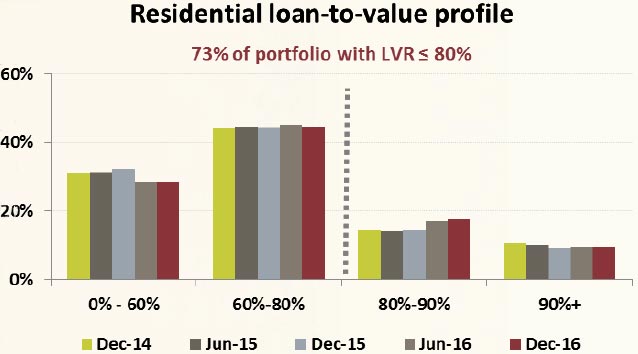 The Bank benefited from rising property values in its Homesafe portfolio and remains sensitive to future price growth. They added (only) $2.5m of overlay in 1H17 increasing the total overlay to the value of the portfolio to $26.1m. Given the strong price growth in Sydney and Melbourne this seems low!
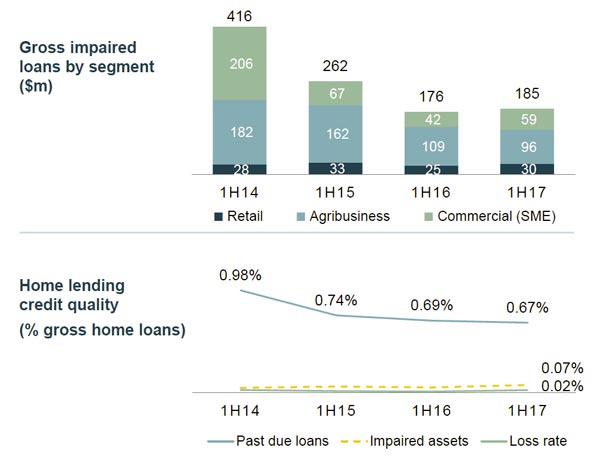
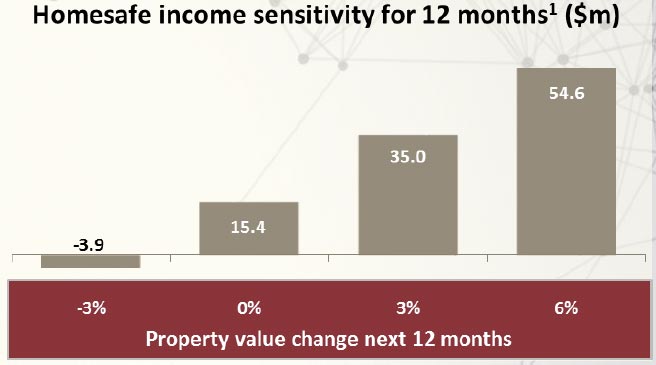 BDD were controlled, but residential arrears are rising a little. Great Southern is paying down as expected.
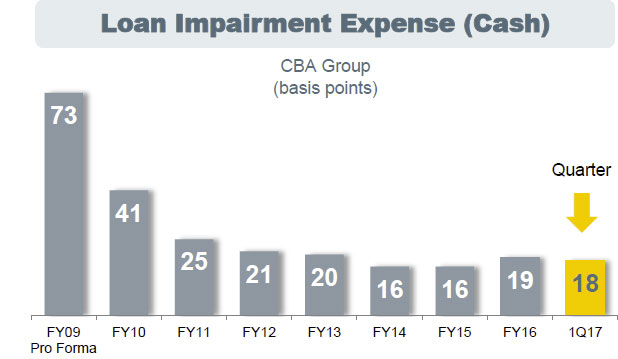
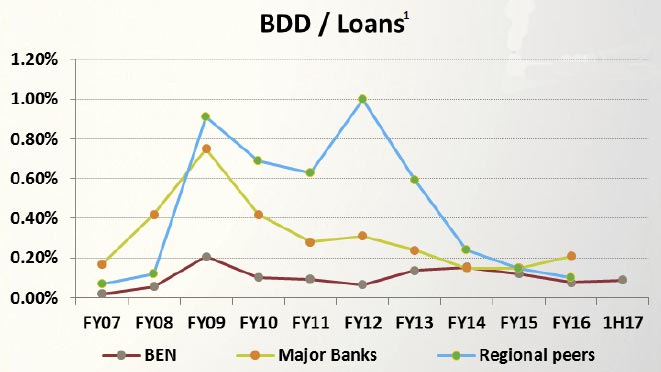 Bad debt provisions fell, partly thanks to a specific and large named, but now resolved risk.
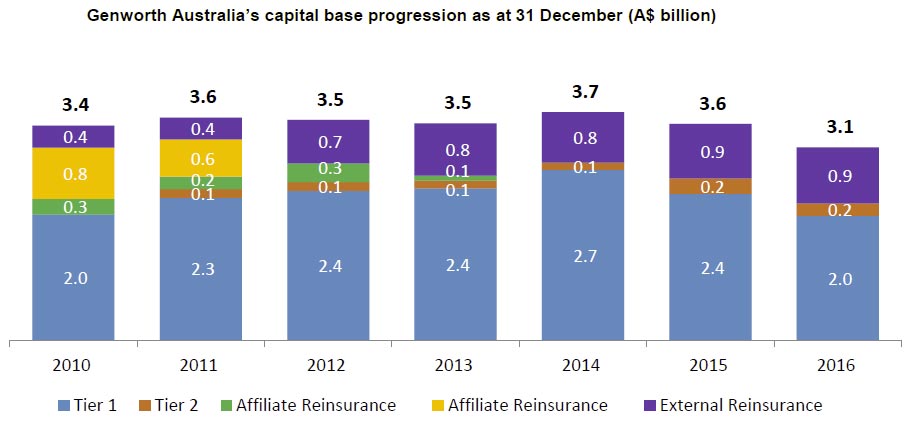
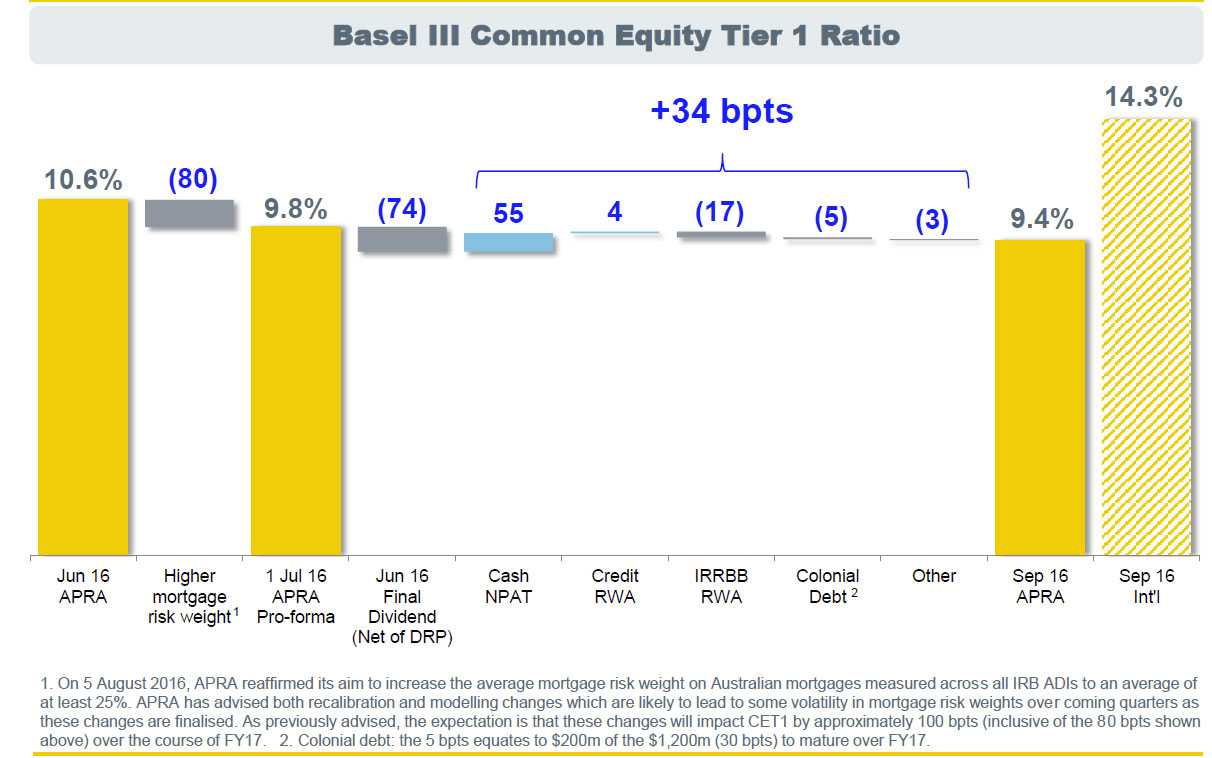
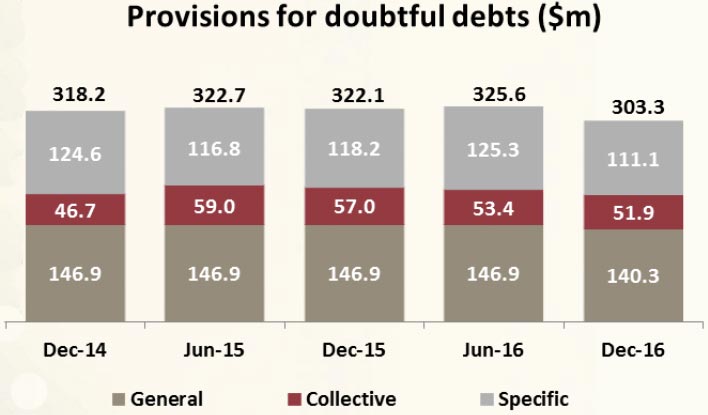 Capital remains under pressure, with CET1 down to 7.97%. The move to advanced IRB (timing TBA) might help a bit, possibly.
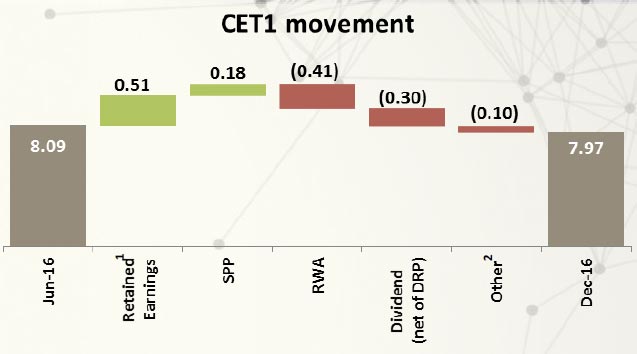 All in all, they had to squeeze the lemon harder to drive a reasonable outcome, but we question whether the fundamentals are there for long-term sustainable and growing shareholder returns.