AMP Limited has reported a net profit of A$884 million for the full year to 31 December 2014,, up 32 per cent on A$672 million reported for FY 13. In response AMP’s share price rose to a five year high. Their banking division has grown on the back of a 9% rise in mortgage lending.
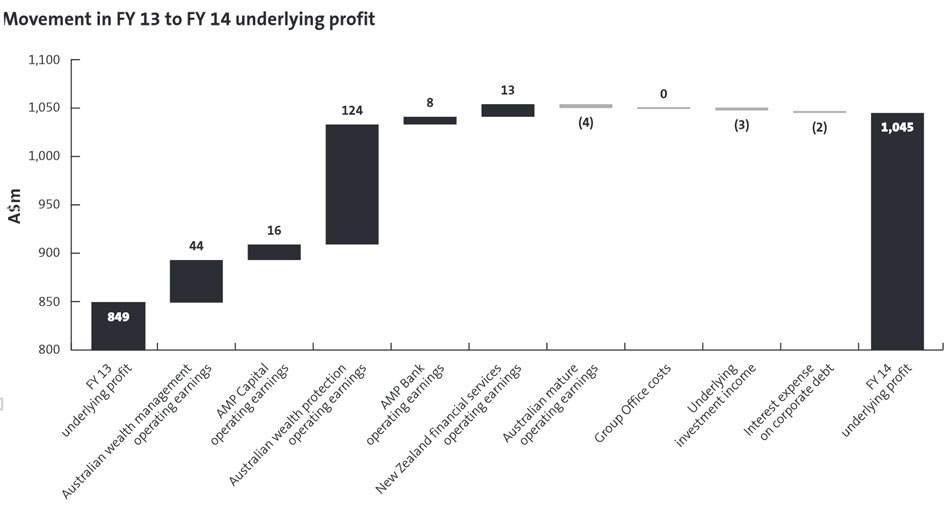
Underlying profit was A$1,045 million compared with A$849 million for FY 13, up 23 per cent year on year, driven by double digit growth in operating earnings across all contemporary businesses.
 The Board has declared a 17 per cent increase to the final dividend to 13.5 cents per share compared with 11.5 cents per share for the 2013 final dividend. This represents a FY 14 payout ratio of 74 per cent of underlying profit and is within AMP’s target range of paying 70 to 80 per cent of underlying profit.
The group cost to income ratio was managed tightly to 44.8 per cent for FY 14, down from 49.4 per cent in FY 13. Controllable costs increased 1.1 per cent and are tracking in line with guidance having been impacted positively by the business efficiency program.
Australian wealth management net cashflows were A$2.3 billion in FY 14, up A$115 million on net cashflows of A$2.2 billion in FY 13. AUM rose 9 per cent over the year to $109.5 billion, against a relatively flat Australian market. Total net cashflows on AMP platforms continue to perform strongly, growing 35 per cent to A$3.6 billion in FY 14. AMP Capital external net cashflows were A$3.7 billion, a A$4.8 billion improvement from net cash outflows of A$1,039 million in FY 13.
Underlying return on equity: Increased to 12.7 per cent in FY 14 from 10.7 per cent in FY 13, reflecting the 23 per cent increase in underlying profit.
In Australian wealth management, operating earnings for FY 14 were up 13 per cent compared with FY 13, reflecting higher net cashflows supporting good growth in AUM and disciplined cost control in a growing business.
Australian wealth protection has recovered well with operating earnings of A$188 million compared with A$64 million in 2013.
AMP Capital’s improved performance: Operating earnings increased 16 per cent reflecting strong fee growth and investment returns. The internationalisation of the business drove this with global investors attracted by leading infrastructure and property capabilities alongside new inflows generated by the China Life AMP Asset Management joint venture and improved flows from the MUTB alliance. The cost to income ratio of 63 per cent was within AMP Capital’s target range of 60 to 65 per cent.
Seventh quarter of more than A$1 billion net cashflows on North platform: Net cashflows improved 34 per cent to A$5.5 billion for FY 14 and North AUM grew 66 per cent to A$16 billion since December 2013. North also had 50 per cent growth in customers with a total of over 76,000 customers on the platform in 2014.
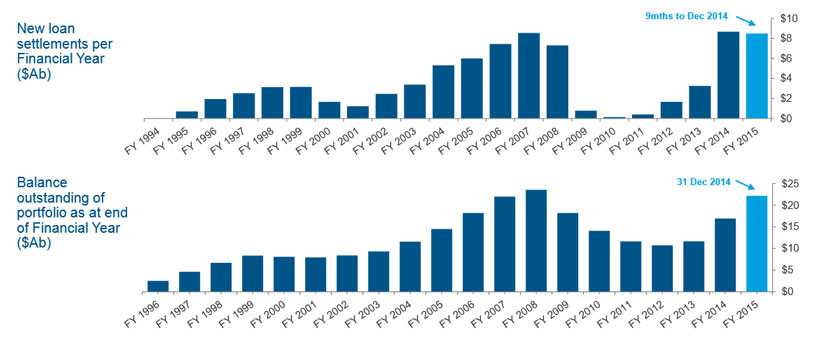
AMP Bank: The bank delivered A$91 million in operating earnings, up 10 per cent compared with FY 13, reflecting an increase in residential mortgages with AMP growing above system in an intensely competitive environment and AMP aligned advisers contributing a quarter of new business. Total revenue increased 12% in FY 14 on FY 13, driven mainly by growth in the loan portfolio and improved net interest margin.
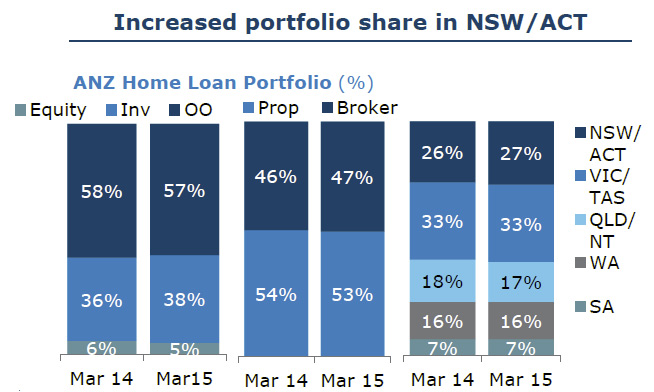
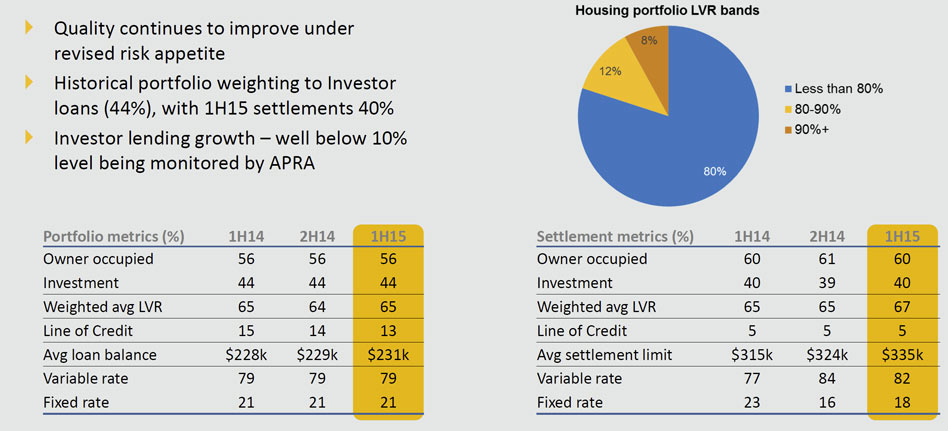
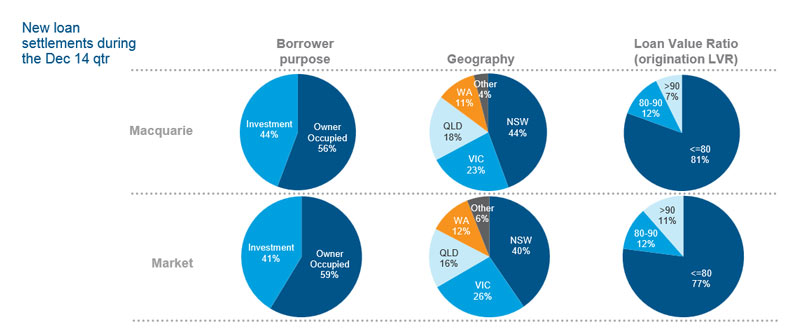
AMP Bank maintained a competitive lending position, with the total loan book growing by A$1,169m to A$14.5b in FY 14, an increase of 8.8% on FY 13. Residential mortgage competition remained intense in the period, with continued market-wide discounting. AMP Bank’s focus on pricing enhancements and productivity from key channels, contributed to deliver above system residential mortgage book growth of A$1,117m (9%) in FY 14 to A$14.0b. Strong growth was delivered through both the broker and AMP aligned adviser channels. The AMP aligned adviser channel now contributes 25% of AMP Bank’s mortgage new business, up from 19% in FY 13.Owner occupied loans made up 62% of the mortgage portfolio at 31 December 2014, while investment property loans were 38%
Customer deposits increased over FY 14 by A$0.5b (6%) to A$9.2b. The deposit growth was primarily driven by AMP Bank’s Notice Saver Account and the North Platform, offset by a reduction in both term deposits and deposits sourced from financial institutions. Customer deposit to loan ratio was 64% for FY 14, compared with 66% for FY 13
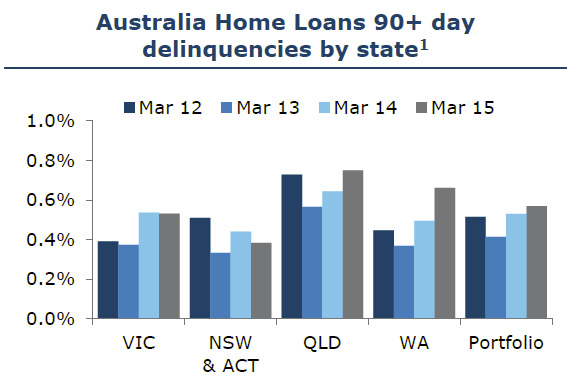
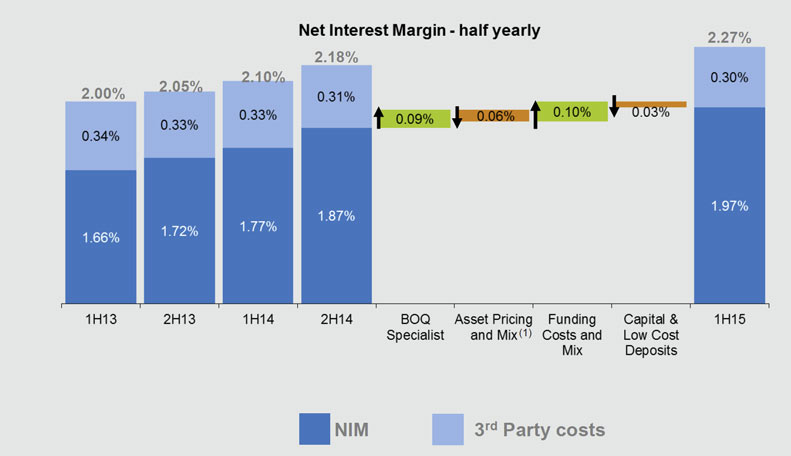
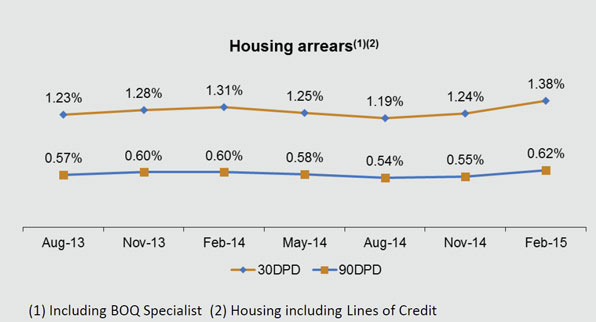
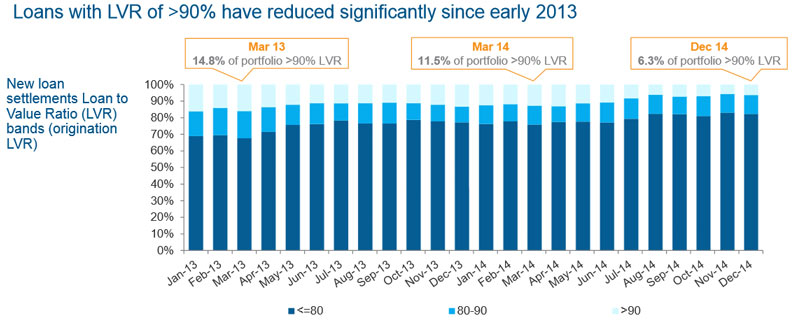
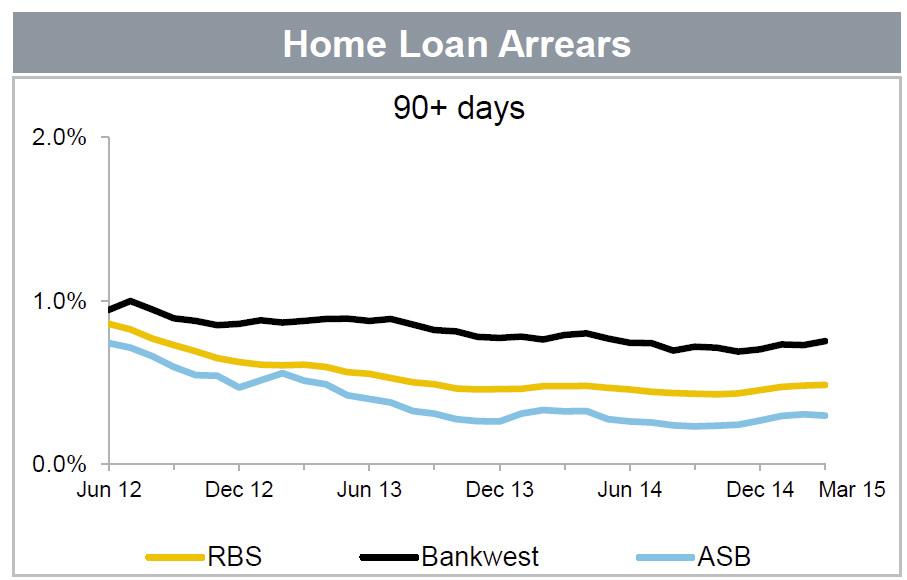
Net interest margin was 1.41% for FY 14, up 2 bps from FY 13 and up 6 bps from 1H 14, aided by improved cost of wholesale funding during the period, targeted use of discounting and enhanced liquidity managemen. AMP Bank’s credit policy remains conservative and has not been relaxed to achieve growth. Asset quality remains strong, with mortgages in arrears (90+ days) at 0.42% as at December 2014 (0.37% as at December 2013). Loan impairment expense to gross loans and advances was 0.01% in FY 14.
AMP Bank’s variable costs increased by A$9m (18%) in FY 14, largely attributable to higher commission payments, mortgage acquisition and securitisation financing costs. AMP Bank’s controllable costs increased A$6m (12%) to A$56m in FY 14, from A$50m in FY 13, due to investments in technology, product development and operating capability to support the growth in lending and improvements to customer service levels. AMP Bank’s cost base will continue to rise as it invests to support growth. The cost to income ratio increased by 0.7 percentage points to 30.3% in FY 14 from 29.6% in FY 13.
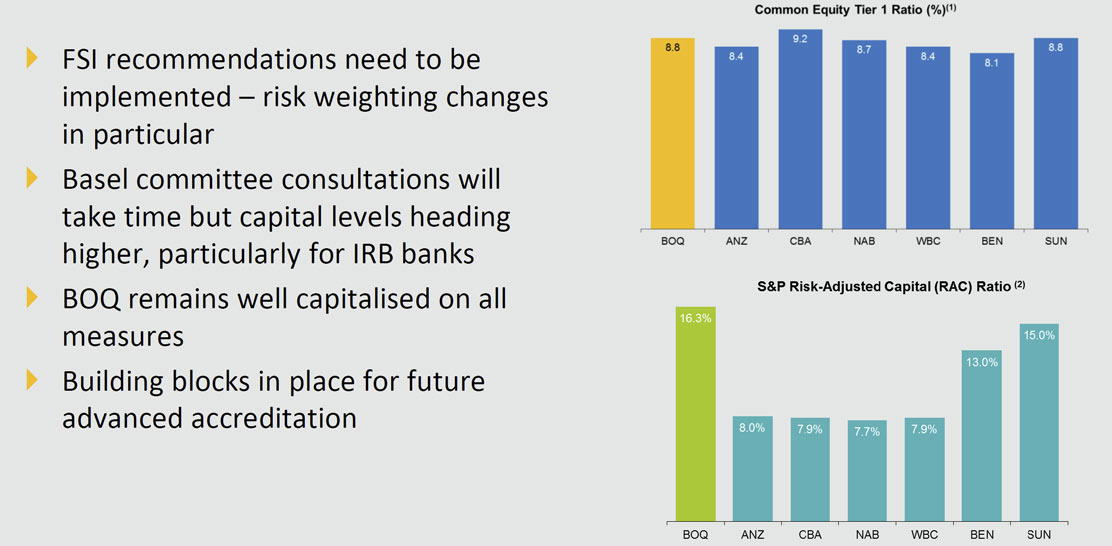
The Capital Adequacy Ratio (CAR) was 12.2% at FY 14, (11.8% at FY 13). The Common Equity Tier 1 Capital Ratio at FY 14 was 9.3% (8.7% at FY 13). Both ratios remain well above APRA and internal thresholds. AMP Bank is building its capital holdings to ensure compliance with Basel III capital requirements upon implementation in 2016
New Zealand achieved improved cashflows: Operating earnings of A$110 million, up 13 per cent compared with FY 13, reflecting growth in profit margins, experience profits and favourable currency movements.
Future of advice strategy: A package of measures to lift the quality of advice is being introduced along with a new approach to advice being piloted in five locations. AMP is also investing in services, platforms and digital capabilities to improve adviser quality and productivity. Australian adviser numbers are up slightly at 3,844 in a period of regulatory uncertainty.
AMP continues to hold an appropriate capital surplus, with A$2.0 billion capital above minimum regulatory requirements at 31 December 2014, down from A$2.1 billion at 31 December 2013. The decrease was driven by the redemption of AMP Notes and the impact of falling bond yields, partially offset by retained profits and other capital impacts.

 The Group’s Basel III Common Equity Tier 1 (CET1) APRA ratio was 8.7 per cent as at 31 March 2015, an increase of 20 basis points on December 2014 after excluding the impact of the 2015 interim dividend (which included the issuance of shares in respect of the Dividend Reinvestment Plan). The Group’s Basel III Internationally Comparable CET1 ratio as at 31 March 2015 was 12.7 per cent. They will need to raise more capital on these ratios than we expected.
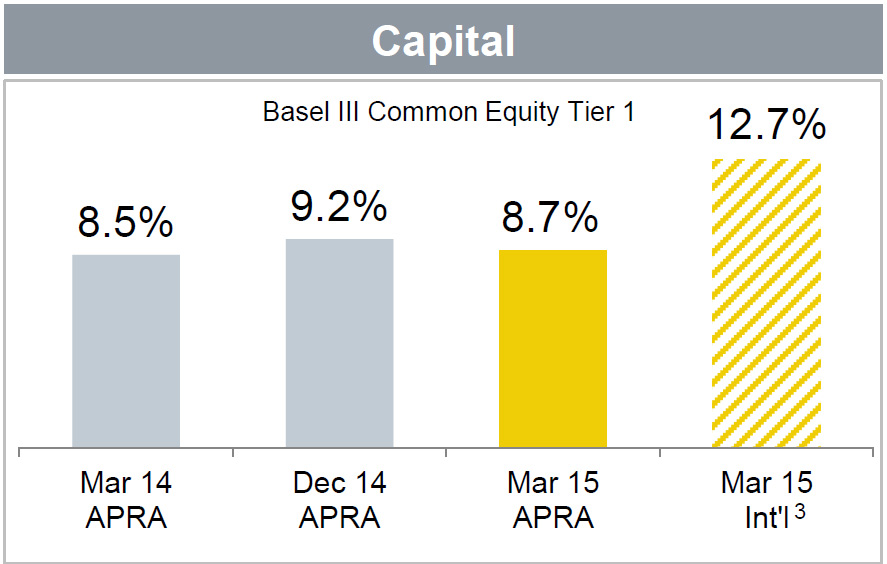 Funding and liquidity positions remained strong, with customer deposit funding at 64 per cent and the average tenor of the wholesale funding portfolio at 3.9 years.
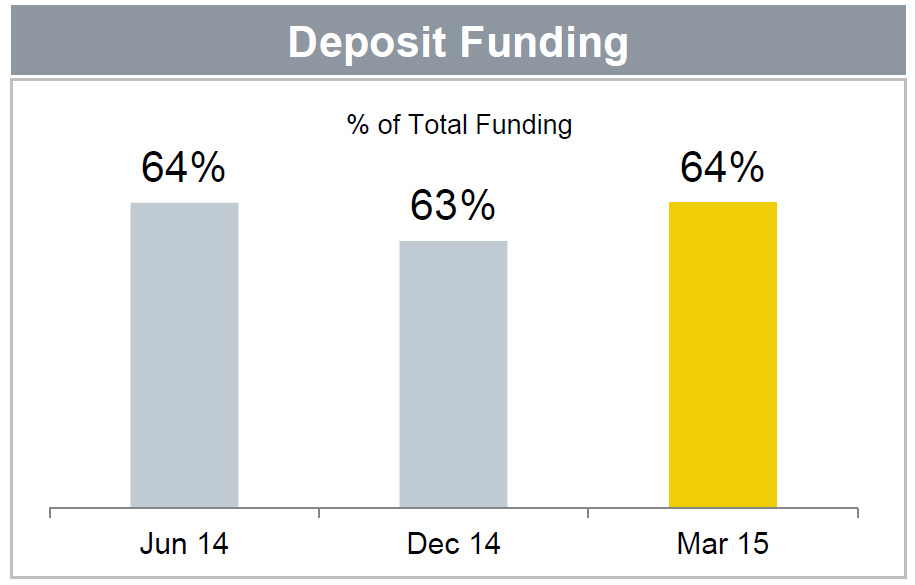 Liquid assets totalled $144 billion with the Liquidity Coverage Ratio (LCR) standing at 122 per cent. The Group completed $8.5 billion of new term issuance in the quarter.