Skyrocketing bank profits and are set to slow as Australia’s big banks face rising loan impairments, Moody’s Investor Service has warned.
Moody’s senior vice president, Ilya Serov said banks have faced increasingly difficult operating conditions over recent months, resulting in a “sharp rise – from an exceptionally low base – in large, single-name loan impairments in the banks’ corporate portfolios”.This pressure on the banks’ asset quality will come from “multiple headwinds”, according to the report released by Moody’s Investor Service, including potential further stress in resources-related sectors and regions and a worsening outlook for residential property developments.
Moody’s conclusions in the report are based on the first-half FY2016 financial results of the major banks – ANZ, NAB, Wesptac and CBA.
Moody’s noted that in the results, the major banks reported higher loan impairments during the first half of 2016, averaging 0.19% of gross loans, up from 0.16% in the second half of 2015. CBA has also reported that its loan impairment rose to 0.25% during its third quarter 2016 reporting period.
These results suggest that further deterioration, closer towards the long-run average of 0.35-0.40%, is likely.
Additional provisioning for rising loan impairments, alongside record low interest rates, will put bank profitability under increasing pressure over the rest of 2016.
On the other hand, Moody’s noted that capital levels are likely to “remain stable or improve moderately”, as the banks position themselves in anticipation of likely further regulatory reform.
Category: Company Results
Are Current Dividend Payouts Sustainable?
Interesting note from Moody’s today, making the point that companies cannot afford indefinitely to fund increases in shareholder compensation from corporate earnings, especially if earnings are flat to lower. The demands placed on earnings by shareholder compensation can be assessed by the ratio of the sum of net equity buybacks plus net dividends to pretax profits from current production (as derived from US government data). Moody’s call this the shareholder compensation ratio.
During the year-ended Q1-2016, the sum of net equity buybacks plus net dividends approximated 96% of pretax profits from current production for US nonfinancial corporations. The latter exceeded each comparably measured yearlong ratio prior to 2007.
Moreover, net stock buybacks plus net dividends averaged a smaller 67% of profits from current production during the three previous recoveries, wherein the ratios ranged from 61% for 1983-1990’s upturn, 55% for 1991-2000’s recovery, and 80% for 2002-2007’s upswing. Ratios of 85% or higher more than three years after the end of a recession tend to indicate either the late stage of a business cycle upturn or the presence of a recession.
During the mature phase of 2002-2007’s recovery, the ratio first broke above 85% in Q4-2006. A recession materialized after the shareholder compensation ratio climbed up from Q4-2006’s 95.4% to Q4-2007’s 130.2% of profits from current production. Though the climb by the ratio hardly triggered the Great Recession, it reflected a loss of financial flexibility that left businesses less capable of absorbing the shock of unexpectedly low profits.
An elevated shareholder compensation ratio reveals a reduction in the earnings that underpin corporate credit quality. In turn, the now exceptionally high shareholder compensation ratio warns of a limited scope for any narrowing by the US high-yield bond spread.
AMP Update Highlights Challenging Market Conditions
AMP Limited today reported cashflows and assets under management (AUM) for the first quarter to 31 March 2016 and an update on its Australian wealth protection business. Domestic and global investment market conditions continued to be challenging during the first quarter, subduing cashflows across the business.
Australian wealth management net cashflows were $209 million during the quarter, down from $342 million in Q1 15. Cashflows were impacted by weaker investor confidence, ongoing market volatility and advisers adjusting to an enhanced regulatory environment. External inflows represented approximately half of total cash inflows, which were $2.8 billion in Q1 16, down 1 per cent on Q1 15.
Total AUM was $112.6 billion, down 2 per cent from $115.1 billion at the end of Q4 15 (and 3 per cent from $116.1 billion at Q1 15). The decline since 31 December largely reflects negative investment market movements during the quarter. Average AUM fell 2 per cent to $112.1 billion from Q4 15.
Total retail and corporate superannuation net cashflows on AMP platforms were $383 million in Q1 16, down from $638 million in Q1 15, as volatile markets and lower investment activity impacted cash inflows. Strong pension AUM growth in FY 15 resulted in higher pension payments in Q1 16.
AMP’s leading wrap platform, North, reported net cashflows of $820 million in Q1 16, down 11 per cent from Q1 15. While North inflows rose 9 per cent from Q1 15, this was offset by a 25 per cent rise in outflows, reflecting strong pension driven AUM growth. Approximately 70 per cent of cash outflows were internal transfers, largely within the North platform.
North AUM grew to $21.2 billion at the end of the quarter, up 19 per cent from $17.8 billion at the end of Q1 15 and up 2 per cent from $20.9 billion at Q4 15.
AMP Flexible Super reported net cashflows of $84 million in Q1 16, down from $347 million in Q1 15, in part driven by lower inflows, reflecting fewer superannuation to pension transitions and growing adviser preference for North. Flexible Super AUM fell 1 per cent in Q1 16 to $14.9 billion and increased 5 per cent from $14.2 billion at Q1 15.
Corporate superannuation net cashflows were $109 million in Q1 16 compared to net cash outflows of $23 million in Q1 15. Cashflows continued to benefit from member transitions from recent large mandate wins while the prior period was impacted by significant outflows within a large corporate plan.
External platform net cash outflows were $174 million in Q1 16 compared to a net cash outflow of $296 million in Q1 15. Outflows from Genesys advisers leaving AMP continue to be lower than expected, with a net cash outflow of $33 million during the quarter. Further outflows of around $350 million are expected during the remainder of FY 16.
Assets under administration for AMP’s self-managed superannuation fund (SMSF) business SuperConcepts were $18.2 billion at the end of the first quarter, a decrease of $566 million or 3 per cent from Q4 15. Across administration and software services, SuperConcepts added approximately 400 funds during Q1 16 and now supports more than 38,400 SMSFs of which 42 per cent are funds under administration. In addition, a large administration deal was completed in the quarter, with approximately 1,300 funds yet to transition to SuperConcepts.
AMP Capital had net cash outflows in Q1 16 of $1,540 million, comprising external net cash outflows of $477 million and internal net cash outflows of $1,063 million. External cashflows were impacted by challenging domestic and international market conditions.
Net cashflows from AMP’s share of the China Life AMP Asset Management Company (CLAMP) alliance decreased to $22 million from $143 million in Q1 15, reflecting the redemption of money market funds of some corporate and institutional clients, in line with their liquidity management practice. These funds were subsequently reinvested in CLAMP products in Q2 16. In Japan, low investor confidence continues to impact cashflows across AMP’s distribution partnerships.
AMP Capital AUM at the end of Q1 16 was $156.5 billion, down 2 per cent from $159.9 billion at the end of Q4 15 and $160.5 billion at Q1 15. Average AUM decreased 1 per cent during the quarter to $157.2 billion, reflecting market volatility.
AMP New Zealand financial services’ net cashflows of A$60 million in Q1 16 were up A$8 million from A$52 million in Q1 15. Softer flows into KiwiSaver were offset by a decline in Other net cash outflows.
Australian mature net cash outflows in Q1 16 were $319 million, compared to a net cash outflow of $361 million in Q1 15.
AMP Bank’s mortgage book increased to $15.3 billion at the end of Q1 16 from $15.2 billion at Q4 15. The AMP aligned adviser channel contributed 22 per cent of AMP Bank’s mortgage new business, impacted by lower investor lending growth in Q1 16. The deposit book increased $415 million (4 per cent) in Q1 16 relative to December 2015.
Australian wealth protection annual premium in-force (API) was down 1 per cent in Q1 16 to $1,943 million compared to $1,958 million in Q4 15. The small decline was primarily driven by 1 per cent falls in API for individual lump sum and individual income protection.
Business update on Australian wealth protection business
For the first quarter of 2016, the Australian wealth protection business was impacted by claims experience losses of $18 million, with the majority of the losses being in retail income protection across both incidence and termination.
While we continue to monitor insurance experience closely, it has not caused us to alter our best estimate assumptions at the present time.
As previously flagged, volatility in Australian wealth protection experience continues to be expected from period to period. During remediation of the Australian wealth protection business, this volatility may at times be amplified.
AMP’s ongoing insurance claims improvement program continues to deliver improved capability and customer outcomes and remains important to the long-term sustainability of the wealth protection business. In addition, we have seen the broader market re-price insurance providing increased flexibility to adjust prices upward if required.
CBA Update Mirrors Peers – Losses Up; Profit Down
CBA has released its unaudited cash earnings for 3 months to 31st March 2016 of $2.3 billion and a statutory net profit on an unaudited basis of $2.4 billion. They reported that income growth and net interest margin was similar to 1H16. Costs were higher. Wealth Management funds under management fell, reflecting falling investment markets. Loan impairment expense was higher at $427m or 25 basis points, reflecting exposures in the institutional lending portfolio and consumer losses. Total provisions were higher at $3.9 billion.
 Group Troublesome and Impaired Assets was also up, at $6.3 billion.
 Consumer arrears were in line with expectations, despite higher home loan arrears in mining impacted areas of WA and QLD.
 Personal loan arrears remained elevated.
 The Group’s Basel III CET1 APRA ratio was 10%, down from 10.2% in Dec 15. Comparable CET1 ratio at 31 March 2016 was 13.9%. The Group’s leverage ratio was 4.9% on an APRA basis and 5.5% on an international comparable basis.
 Customer deposits comprised 64% of funding (reflecting above system deposit growth) and the average tenor of wholesale funding was 4.2 years. The Group issues $13 billion of long term funding in the quarter.
NAB 1H 2016 Results – Moving into Clearer Air?
National Australia bank released their results for 1H 2016. They reported cash earnings of $3.31 billion, up 6.5% compared to March 2015 half year but 1.4% from 2H15. This is of course after the separation of the UK business. Pretty much in line with expectations.
Net operating income was up 2.0% from 2H15 to $8,923m, or up 3.3% from March 15.
 Expenses rose 4.2%, reflecting investment in the Group’s priority customer segments and increased technology and personnel costs.
 Underlying profit was up 2.0% from 2H15 to $5,092m, or up 2.7% from March 15. Excluding discontinued operations, statutory net profit increased 2.4%. The cash ROE was 14.1%.
On a statutory basis, net loss attributable to the owners of NAB was $1.74 billion, a decrease of $5.18 billion. This reflects discontinued operations losses, in particular the loss on demerger and Initial Public Offering of CYBG PLC of $4.22 billion as previously disclosed in NAB’s 2016 First Quarter Trading Update, combined with a charge of $801 million relating to provisions for conduct costs pursuant to claims under the Conduct Indemnity Deed with CYBG.
Whilst the business has been simplified, there is now reliance on the Australian business, and especially mortgage lending. We see increased lending balances, higher Group net interest margin (NIM), and stronger NAB Wealth net income, partly offset by weaker Markets and Treasury income. Group NIM rose 1 basis point, reflecting benefits of repricing in home lending and deposits, partly offset by higher wholesale funding costs and competition for business lending.
The ratio of Group 90+ days past due and gross impaired assets to gross loans and acceptances of 0.78% at 31 March 2016 compares to 0.63% at 30 September 2015 and 0.77% at 31 March 2015. Inclusion of A$522 million of New Zealand dairy impaired assets currently assessed as no loss based on security held accounted for 10 basis points of the increase in this ratio between 30 September 2015 and 31 March 2016.
The ratio of collective provision to credit risk weighted assets was 0.98% compared with 0.99% at 30 September 2015. The ratio of specific provisions to impaired assets was 36.4% compared with 30.3% at 30 September 2015.
The total charge for Bad and Doubtful Debts (B&DDs) was $375 million, down $24 million or 6.0%. However, compared to the September 2015 half year, the total charge increased $26 million or 7.4% reflecting higher specific provision charges in Australian Banking relating to a small number of large single name exposures, combined with increased collective provision charges for NZ Banking given the continued challenging outlook facing the dairy industry.
The Group’s Common Equity Tier 1 (CET1) ratio was 9.7% as at 31 March 2016, a decrease of 55 basis points from September 2015 mainly reflecting the impact of the CYBG demerger and IPO, including the conduct indemnity.
 The Group’s CET1 target ratio remains between 8.75% – 9.25%. NAB is considering issuance of a new ASX listed Additional Tier 1 capital security, subject to market conditions, including any competing supply.
After the changes to ratio calculations from 1 July 2016, the pro forma March 2016 CET1 ratio will become approximately 9.3% taking account of revised mortgage risk weight increase (-80bps), wealth debt maturity (-8bps), and 80% sale of NAB Wealthʼs life insurance business for $2.4bn less separation and transaction costs (+50bps).
Leverage ratio is 5.3% on an APRA basis and 5.7% on an internationally comparable basis. The Net Stable Funding Requirement (NSFR), is estimated to be “slightly below” 100% target – subject to APRA’s final interpretation.
The interim dividend is 99 cents per share fully franked, unchanged from the 2015 interim and final dividends. The target payout range will be 70-75% – based on ROE and RWA growth expectations, although the 1H16 payout ratio was 78.8%. This ratio optimises the use of franking credits (after payment of the interim dividend, estimated franking surplus of $590m), although 1H16 payout falls to 69% after DRP (assuming 12% participation).
The Group maintains a well diversified funding profile and raised $17.7 billion of term wholesale funding in the March 2016 half year across a range of markets. The weighted average term to maturity of the funds raised by the Group over the March 2016 half year was 4.7 years. The stable funding index was 89% at 31 March 2016.
The Group’s quarterly average liquidity coverage ratio as at 31 March 2016 was 125%.
Looking in more detail at the segmentals.
Australian Banking cash earnings were $2,694 million, an increase of 5%. Revenue rose 4% reflecting higher lending volume…
 … and improved NIM, partly offset by weaker Markets and Treasury income.
 Expenses grew 6% due to performance based incentive normalisation, Enterprise Bargaining Agreement salary increases and higher project and technology costs. B&DD charges were $341 million, a decrease of 7% with lower collective provision charges including the non-repeat of an agriculture and resource sector overlay taken in the March 2015 half year partly offset by higher specific charges arising from a small number of large single name impairments.
Looking specifically at housing lending in Australia, growth was strongest via the broker channel, and the overall portfolio grew, with more than 57% of loans for owner occupation. Overall 39% of loans were interest only, with a bias towards the investment sector. NAB had 4,204 brokers under their owned aggregators, up from 3,700 a year before.
 They have an interest floor rate of 7.4% and serviceability buffer 2.25% including on existing debt, whilst the maximum LVR is 95% for owner occupier and 90% for investor – lower for high risk postcodes and non-residents. Interest only lending repayments are assessed on the residual principal and interest period.
Lending to non-residents <2% of total housing book, the maximum LVR is 70% and shading applies to foreign income. NABʼs 1Q 2016 residential property survey suggests foreign buyer demand has stabilised, but remains elevated at 14% of national new property sales and 9% established properties.
Excluding offset accounts and interest only, line of credit loans and Advantedge loans, 62.1% customers are more than 1 month in advance.
There has been a reduction in high LVR ratio loans.
 Delinquencies are low, but moving higher in some states, and the broker channel now matches proprietary channels. Portfolio 90 day+ is up from 0.45% to 0.51%, whilst impaired loans are 0.11%. 12 month rolling net write-offs/spot drawn balances are at 2 basis points.
NIM improved 5 basis points, mainly thanks to repricing.
 NZ Banking local currency cash earnings declined 3% to NZ$404 million with higher B&DD charges the key driver. Revenue rose 2% with higher lending volumes partly offset by lower NIM.
Expenses were well contained rising 2% and compared to the September 2015 half year declining 1%. B&DD charges increased by NZ$38 million or 83% as a result of higher collective provision charges mainly related to the dairy industry.
 Compared with the September 2015 half year B&DD charges declined 5%.
NAB Wealth cash earnings increased 12% to $249 million driven by stronger Insurance results. Net income rose 4% reflecting Insurance premium growth and pricing increases combined with improved claims expense and stable lapse performance.
 Expenses declined 1%, due to lower technology and project costs partly offset by an increase in the number of financial planners.
So overall, NAB has become a simpler business, with more reliance on the Australian business. The key question is whether the local economy will have sustainable growth, whether the housing sector can continue to grow, whether losses will rise, and how individual banks deal with the intense competition for owner occupied mortgages. Clearer air perhaps, but still some clouds in the sky!
ANZ 1H 2016 Takes A Hit
ANZ has announced a statutory profit after tax for the half year ended 31 March 2016 of $2.7 billion down 22% and a cash profit of $2.8 billion down 24%, following a $717 million net charge primarily related to initiatives to re-position the Group for stronger profit before provisions growth in the future. The new CEO is clearing the decks!
 The main hits came from the Institutional Bank and Specific Items as part of the banks refocus under the new CEO. Specific items are (on an after tax basis): an accounting change to the application of the Group’s software capitalisation policy ($441 million), impairment of the Group’s investment in AmBank ($260 million), a net gain in relation to Bank of Tianjin ($29 million) and Group restructuring expenses ($101 million), as well as the Esanda dealer finance sale ($56 million).
 Excluding these Specified Items, allowing for better comparison with previous periods, adjusted pro-forma cash profit was $3.5 billion down 4% and profit before provisions was up 5%. Operating profit was $3,499m which was flat compared with 2H15, and down 4% from 1H15 ($3,676m).
Operating income lifted 4% from 1H15, to $10,438m, or 2% compared with 2H15. The main fall was in the Institutional bank.
Operating expenses fell on a restated basis, to $4,701m, down 1%, but is 3% higher compared with 1H15 ($4,572m). Expenses should fall further as the business is simplified.
 The group net interest margin fell by 3 basis points, thanks to falls in New Zealand. NIM in Australia rose slightly.
 The total provision charge of $918 million ($892 million individual provision charge $26 million collective provision charge) is consistent with ANZ’s ASX disclosure of 24 March and equates to a 32 basis point loss rate. The loss rate is trending towards the long term average from historically low levels. Gross impaired assets were $2.9 billion up 6%, with new impaired assets flat compared to the prior half.
 Consumer loan impairment rose, whilst institutional and commercial were lower.
 On a cash basis, the return on equity fell from 13.3% (2H15) to 9.7% in 1H16. On an adjusted basis, it fell from 13.2% to 12.2%.
Common equity tier 1 ratio is up, the international comparable Basel 3 ratio is 14.0% (up from 13.2% 2H15). Using the stricter APRA calculation, the ratio went from 9.59% to 9.81%. Significantly though when the IRB capital floor moves to 25%, from 1 July 2016, the ratio will fall to 9.21%.
 The Interim Dividend of 80 cents per share fully franked is down 7% reflecting a move to gradually consolidate ANZ’s dividend payout ratio within its historic range of 60-65% of annual cash profit. The dividend payout ratio during the half of 84% primarily reflects the impact of specified items. On an adjusted pro-forma basis the ratio is 67%.
Looking in more detail at the Australian operations, with a focus on the mortgage book, home loan flows have been strong, with an 11% uplift from 1H15. ANZ has improved its share. 68% of flow were owner occupied loans (up from 57% IH15), and 53% of flow came via the broker channel. The total portfolio comprises of 48% via brokers, up slightly from 1H15. There has been a focus on growing share specifically in NSW.
 Mortgage growth means that 43% of total group lending in home loan related, up from 39% in 1H15. LVR at origination, at 71% has not changed. Investment loans in the portfolio fell from 40% to 37% , whilst offset balances, and interest only loans rose. There was a reduction in households paying ahead, from 43% to 40%. The absolute home loan loss rate remains low.
 However, looking at credit risk in the book, 71% is home loan related. There is a fall in high LVR lending (in response to regulatory intervention). 90 day delinquencies for home loans in Australia is rising a little, but is low at 0.70%. Losses are higher in the corporate sector. We also see a rise in delinquencies in WA and QLD, as the mining down turn bites harder.
 So, in summary, and looking beyond the noise of the restructure, underlying revenue and profit is in line with expectations, and the losses had been flagged previously. However, we see the same stresses in the Australian mortgage book – where more eggs are being placed. Any fall off of growth in mortgage lending, or rise in delinquencies will have a significant impact down the track. That said, the “stick to you knitting” strategy, with less focus on the more complex and risky Asian dimensions makes sense.
Westpac 1H 2016 Results Underscores Tighter Banking Environment
Westpac Group has announced First Half results for 2016. Whilst statutory net profit was $3,701 million, up 3% over the prior corresponding period it was 16% down from 2H15. Cash earnings were $3,904 million, up 3% from 1H15, but down 3% from 2H15. Cash earnings per share was 118.2 cents, down 2% on 1H15 and down 7% on 1H16. Cash return on equity (ROE) was down 166 basis points from 1H15. and down 172 basis points from 2H15, to 14.2%. The interim, fully franked dividend was 94 cents per share (cps), up 1% on the 2015 interim dividend and in line with the 2015 final dividend. They lifted the payout ratio to around 80%.
The bank is having to work hard to maintain momentum, with the lower rates on deposits, the main lever. Tighter lending standards are showing in the Australian mortgage book, as are rising delinquencies. There are headwinds in the Institutional Bank and New Zealand. The question becomes, is it sustainable to pay current dividend rates into the future? Will 2H16 impairment charges be lower as the bank suggests? What will the next capital lifting initiatives be (they were silent on this, indicating they were in the top quartile of banks globally), given we expect ratios will be going higher.
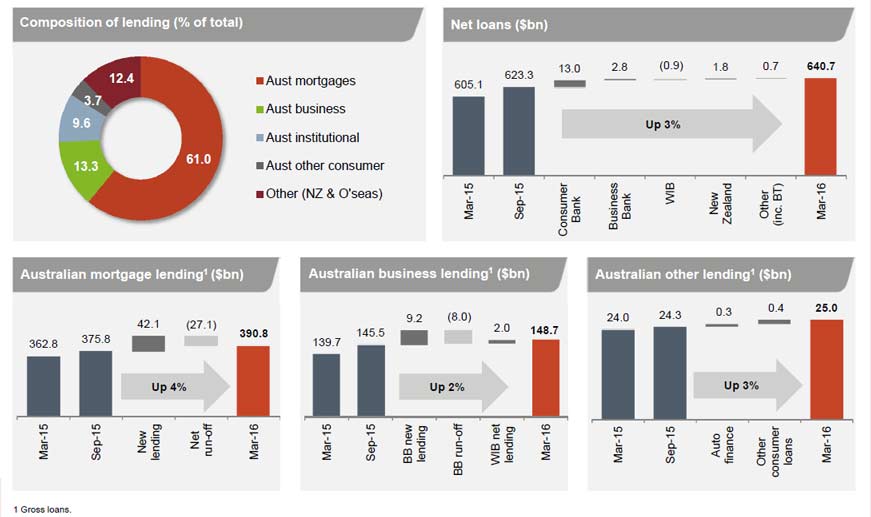
Lending and customer deposit growth of 6% and 5% respectively. Net interest income was $7,653 million, up 10%, with net interest margin up 9 basis points. Total lending rose 6% from March 2015, with above system growth in Australian mortgages, up 8%, and Australian business lending rising 6%. Lending in New Zealand increased 7% in NZ dollars. The bank is heavily reliant on the performance of its mortgage book in Australia. Customer deposits increased $21.7 billion, or 5%, with the deposit to loan ratio at 69%.
 Excluding Treasury and Markets, net interest margins were up 6 basis points. But NIM in New Zealand and Institutional Bank fell. Actually the biggest contribution was from reducing interest rates on deposits.
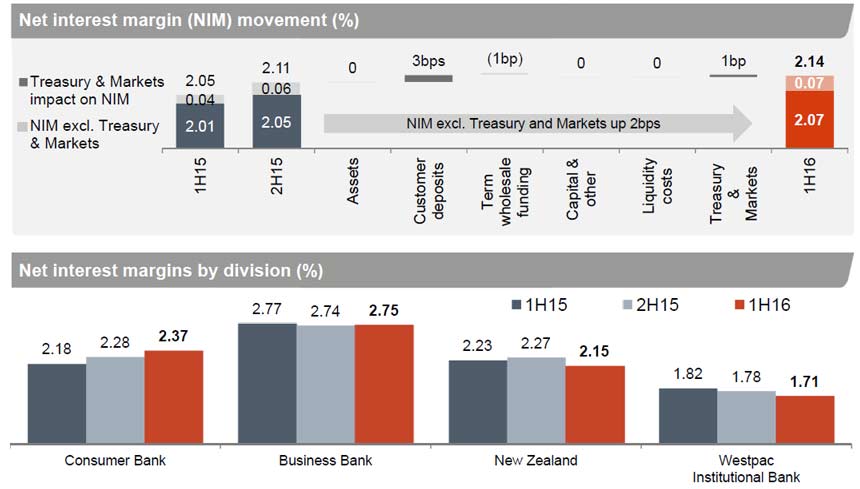 Non-interest income of $2,966 million was down 4%. Excluding infrequent and volatile items, most of the decline was due to lower Australian credit card interchange income and lower institutional fee income in line with more subdued debt origination
An improved expense to income ratio of 41.6%, down 3 basis points from 2H15, with expenses up 4%, mostly related to higher investment including increased technology and professional services costs
Stressed assets to total committed exposures falling 9 basis points to 1.03%. But impairment charges increased $326 million due to lower write-backs, increased provisions for a small number of larger institutional facilities, and from a modest rise in consumer delinquencies. An increase in the stressed exposures ratio of 4 basis points over Second Half 2015 principally reflects a rise in consumer delinquencies, including in geographies more affected by the slowdown in mining. We see mortgage deliquencies rising in WA and QLD (but a rise shows in all states, from a low base).
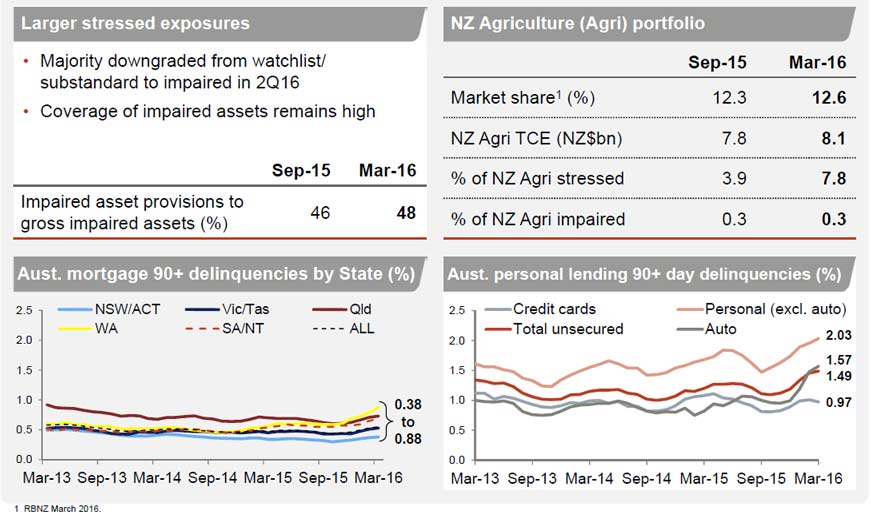 The credit quality of the Group’s portfolio was little changed since First Half 2015 with stressed exposures to total committed exposures of 1.03%, down from 1.12%. But Westpac Institutional Bank (WIB) was affected by lower net interest margins and significantly higher impairment charges related principally to four large exposures which added $252 million to provisions. Impaired assets remained low at 0.26% of total committed exposures, but was up 2 basis points over the year, while the provision coverage of impaired assets has remained high at 48%.
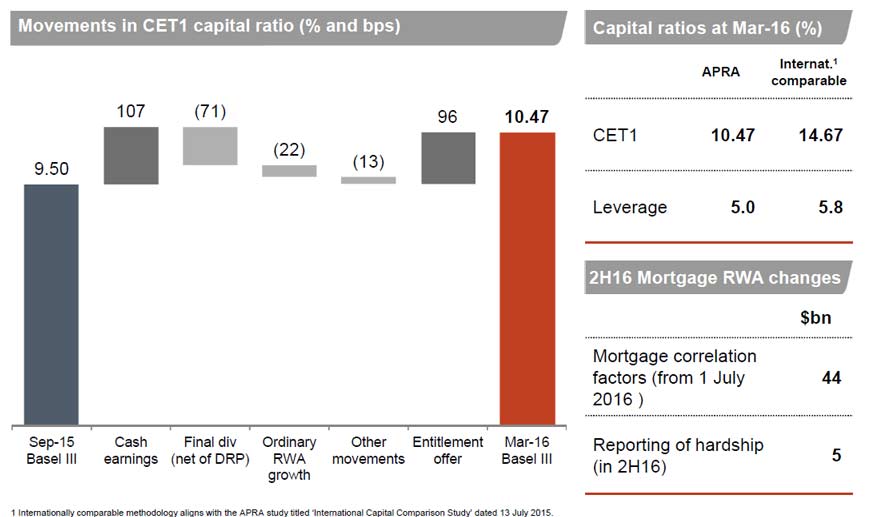
The Group raised around $6 billion in equity over calendar 2015, lifting the Group’s common equity Tier 1 ratio to 10.5%, up 171 basis points. On an internationally comparable basis, Westpac’s CET1 ratio was 14.7% and comfortably in the top quartile of banks globally.
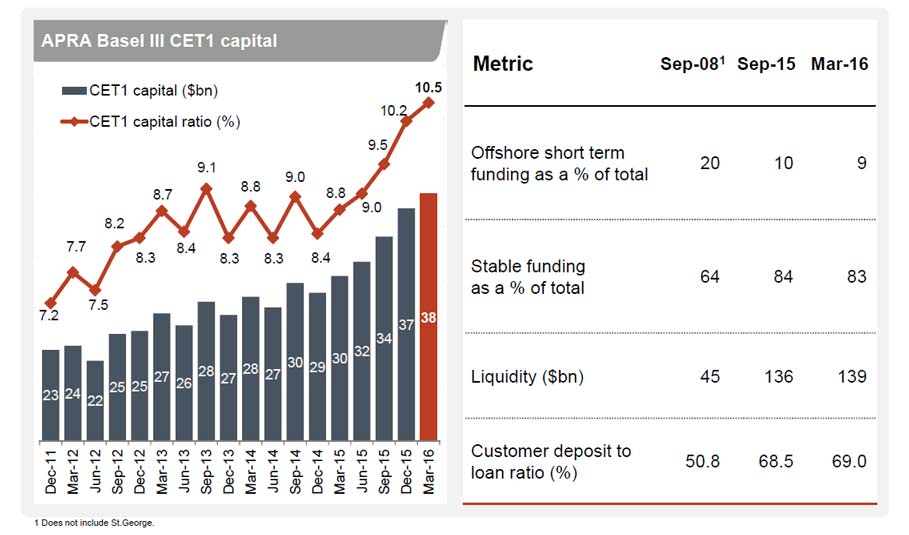 There were no new capital raising initiatives announced this time, but the impact of the earlier entitlement offer can be seen in the results – lifting the capital ratio by 96 basis points.
- Consumer Bank continued to grow the value of the franchise, with more customers and above system lending growth contributing to a 15% rise in core earnings and a 16% rise in cash earnings. However, the impact of higher capital for mortgages reduced returns in this business. The business has continued to invest in improving service by transforming the network through the upgrade of 22 branches over the half, enhancements to self-serve options including more Smart ATMs, and increasing the functionality of its online platforms. We discuss the Australian mortgage book below.
- Business Bank grew core earnings by 5%, with good growth in lending. Non-interest income grew 3%, mostly through higher merchant revenue supported by the roll-out of new state-of-the-art payment terminals. Cash earnings were lower, down 3%, due to higher impairment charges. While asset quality has improved, a reduction in write-backs and an increase in auto delinquencies contributed to a $118 million increase in impairments.
- BT Financial Group continues to be a leading provider of wealth solutions in Australia, with a Funds Under Administration (FUA) share of 19.6%. BTFG saw cash earnings little changed over the year with business growth offset by a reduction in Funds Management earnings mostly due to lower markets and the partial sale of BTIM in Second Half 2015. The business continued to benefit from good flows into FUM and FUA, while continued success in Private Wealth has seen lending increase 8%. Insurance has also continued to expand with Life in-force premiums up 12%.
- Westpac Institutional Bank delivered cash earnings of $517 million, down $136 million. The lower result was driven by a $201 million increase in impairment charges, a reduction in fund performance fees, and lower margins. The division maintained its leading market position, growing customer numbers and generating good flows in FX. However, the more challenging market conditions from high levels of global liquidity continues to place pressure on margins. While asset quality was maintained, including a further reduction in stressed assets, downgrades to a small number of exposures was the main contributor to the higher impairment charge.
- Westpac New Zealand’s cash earnings were up 2% to NZ$445 million. The business has continued to grow broadly in line with system while steadily expanding its wealth and insurance business. However, intense competition for new lending and a shift to lower spread fixed rate mortgages has compressed margins. Notwithstanding deteriorating financial conditions in the dairy sector, asset quality has remained sound and consumer delinquencies remain near historic lows, contributing to continued low impairment charges.
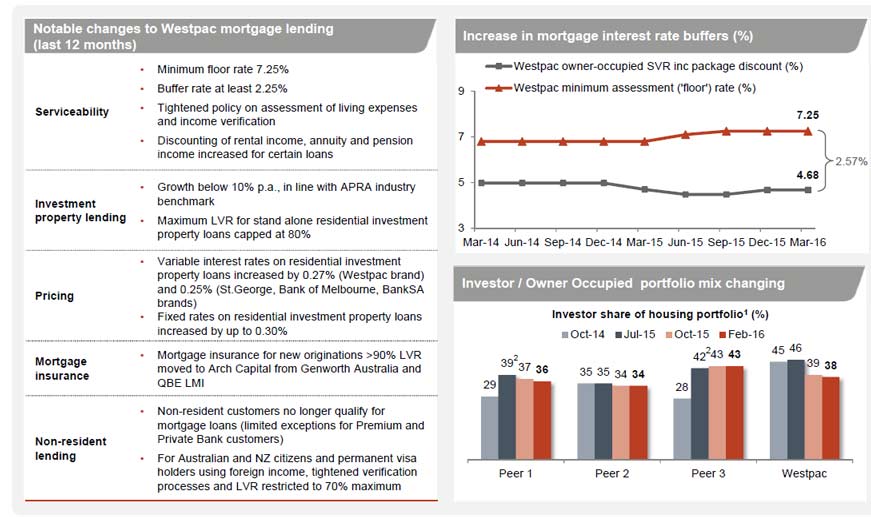
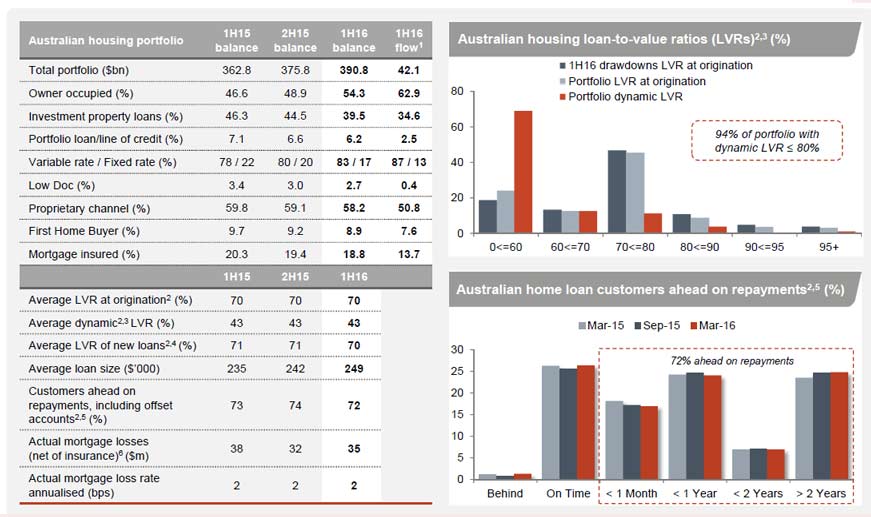
Finally, we look at the Australian mortgage book, because this is such a large part of the banks business. Lending standards have been tightened. We see considerable growth, with a reduction in investment loans – after adjustments to 7.2% from 9.9% in September 2015.
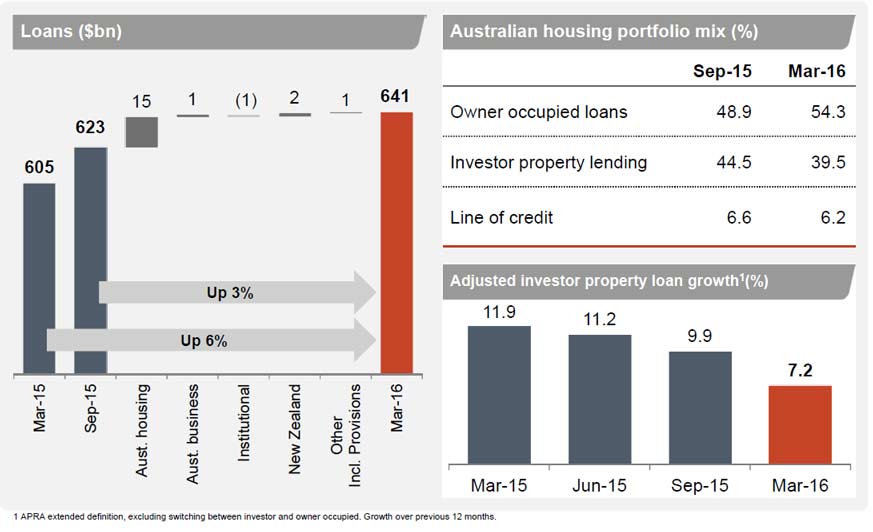 They provided some detail in the portfolio, with 94% of the portfolio with a dynamic LVR of below 80% and 72% of borrowers ahead with repayments (many because they have an offset account). A greater flow of mortgages are coming via the broker channel ~50%. The average loan size is still rising and the average LVR falling a little. Actual mortgage losses are stilling at 2 basis points.
 Looking at the investment portfolio, the average LVR of new loans is now 67%, down from 70% 1H15. The +90 day delinquency rates are at 38 basis points, compared with 31 basis points in 2H15. 62% of households are ahead with repayments (including offsets), down from 65% in 2H15.
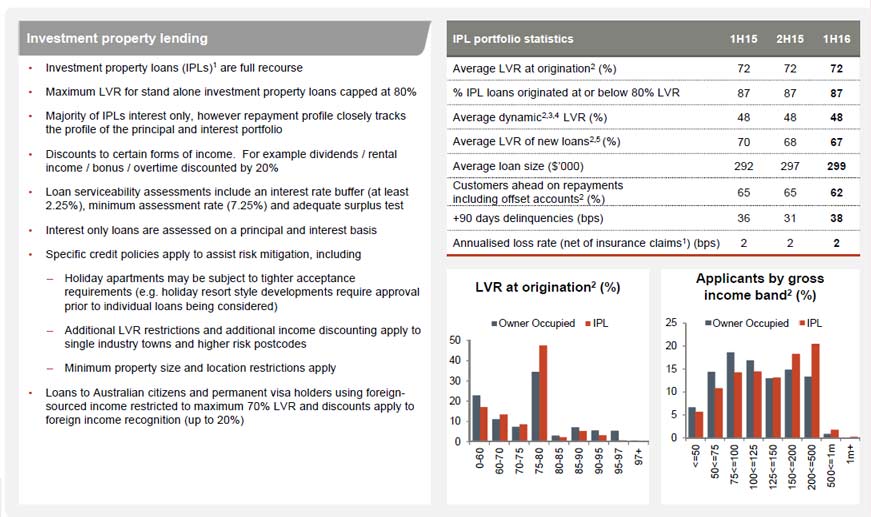 Westpac is now working on a minimum floor rate of 7.25% and they have tightened serviceability criteria and have stopped lending to most non-resident customers.
Bendigo and Adelaide Bank Update
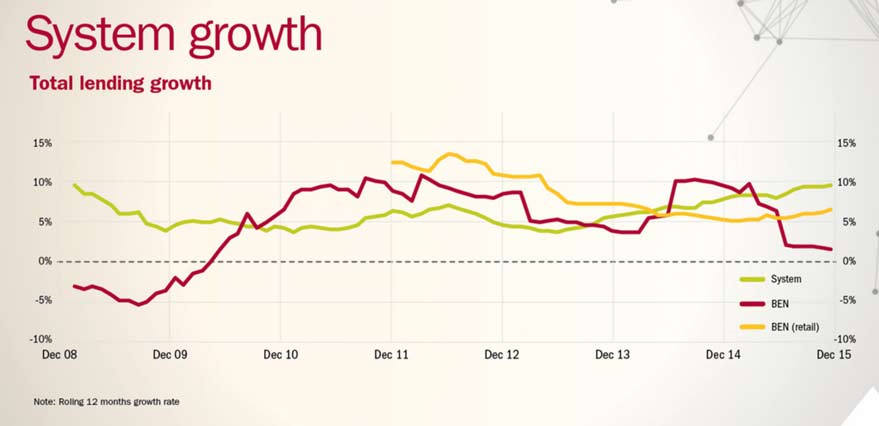
In their business strategy and trading update today, they recapped on lending growth which has been below system, and that they have a cost to income ratio which is still high (~2% above Suncorp).
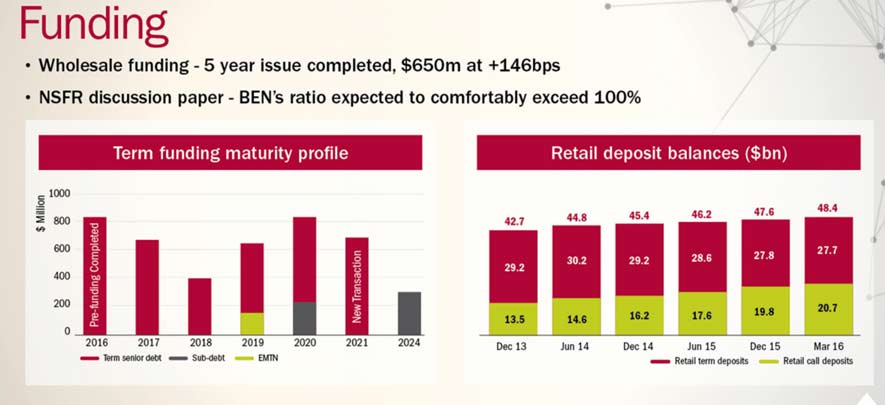
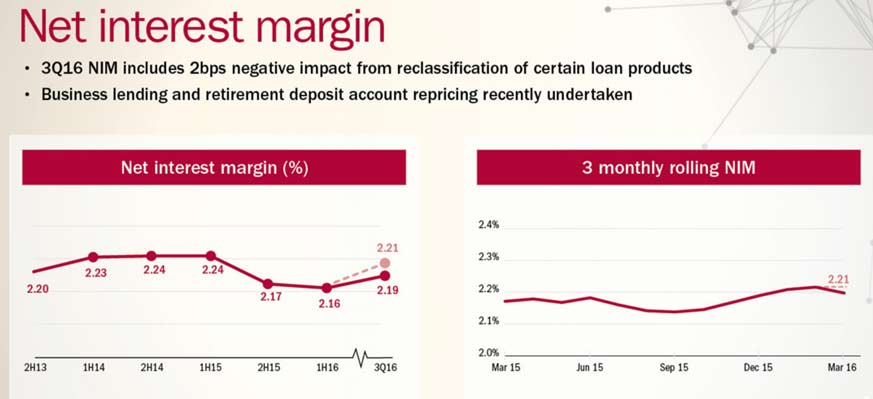 However, the bank is quite well positioned from a funding perspective. 81% is deposit funded, could go higher, this is significant because RMBS market funding pricing is line ball at the moment. They have moved from 20% to 6% RMBS, and this has created a capital headwind, so they will most likely focus on senior funding.
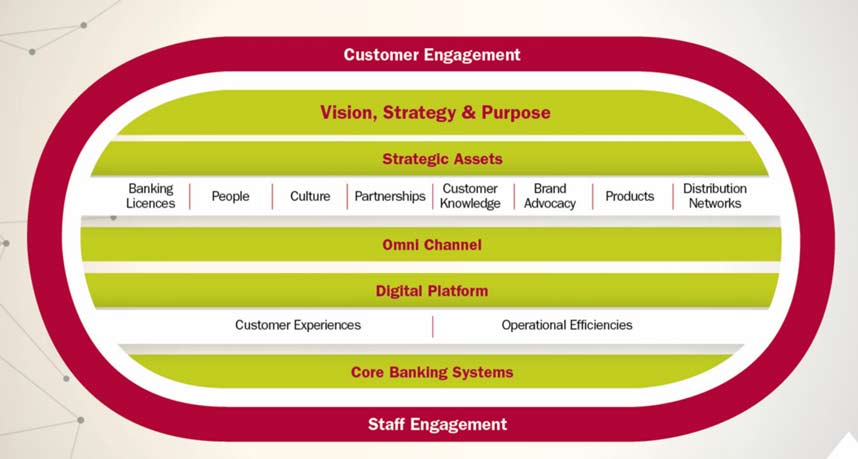
 In terms of Strategy, Bendigo and Adelaide Bank, describes its aim to build around customer engagement and staff engagement, with an expectation that digital channels and customer centricity will out.
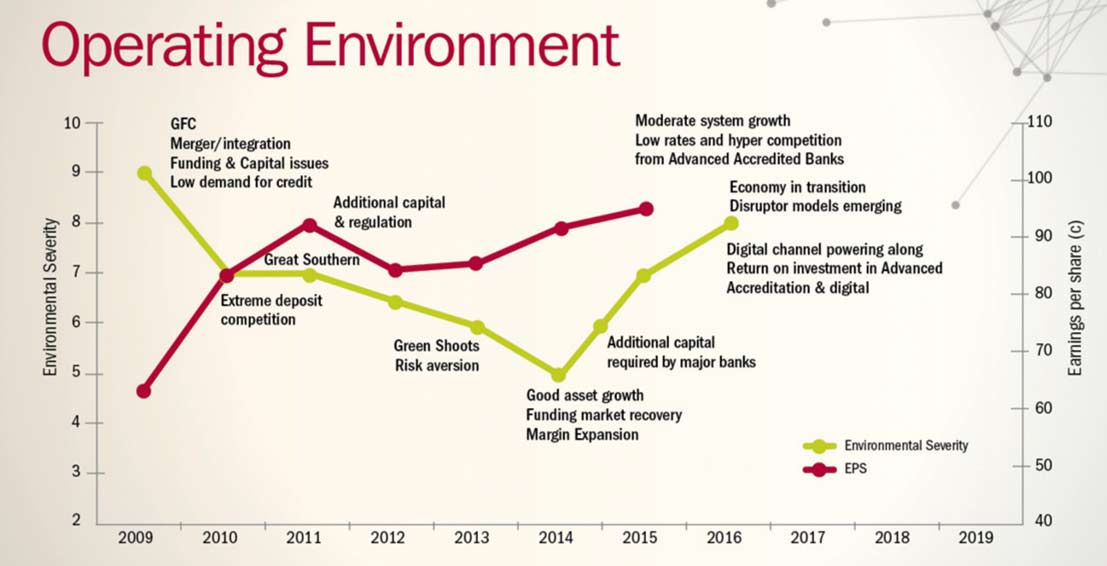 They are driving towards 24/7 digital platform, underpinned by their core banking system. Their vision is to be the most customer connected bank with a focus on customer service and the strengthening of core relationships.
 However it is clear they are banking on benefits of moving from standard to advanced IRB capital model. Whilst they may wish to move to this basis, and this may be a phased implementation, it will be APRA who is holding the implementation cards. There is a benefit as their current mortgage risk weighting is about 39 basis points, whereas the major banks have a 25 basis point target by July 2016.
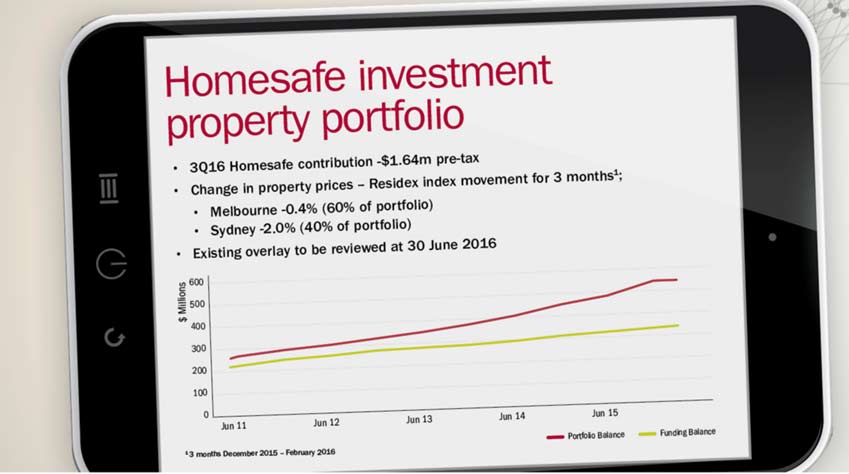
Homesafe will continue to be a drag on the business if property valuations in the major centres fall as the portfolios have to be marked to market, they of course had upside in the good times! 3Q16 Homesafe contribution was -$1.6m pre-tax. There are 2,500 contracts in the portfolio, average $125,000 funded.
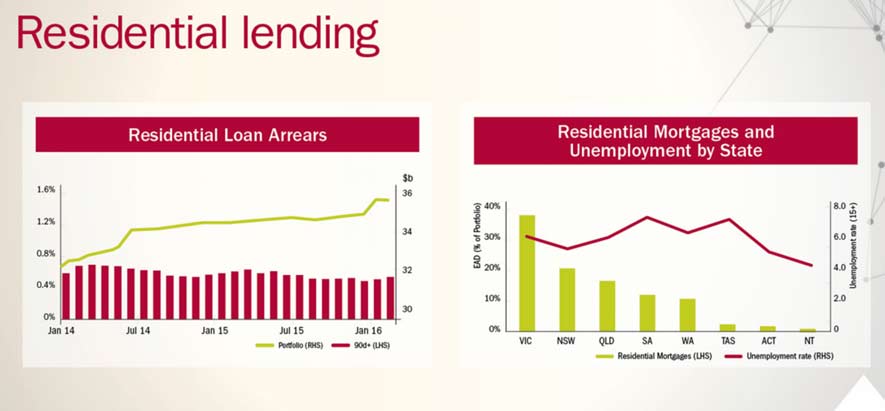
 Lending will be important and they wish to grow their books, with a focus on mortgages and small business (both highly contested areas). Arrears on mortgages and business seem under control.
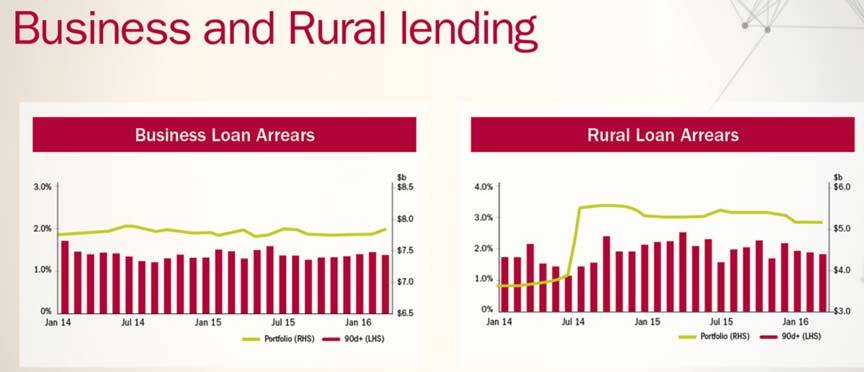 They have a significant investment path in order to build the digital platform and IRB models. Restructure costs will be $2m or more in the half. The question will be whether the benefits out way the costs. You cannot really argue with the strategy, (though, it is not really a mobile first strategy), but its all about effective execution in a highly contested environment. The high customer satisfaction ratings will certainly assist.
Bank Of Queensland 1H Results Show Revenue Under Pressure
BOQ today announced interim cash earnings after tax of $179 million for the six months to 29 February 2016. This was below consensus of $186m thanks to lower revenue grow, despite good cost control, and lower provisioning. However, the announcement today of lifts in home loan pricing will assist going forwards. We will see if other lenders follow, as we think they might.
Statutory profit after tax rose 11 per cent to $171 million on the prior comparative half.
On a cash basis, BOQ’s basic earnings per share were up 5 per cent on the prior half to 47.8 cents. Return on average tangible equity increased 20 basis points to 14 per cent, and return on average equity was up 20 basis points to 10.5 per cent.
Managing Director and CEO Jon Sutton said the result was driven by above system housing lending growth and strong asset quality levels. The Bank also maintained its Net Interest Margin and kept costs under control.

 The BOQ Board has determined to pay an interim dividend of 38 cents per share fully franked, an increase of 2 cents on 1H15.
Loan Growth – BOQ achieved above System loan growth of $2 billion (1.2x System) for the half predominantly as a result of its decision to diversify distribution channels. Housing mortgage growth for the half was $1.7 billion (1.6x System), driven by strong growth through BOQ Specialist and the broker network.The third party strategy has allowed for home loan growth beyond QLD.

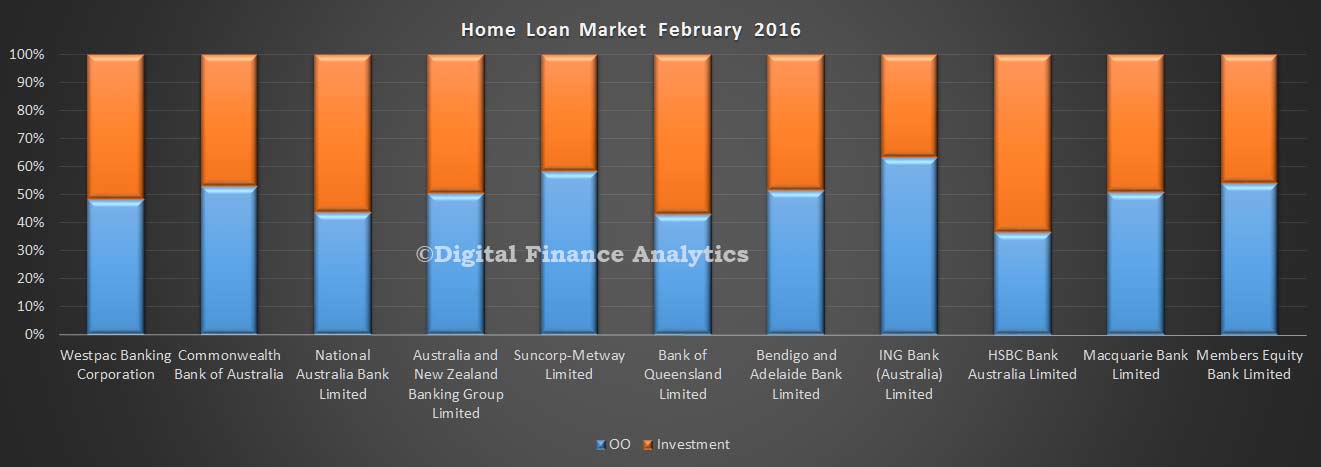
 Growth in these channels also improved the Bank’s mortgage portfolio diversification outside of Queensland and increased its lower LVR lending relative to the portfolio. They did not disclose the mix between investment and owner occupied loans. According to recent APRA data BOQ has one of the highest proportions of investment loans among the banks.
 Commercial lending growth was 6 per cent (0.5x System) for the half as it maintained a focus on credit quality and appropriate pricing for risk within its targeted niche segments. BOQ Specialist’s commercial loan book grew 14 per cent to $2.4 billion year on year while the BOQ Finance portfolio grew 1 per cent (0.6x System).
Net interest margin – BOQ maintained its 1H16 net interest margin at 1.97%. Benefits from repricing initiatives during the half were partially offset by front book and retention pricing. The targeted loan growth in new channels has resulted in a better quality loan portfolio that will support longer term balance sheet durability. BOQ has increased its variable home loan interest rates by 12 basis points for owner occupied loans and 25 basis points for investor loans, effective from 15 April 2016.
 The underlying credit quality of BOQ’s portfolio remained strong in 1H16. This reflects the Bank’s continued focus on prudent lending and risk management practices, as well as the low interest rate environment. Total loan impairment expense was flat on the prior comparative period at $36 million (1H15:$36 million). Total impaired assets across retail, commercial and BOQ Finance fell 7 per cent to $240 million (1H15: $259 million). Home lending arrears rose a little. Whether this is just a seasonal uptick, or something more systemic, we will see.
 Costs – BOQ’s cost to income ratio for the half was 46.4 per cent including one-off restructuring costs of $7 million pre-tax. Excluding one-off costs, the cost to income ratio was 45.1 per cent with underlying cost growth of 3.8 per cent from the prior comparative half, in line with market guidance provided at the end of the 2015 financial year. The Bank continues to focus on its goal to reduce its cost to income ratio to the low 40s in the years ahead.
 Capital and Funding – Customer deposit growth of $1.3 billion helped BOQ maintain a stable deposit to loan ratio of 66%, with a slight fall in the proportion of long-term funding via securitisation. The ratio of long-term to short-term funding improved a little.

BOQ’s Common Equity Tier 1 ratio decreased 11 basis points to 8.80 per cent during the half, driven by strong loan growth in the second quarter without a full period earnings benefit.
 BOQ said this ratio remains solid compared to peers and positions BOQ well for any regulatory changes to capital or risk weighting requirements. BOQ does not use IRB capital methods, so is not necessarily under the same pressure to lift capital ratios.
BOQ positioned well for the future – Mr Sutton said BOQ’s progress against its strategic objectives positioned it well to deliver its goal of EPS outperformance over the longer term. Australia’s transition away from a resources led economy is ongoing. This presents good opportunities for expansion in the niche segments BOQ is targeting. Mr Sutton said he was also optimistic that the future regulatory environment would provide additional opportunities for standardised banks like BOQ.
ING Direct Australia Reports Record Profit
ING DIRECT Australia today announced a record net profit after tax of $314.7 million for the 12 months to 31 December 2015, an increase of 6% on the previous year.
ING DIRECT CEO Vaughn Richtor says industry leading customer advocacy is responsible for strong customer growth across all products, particularly the Orange Everyday payment account.
“A third of the growth in Orange Everyday accounts is coming from the recommendations of existing customers,” Mr Richtor said.
“It is particularly satisfying to see so many customers recommending ING DIRECT to family and friends.”
Mr Richtor says the strong growth in Orange Everyday payment accounts underpins ING DIRECT’s primary bank strategy.
“Having an Orange Everyday account increases our customers’ propensity to also have their savings account, a mortgage and superannuation with us,” Mr Richtor said.
2015 highlights include:
- Orange Everyday (payment account) customers up more than 47% to 144,869 (Total 418,049)
- Personal savings up by $2.1bn or 9.9%
- Total deposits up $0.9bn or 2.8%
- Branded mortgages up $3.8bn or 10.8%
- Total mortgages up 2.6% to $39.8bn
- Superannuation funds under management up 45% to $1.6b
- Number 1 Net Promoter Score (customers willing to promote the bank to friends and family)
Mr Richtor says ING DIRECT has largely completed the sale of its white label mortgage portfolio while focusing on growing branded mortgages.
“Our brand is successfully evolving from being a savings champion to becoming the main bank for our customers’ needs.” Mr Richtor said.
Mr Richtor, who was the founding CEO of ING DIRECT, announced his retirement from the business and will be leaving in June. Mr Richtor will be replaced by Uday Sareen from June.
“I am immensely proud of the business and what has been achieved since our launch in 1999,” Mr Richtor said.
“Our business model challenged the way in which Australians did their banking and, while some doubted we would succeed, the provision of value for money products and exceptional customer service has proved a winning formula.”
“Creating the right culture in an organisation is the best way of ensuring the business does the right thing by the customer,” Mr Richtor said.


