ANZ Trading Update to 30 June 2015

ANZ’s unaudited cash profit for the 9 months to 30 June 2015 was $5.4 billion up 4% and unaudited statutory net profit was $5.58 billion up 11%. Profit before Provisions over the same period grew 5.1% (+3.4% on a constant Foreign Exchange (FX adjusted) basis).

Revenue expense jaws were tracking broadly neutral on a constant FX basis. Revenue and expense growth trends compared to PCP were broadly similar to the first half 2015 experience, though revenue growth was a little stronger and expense trends improved slightly.

Customer deposits grew 9.5% (+5% FX adjusted) with net loans and advances up 7.7% (+5.4% FX adjusted).

The Group Net Interest Margin at the end of the third quarter was broadly stable on the end of the first half assisted somewhat by slower growth in lower margin liquid asset holdings and positive trends in funding costs which offset asset price competition.

Gross Impaired Assets have decreased 3% over the nine months to 30 June 2015. The total provision charge of $877 million or 21 bps increased 13%. While loss rates are expected to remain well under the long term average, ANZ estimates that the total impairment charge for FY15 will be ~$1.2bn, or 21 bps compared to 19 bps in FY14.

The Individual Provision Charge declined 12.5% to $750m and while the Collective Provision Charge increased it remained at a relatively low level in absolute terms at $127m. The Financial Year to date has seen a normalisation of the risk profile component of the Collective Provision Charge with a moderate number of credit downgrades being recorded whereas the prior corresponding period in 2014 saw a higher level of upgrades.

The movement in the risk profile component of the Collective Provision Charge in 2015 reflects ongoing macro-economic stress including in the resources and agriculture sectors. The contribution to the collective provision from portfolio growth was broadly steady period on period.

At 30 June 2015 ANZ’s reported APRA Common Equity Tier-1 (CET1) ratio was 8.6%. Following the completion of the $2.5bn Institutional placement, the June 2015 pro-forma APRA CET 1 ratio was 9.2%.

On the basis that $500 million is raised under the Share Purchase Plan, on the same pro-forma basis this would add a further 13 bps increasing the CET1 Ratio to 9.3%. ANZ has no plans to underwrite the FY15 Dividend Re-investment Plan.

ANZ has one tranche of ~$400m of ANZ Wealth Australia Limited debt remaining which matures in March 2016. This tranche will not be refinanced. The 10 bps impact is expected to be offset through capital management efficiencies.

The recent capital raising has allowed ANZ to deal with the known regulatory changes and position ANZ’s capital position within the top quartile of international peers. ANZ is liaising with APRA in regards to detailing its internationally comparable capital position, on the basis of current information, we expect our internationally comparable CET1 ratio to be around 13%. ANZ’s Liquidity Coverage Ratio improved from 119% to 121% during the third quarter ending 30 June 2015.

Looking at the segmentals:

The Australia Division’s strong performance from the first half has continued with ongoing momentum in lending and deposit flows, margins well managed and customer numbers increasing by circa 5% in both the Retail and Commercial businesses. The Retail business has delivered strong growth in both home lending and credit cards and the Commercial business is also seeing good lending growth, especially in Small Business Banking, with improved trends in the Corporate and Business Banking segments.

The New Zealand Division is delivering strong balance sheet growth with above market performance in Mortgages, Business Lending and Deposits. Revenue growth was underpinned by continued high levels of customer acquisition and brand consideration and an improved digital offering.

Positive underlying performance continued across the key businesses in the Global Wealth Division with strong in-force premiums growth, stable claims and lapse experience plus growth in Funds Under Management. Global Wealth innovations – in physical, digital and personal – continue to deliver simple accessible wealth solutions improving how customers think about their financial wellbeing.

International and Institutional Banking continues to perform well in difficult operating conditions arising from macro-economic factors such as the ongoing global liquidity surplus and weak commodity prices. Income in the Global Markets Business was up 6% to $1.8 billion. Customer sales grew 9% led by strong results in Asia and customer facing revenue remains at over 75% of the total Global Markets income. The Trade and Supply Chain business margin stabilised in the third quarter having been impacted by falling commodity prices. Cash Management


CBA Announce Results to 30 June 2015 With Profit up 5% and $5bn Share Rights Offer

CBA announced its results for the financial year ended 30 June 2015. The Group’s statutory NPAT was $9,063 million, which represents a 5 per cent increase on the prior year. Cash NPAT was $9,137 million, also up 5 per cent. The Group also announced the launch of a $5 billion pro rata renounceable entitlement offer for all shareholders. The Group remained one of only a limited number of global banks in the ‘AA-’ ratings category.

Whilst an impressive result, we see signs of margin compression and rising levels of arrears, which, together with higher capital costs may constrain future momentum.

Group net interest income increased by 5 per cent, with average interest earning assets up $50 billion to $755 billion and retail and business average interest bearing deposits – up $32 billion to $445 billion. However, net interest margin (NIM) decreased by 5 basis points to 2.09 per cent year on year driven by the negative impacts of the falling cash rate environment and an increase in liquid assets. Excluding treasury and markets, Group NIM was down 1 basis point over the year in a highly competitive, low-rate environment. Underlying Group nim dropped 3 basis points in the second half. The Australian bank margin continues to slide, with pressure in the second half.

CBA-June-2015---RBS-MarginsOther banking income increased 12 per cent due to increased commissions, higher trading income, which was driven by strong Markets sales and trading performance and a favourable counterparty valuation adjustment. This was partly offset by the implementation of a new derivative valuation methodology, Funding Valuation Adjustment (FVA), which resulted in an initial cost of $81 million.

Funds management income was flat on a “headline” basis at $1,938 million. Excluding the impact of Property transactions and businesses from the comparative results, income increased 8 per cent, driven by a 14 per cent increase in average Funds Under Administration.

Insurance income decreased 3 per cent due to an unusually large number of weather event claims during the year in New South Wales and Queensland.

Expense growth was higher, increasing 5 per cent on the prior year, due to staff expenses and the impact of the lower Australian dollar. The major driver of expense growth was growing regulatory, compliance and remediation costs, including those associated with a number of legislative reforms (FATCA, FoFA, Stronger Super), provisioning for the costs of the Advice Review program and ongoing regulatory engagement.

The Group improved its cost-to-income ratio by 10 basis points to 42.8 per cent, assisted by the continued focus on productivity initiatives which delivered savings of $260 million over the past 12 months.

In a relatively stable credit environment, the ratio of cash loan impairment expense (LIE) to gross loans and acceptances remained unchanged at 16 basis points. Total loan impairment provisions were $3.6 billion, and the ratio of provisions to credit risk weighted assets at 1.14 per cent.

CBA-June-2105---ProvisionsCollective provisions included a management overlay of $755 million including an increased economic overlay. 90 day home loan arrears are higher at Bankwest.

CBA-June-2015---90-DaysCustomer deposits, now account for 63 per cent of total funding. During the year, the Group issued $31 billion of long-term wholesale debt in multiple currencies.

The Group continued to invest in the long-term growth of the business, with $1.2 billion invested on initiatives including risk and compliance projects, technology and productivity; Ongoing organic capital generation delivered a Basel III CET1 ratio of 12.7 per cent on an internationally comparable basis and 9.1 per cent on an APRA basis. The APRA change increases risk weights from approximately 16% to 25%. As at 30 June 2015, the impact for CBA would result in a decrease of 95bps in CET1 (approximately $4bn).

The Group will offer entitlements to CBA ordinary shares pro rata to all eligible shareholders, which can be exercised to buy 1 new share for every 23 shares held on the record date for the offer at an offer price of $71.50 per new share at a 10.5 per cent discount to the dividend adjusted closing price on the ASX on 11 August 2015. The offer will be fully underwritten to raise approximately $5 billion. Approximately 71 million new fully paid CBA ordinary shares will be issued (approximately 4.3 per cent of shares on issue). Following the capital raising, the Group’s pro forma CET1 ratio will be 14.3 per cent on an internationally comparable basis (which assumes full implementation of the Basel III reforms), and 10.4 per cent on an APRA basis. In December 2013, APRA announced that the Australian major banks are domestic systemically-important banks (D-SIBs). From 1 January 2016, D-SIBs are required to hold 1% additional capital in the form of CET1 (called the D-SIB buffer)

CBA-June-2015---CET1Interesting to note the flow through of online activity into the bank, with the proportion of logins via a mobile device, and online sales rising. Absolutely no surprise, as foreshadowed in the DFA “Quiet Revolution” report. 39% of credit card sales were online.

CBA-June-2015---OnlineFinally, looking at the Australian Home Loan portfolio, CBA has the largest footprint for owner occupied loans. The chart below shows the combined CBA and Bankwest portfolio. Arrears are lowest in the fastest growing state, NSW.

CBA-June-2015---Home-Loans-1Looking specifically at investment property loans, CBA is growing its portfolio below the 10% speed limit, (9.7% compared with 11.5% system), and show lower arrears in the investment portfolio, and a larger borrower income footprint.

CBA-2015---Home-Loans-2 They provided one stress test scenario, in which stressed losses could be $3.17bn over 3 years, of which $1.98bn would be losses net of LMI recoveries. This is based on December 2014 data. Total stressed losses increased by 1% between June 2014 ($3.14bn) and December 2014 ($3.17bn), primarily due to growth in the Home Loan portfolio.

NAB Q3 2015 Trading Update

In NAB’s Q3 2015 trading update they say that undiluted cash earnings were circa $1.75bn. 9% up on the prior corresponding quarter. Statuary profit was about $1.85bn. Within these results, revenue was up 4%, but stripping out one offs relating to UK CRE and asset sales, was about 2% higher. Net interest margin declined and expenses were higher by 4%. The B&DD charge fell 15% to $193m, thanks to lower provisions in the Australian bank (or more accurately, no repeat of one-offs made last time).  Over 90 days impairments were 0.78% across the group, down from 0.85%.

Common equity tier 1 (CET1) was 9.94%, a lift of 107 basis points from March 2015, mainly thanks to the rights issue.

In the Australian business, revenue rose on higher home lending and business lending, but offset by weaker Markets and Treasury income and and weaker business lending margins.

Issues remain about the costs of the UK exit. For example, a provision of £290-420m relating to payment protection liabilities, and £60-80m relating to interest rate hedging redress. They had flagged a £1.7bn estimate for the mitigation package and these more specific provisions will be an offset. However, there are still some unknowns.

Bendigo and Adelaide Bank Full Year Cash Earnings Up 13.1%

In the just released results, Bendigo and Adelaide Bank has announced a profit of $423.9 million to June 30 2015.  However, this is more from efficiency and provision adjustment than underlying business momentum, in our view, in a tough market. Nevertheless, they do have a good core franchise, with a relatively high customer satisfaction rating.

Underlying cash earnings were up 13.1%. Net interest margin was squeezed by 4 basis points to 2.20%, reflecting competition in the low interest rate environment. It dropped further in 2H15 to 2.17%. Common equity tier 1 ratio increased 15 basis points to 8.17%. Total capital increased 118 basis points to 12.57%. They continue to focus on achieving advanced capital accreditation, but are not there yet.

Lending growth at 5.3% was below system (7.5%), whilst business lending was 10%, above system, of 8.3%. Home lending was also slower than system growth, and they noted a 20% increase in excess repayments.

Great Southern specific provisions were reduced from $323.8m to $257.7m since December 2014.

They have been focussing on efficiency management, with the expense to incomes ratio down, though overall operating expenses rose 6.6% to $878m.

Looking at the segmentals, retail banking and rural were up, whilst wealth and third party banking were down.

BendigoFy15SegsBad and Doubtful debt provisions were down 16.6%, to $68.1m. However, 2H15 were higher due to $15.9m provision for Great Southern. We note that 90 day+ arrears were up for residential to  (~1.3%) and business to (~1.7%). Rural, their highest growth sector, had highest arrears around 5.5%.

ANZ Announces Capital Raising, and Glimpse Of Trading Update

ANZ today announced a fully underwritten institutional share placement to raise $2.5 billion.

The Placement will be followed by an offer to ANZ’s eligible Australian and New Zealand shareholders who will have the opportunity to participate in a Share Purchase Plan (SPP) to raise around $500 million. The SPP is not underwritten.

The Institutional Placement and SPP will allow ANZ to more quickly and efficiently accommodate additional capital requirements recently announced by the Australian Prudential Regulation Authority (APRA), in particular the increase in average credit risk weights for major bank Australian mortgage portfolios to 25% taking effect from 1 July 2016.

ANZ’s shares have been placed in a trading halt with trading expected to resume at 10.00am on 7 August 2015.

On a 30 June 2015 pro-forma basis, the placement would add approximately 65 basis points (bps) to ANZ’s CET1 Capital Ratio increasing it to 9.2%. If $500 million is raised under the SPP, on the same pro-forma basis this would add a further 13 bps increasing the CET1 Capital Ratio to 9.3%. This capital raising should position ANZ Capital Ratio in the top quartile of international banks on an internationally harmonised basis, the bank said.

ANZ will release a scheduled Trading Update on 18 August. Ahead of that and to accompany today’s capital raising announcement ANZ advises the following financial results on an unaudited basis:

  • For the nine month period to 30 June 2015, Cash Profit was $5.4 billion, an increase of 4.3% on the same period in 2014 ($5.18 billion). Profit before Provisions over the same period grew 5.1% (+3.4% on a constant Foreign Exchange (FX) basis).
  • On a constant FX basis for the nine month period to 30 June 2015, revenue expense jaws were broadly neutral. Revenue for the three months to 30 June 2015 grew at a slightly faster rate than in the first half, while expense growth for the three month period slowed.
  • The total provision charge for the nine month period to 30 June 2015 was 13% higher at $877 million. While the Individual Provision charge reduced 12.5%, the Collective Provision charge increased due to balance sheet growth coupled with some risk grade migration related to the resources and agriculture sectors. For the Full Year 2015, while loss rates are expected to remain well under the long term average, ANZ estimates that the total loss rate will be around 21 bps equating to a total provision charge of circa $1.2 billion given increased collective provisioning.
  • Customer Deposits for the nine month period to 30 June 2015 grew 9.5% (+5% FX adjusted) with net loans and advances increasing 7.7% (+5.4% FX adjusted).
  • During the third quarter (period 1 April to 30 June 2015) the Group Net Interest margin remained broadly stable assisted somewhat by slower growth in lower margin liquid asset holdings.
  • The CET1 Capital Ratio was 8.6% at 30 June 2015.

Suncorp Reports Full Year Profit Up 55%

Suncorp Group reported NPAT of $1,133 million (FY14: $730 million) for the 12 months to 30 June 2015. Profit after tax from business lines was $1,235 million (FY14: $1,330 million). Further efficiency benefits should flow next year.

The result was achieved despite the financial impact of Suncorp’s worst year of natural hazard events which had a net impact of $1,068 million, well above the allowance of $595 million.

The Group’s strong capital position and improved financial performance has allowed the Board to declare a final ordinary dividend of 38 cents per share and a special dividend of 12 cents per share.

The Building Blocks, Simplification and Optimisation projects are allowing Suncorp to grow its customer base while maintaining strong margins. During the year, margins have increased with the General Insurance UITR at 14.7% and the Bank NIM at 1.85%.

Based on capital levels at 30 June 2015 on an ex-dividend basis, the Suncorp Group will continue to hold $570 million in capital above its operating targets. The General Insurance CET1 is 1.40 times PCA and the Bank CET1 is 9.15%.

Suncorp has made the following market commitments that align with the shareholder promise to build a simple, low risk financial services group that delivers both high yield and above-system growth. In the medium term, Suncorp’s key targets are:

1. ‘above system’ growth in key target markets
2. Optimisation benefits of $170 million in the 2018 financial year
3. ‘meet or beat’ an underlying ITR of 12% through the cycle
4. sustainable return on equity of at least 10%
5. an ordinary dividend payout ratio of 60% to 80% of cash earnings
6. continuing to return surplus capital to shareholders

Looking at the segmentals:

General Insurance

General Insurance NPAT was $756 million, despite the financial impact of over $1 billion in natural hazard events. The result was driven by underwriting discipline in a highly competitive market and a focus on claims and expense management. Improvements in long-tail claims management resulted in reserve releases of $427 million. Personal Insurance gross written premium (GWP) reduced by 2.5%, however customer unit growth was positive over the year as reinvestment of efficiency benefits improved customer retention. Commercial Insurance GWP grew 2.2% impacted by a reduction in Workers’ Compensation GWP in Western Australia. Compulsory Third Party (CTP) GWP grew by 5.9% with Suncorp leveraging the scale of its national CTP model to enter new markets. New Zealand GWP was up 5.7% (in A$ terms) due to strong growth in personal lines and positive customer unit growth in commercial lines. Reported ITR was 11.4% and the UITR increased to 14.7%. Simplification continues to deliver increased efficiency across both claims and support functions. Customers and shareholders are also benefiting from improved claims management following vertical integration initiatives such as SMART, SMARTplus and ACM Parts.

Suncorp Bank

The Bank delivered NPAT of $354 million, up 55.3%. This significant increase was achieved through an improved NIM and lower impairment charges. Home lending growth of 7.1% reflects the success of the Bank’s improved product offering while also maintaining conservative lending standards and focusing on the ‘below 80%’ loan to value ratio (LVR) market.

SuncorpJuly20151The NIM improved by 13 bps to 1.85%, benefiting from improvements in funding composition and favourable term deposit pricing.

Suncorp Life

Suncorp Life’s NPAT was $125 million, up 35.9%. Underlying profit was $113 million, up 34.5%. Underlying profit was above target, benefiting from positive claims and lapse experience and a focus on cost control with operating expenses down 7.3%. The NPAT benefited from a reduction in long-term interest rates which will unwind when rates increase.
Annual in-force premium increased to $970 million, with total in-force premiums up 6.5%. Suncorp Life continues to focus on value over volume and this is reflected in the value of one year’s sales (VOYS) which has more than doubled to $25 million.

Reinsurance update and resolution of the 2011 reinsurance issue

At the half-year results announcement on 11 February 2015, Suncorp advised that there was a potential issue relating to recoveries under the 2011 catastrophe reinsurance program. This potential issue had a maximum financial impact of $118 million after tax. Suncorp has now largely finalised commercial negotiations with all stakeholders, the effect of which reduced the impact of this issue to less than $20 million after tax. Negotiated arrangements include one-off ex-gratia payments and other recovery payments from key reinsurance partners.  In consideration for this support, Suncorp has provided, and in some cases increased, participation for some reinsurers on key reinsurance protections including adverse development cover and multi-year catastrophe covers. While unrelated to the claims recovery, these support items benefit Suncorp in 2015 and have also contributed to mitigating the impact of this issue. The 2016 financial year catastrophe program and the additional multi-year covers have been purchased on favourable terms relative to the 2015 reinsurance program.


Macquarie 1QFY16 Briefing Bullish

Macquarie Group reported both annuity-style businesses’ and capital markets facing businesses’ contributions  for the first quarter of the 2016 financial year were significantly up on the first quarter of the 2015 financial year and broadly in line with the prior quarter. Australian mortgage portfolio also increased 10 per cent to $A27.0 billion in the first quarter.

DFA estimates that profit growth in FY16 will be more than 10 per cent higher than the prior year, around A$1.8 billion.  This is helped by a weaker Australian dollar, as well as increased performance fees and asset disposals in Macquarie Asset Management. The full year number to 31 March 2015 was $A1.6 billion an increase of 27 per cent on the prior year.

Macquarie remains over capitalised with APRA Basel III Group capital of $A15.8 billion at 30 June 2015, a $A2.4 billion surplus in excess of Macquarie’s minimum regulatory capital requirement from 1 January 2016, which was down from $A2.7 billion at 31 March 2015. The APRA Basel III Common Equity Tier 1 (CET1) ratio for Macquarie Bank was 9.9 per cent at 30 June 2015, which was up from 9.7 per cent at 31 March 2015.

The APRA changes to the level of capital required to be held against residential mortgages will  impact Macquarie by $A150m (at 8.5% RWAs), equivalent to a 20 basis point reduction in the Bank Group’s CET1 ratio. This increased capital requirement will be accommodated from the existing capital surplus and retained earnings.

The acquisition of Macquarie shares required for the financial year ended 31 March 2015 (FY15) profit share and promotion awards under the Macquarie Group Employee Retained Equity Plan (MEREP) was completed in July 2015. A total of approximately $A383 million of Macquarie shares were purchased on-market at an average purchase price of $A80.68 per share.

First quarter business highlights

Macquarie Asset Management (MAM) had $A477.4 billion in assets under management at 30 June 2015, broadly in line with 31 March 2015, as positive net flows within Macquarie Investment Management (MIM) were offset by foreign exchange and market movements as well as net divestments within Macquarie Infrastructure and Real Assets (MIRA) managed funds. 1Q16 included performance fees of $A208 million, predominantly from Macquarie Infrastructure Company and Macquarie Atlas Roads. During the quarter, MIRA completed six acquisitions and three follow-on investments in five countries, totalling $A1.4 billion of equity under management. MIM was awarded over $A2 billion in new institutional mandates across ten strategies in six countries and Macquarie Specialised Investment Solutions raised over $A900 million for Australian principal protected investments and specialist funds.

Corporate and Asset Finance’s (CAF) asset and loan portfolio increased to $A29.2 billion at 30 June 2015 from $A28.7 billion at 31 March 2015. During the quarter there were portfolio additions of $A1.2 billion in corporate and real estate lending. Strong securitisation activity continued with a further $A0.9 billion of motor vehicle leases and loans securitised during the quarter. In July, CAF settled on 37 of the 90 aircraft committed from AWAS Aviation Capital in FY15.

Banking and Financial Services’ (BFS) retail deposits increased to $A38.0 billion at 30 June 2015. Business lending increased 10 per cent on FY15 to $A5.7 billion and the Australian mortgage portfolio also increased 10 per cent to $A27.0 billion. BFS’ Wrap platform funds under administration remained broadly in line with 31 March 2015 at $A47.4 billion.

Macquarie Securities Group (MSG) benefited from increased volumes and volatility in the market, particularly in Asia where the liberalisation of China’s capital markets and credit easing resulted in significant increases in client activity in the region. Australian ECM activity remained strong and MSG was ranked No.1 for completed ECM deals  in Australia and New Zealand (ANZ) during the quarter. The derivatives and trading business also benefited significantly from favourable market conditions.

Macquarie Capital benefited from the continued strength of global mergers and acquisitions (M&A) and ECM activity during the quarter. 119 deals totalling $A82 billion were completed in 1Q16, up significantly (by value) on both 1Q15 and 4Q15, mainly due to the timing of large advisory transactions. Macquarie Capital maintained its ranking of No.1 for both announced and completed M&A deals6  and No.1 for completed ECM deals  in ANZ, and was awarded Best Domestic Equity House Australia 2015 .

Commodities and Financial Markets (CFM) experienced continued volatility in energy markets over the quarter, which led to increased customer business, primarily in Global Oil and North American Gas. Metals activity remained steady while agriculture experienced increased volatility and client volumes. Client volumes were stable in foreign exchange and interest rate markets, while US credit markets remained mixed due to global geopolitical uncertainty. Macquarie Energy maintained its Platts ranking of No.3 US physical gas marketer in North America.

Westpac To Reduce BT Holding

Westpac today announced the intention to sell part of its shareholding in BT Investment Management (BTIM). DFA comments this is in part a move ahead of the tighter capital requirements which are in train and it is likely we will see other divestments across the industry as the screws are tightened.

The Westpac Group’s holding will reduce from its current 59% of BTIM’s issued capital to between 31% and 40%.

The sell-down will generate a post-tax accounting gain on sale of between $0.6 and $0.7 billion for Westpac. Westpac’s common equity Tier one capital ratio is also estimated to increase by between 10 and 15 basis points. The accounting gain will be treated as a cash earnings adjustment in Westpac’s full year 2015 accounts.

Westpac Group Chief Financial Officer, Peter King, said the transaction delivers benefits to both Westpac and BTIM.

“The sale allows the Group to realise a part of the investment in BTIM, increasing our capital ratios, while still maintaining a significant interest in BTIM.

“The strength and importance of the relationship remains unchanged. Wealth remains a strategically important focus for the Westpac Group and our continued investment in BTIM sees us maintain a stake in asset management which is a key factor in having a strong and diversified wealth business.”

Mr King said the sale is also important for BTIM shareholders.

“The transaction increases the proportion of BTIM’s shares that are readily tradable, improving liquidity and helping facilitate inclusion in key equity indices,” he said.

Westpac currently intends to retain a shareholding between 31% and 40%, with the CEO of BT Financial Group, Brad Cooper, remaining as a Non-Executive Director on the BTIM Board.

Macquarie Lifts FY 2015 Profit 27%

Macquarie Group today announced a net profit after tax attributable to ordinary shareholders of $A1,604 million for the full year ended 31 March 2015 (FY15), up 27 per cent on the full year ended 31 March 2014 (FY14) and above expectations. Profit for the second half of the year (2H15) was $A926 million, up 37 per cent on the first half (1H15). The six months to 31 March 2015 saw Macquarie’s annuity-style businesses (Macquarie Asset Management (MAM), Corporate and Asset Finance (CAF) and Banking and Financial Services (BFS)) continue to perform well with combined net profit contribution1 up four per cent on 1H15 and up 29 per cent on 2H14. Macquarie’s capital markets facing businesses (Macquarie Securities Group (MSG), Macquarie Capital and Commodities and Financial Markets (CFM)) also delivered an improved result with combined net profit contribution1 up significantly on 1H15, and up 24 per cent on 2H14. Macquarie’s annuity-style businesses’ FY15 combined net profit contribution1 increased by $A710 million, or 33 per cent, on FY14. Macquarie’s capital markets facing businesses’ FY15 combined net profit contribution1 increased by $A216 million, or 19 per cent, on FY14.

Net operating income of $A9.3 billion for FY15 was up 14 per cent, while total operating expenses of $A6.8 billion were up 12 per cent on the prior year. Key drivers of the change from the prior year were:

  • A 17 per cent increase in combined net interest and trading income to $A3.8 billion, up from $A3.3 billion in FY14, resulting from loan portfolio growth for both CAF and BFS and improved trading results in CFM and MSG
  • A 24 per cent increase in fee and commission income to $A4.8 billion, up from $A3.9 billion in FY14, primarily driven by higher base and performance fees in MAM, improved levels of advisory fee income in Macquarie Capital and CFM and higher debt capital markets activity
  • An 18 per cent decrease in other operating income and charges to $A0.7 billion, from $A0.9 billion in FY14. Increased gains on business and asset sales, predominately in CAF, were offset by higher impairment charges and collective provisions as well as non-recurrence of FY14 items such as the dividend income and gain on disposal of SYD and OzForex
  • Total operating expenses increased 12 per cent, driven by: an 11 per cent increase in employment expenses resulting primarily from improved Group performance; increased technology costs due to higher development activity to support business growth as well as increased regulatory compliance; increased other operating expenses largely driven by an overall increase in the Group’s operating activity; and the impact of the depreciation of the Australian dollar on offshore expenses.

Staff numbers were 14,085 at 31 March 2015, up from 13,913 at 31 March 2014.

The income tax expense for FY15 was $A899 million, up nine per cent from $A827 million in the prior year. The effective tax rate of 35.9 per cent was down from 39.5 per cent in FY14 driven by the nature and geographic mix of income and tax uncertainties.

Retail deposits increased by 12 per cent to $A37.3 billion at 31 March 2015, with total deposits increasing during the year from $A36.9 billion to $A39.7 billion at 31 March 2015. During FY15, $A21.5 billion of new term funding was raised covering a range of sources, tenors, currencies and product types.

While Macquarie continued to build on the strength of its Australian franchise, its international income accounted for 70 per cent of the Group’s total income for FY15. This reflects the growth of international operations, particularly in the Americas which was the largest contributing region with 36 per cent of total income, as well as the favourable impact of foreign exchange movements.

The effective tax rate for FY15 was 35.9 per cent, down from 39.5 per cent in FY14.

Macquarie’s assets under management (AUM) at 31 March 2015 were $A486.3 billion, up 14 per cent from $A426.9 billion at 31 March 2014 largely due to additional investments and favourable foreign exchange and market movements.

A final ordinary dividend of $A2.00 per share (40 per cent franked), up from the 1H15 ordinary dividend of $A1.30 per share (40 per cent franked) will be paid. The total ordinary dividend payment for the year was $A3.30 per share, up from $A2.60 in the prior year. This represents an annual ordinary dividend payout ratio of 68 per cent. The record date for the final ordinary dividend is 20 May 2015 and the payment date is 2 July 2015.

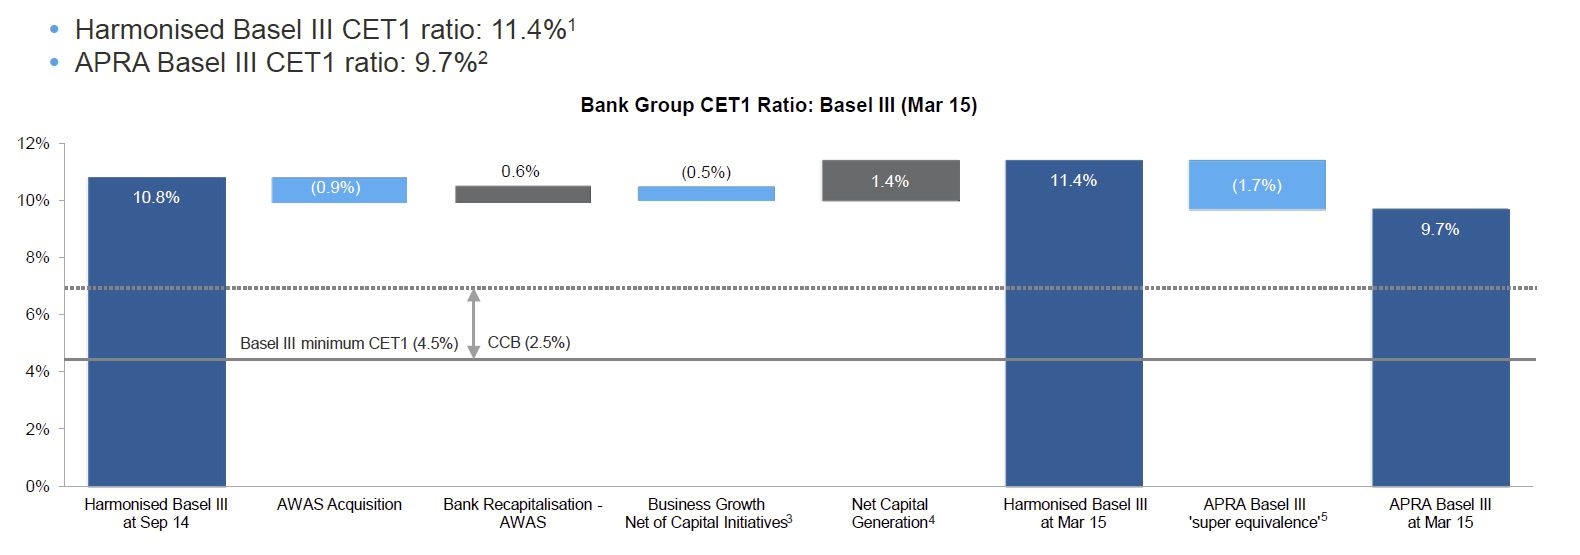
Macquarie Group remains very well capitalised with APRA Basel III Group capital of $A16.1 billion at 31 March 2015, a $A2.7 billion surplus to Macquarie’s minimum regulatory capital requirement from 1 January 20167. The Bank Group APRA Basel III Common Equity Tier 1 capital ratio was 9.7 per cent at 31 March 2015, slightly up on 31 March 2014.

MBL-May-2015-1Macquarie intends to purchase approximately $A390 million of shares on-market to satisfy the requirements of the Macquarie Group Employee Retained Equity Plan (MEREP) for FY15. The buying period for the MEREP will commence on 18 May 2015 and is expected to be completed by 10 July 20159. No discount will apply for the 2H15 Dividend Reinvestment Plan (DRP) and the shares required under the DRP are to be acquired on market.

Outlook

While the impact of future market conditions makes forecasting difficult, it is currently expected that the combined net profit contribution1 from operating groups for the year ending 31 March 2016 (FY16) will be broadly in line with FY15. The FY16 tax rate is currently expected to be broadly in line with 2H15, and down on FY15. Accordingly, the FY16 result for the Group is currently expected to be slightly up on FY15.  The Group’s short term outlook remains subject to a range of challenges including: market conditions; the impact of foreign exchange; the cost of our continued conservative approach to funding and capital; and potential regulatory changes and tax uncertainties.

Regulatory update

In August 2014, APRA issued its final rules for Conglomerates with the implementation timing dependent on the outcomes of the Financial System Inquiry. Macquarie continues to work through the application of these rules with APRA and the Group’s current assessment remains that Macquarie has sufficient capital to meet the minimum APRA capital requirements for Conglomerates. Based on finalised Bank for International Settlements (BIS) leverage ratio requirements released in January 2014, the Bank Group is well in excess of the currently proposed Basel III three per cent minimum, with an estimated 6.0 per cent leverage ratio as at 31 March 2015. The leverage ratio applies to the Bank Group only. APRA published draft standards relating to the leverage ratio in September 2014 and is currently undertaking industry consultation regarding its final form.

Liquidity Coverage Ratio (LCR) requirements, which also only apply to the Bank Group, came into effect on 1 January 2015. As at 31 March 2015, the Bank Group’s LCR exceeded 120 per cent. Macquarie has been compliant with the LCR at all times since the ratio became a minimum requirement, with the average LCR for the first quarter of 2015 also exceeding 120 per cent. APRA has recently indicated its intention to deal with the level of capital held against mortgages, perhaps narrowing the mortgage risk weight differential between internal ratings-based (IRB) and standardised approach banks. While it remains unclear if, and to what extent, the gap will be narrowed, if the current APRA standardised approach were to be used instead of Macquarie’s IRB mortgage risk weights, the expected impact on the Bank Group’s Common Equity Tier 1 capital would be less than $A250 million.

Operating group performance

Macquarie Asset Management delivered a net profit contribution1 of $A1,450 million, up 38 per cent on the prior year. The result was driven by strong performance fee income and growth in annuity base fee income from higher assets and equity under management. AUM increased 14 per cent on the prior year to $A484.0 billion. Macquarie Infrastructure and Real Assets (MIRA) raised $A8.3 billion in new equity commitments during the year, invested equity of $A6.2 billion in portfolio assets across the globe and divested assets of over $A2.5 billion. Macquarie Investment Management (MIM) continued its strong investment performance, launched several new products across the fixed income, equities and alternatives asset classes, reached capacity in a number of strategies and continued to expand its global distribution network. Macquarie Specialised Investment Solutions continued to grow the Macquarie Infrastructure Debt Investment Solutions (MIDIS) business reaching second close on the UK Inflation-linked Infrastructure Debt Fund to bring total third party investor commitments to the MIDIS platform to over $A3.3 billion.

Corporate and Asset Finance delivered a net profit contribution1 of $A1,112 million, up 35 per cent on the prior year, including gains on several asset sales. CAF’s asset and loan portfolio increased 13 per cent during the year to $A28.7 billion. The corporate and real estate lending portfolio increased by 24 per cent to $A11.2 billion. There were $A4.7 billion of portfolio additions, comprising $A3.1 billion in new primary financings and $A1.6 billion of loans acquired in the secondary market. CAF’s asset finance portfolio of $A17.5 billion was up six per cent on the prior year due to the impact of the depreciation of the Australian dollar. The aircraft leasing business signed an agreement to acquire an operating lease portfolio of 90 aircraft valued at approximately $US4.0 billion, with acquisition and delivery to be completed during FY16. Throughout the year CAF also saw the continued expansion in the motor vehicle and equipment finance channels, as well as growth in the energy asset portfolio of smart meters in the UK and solar energy assets in Australia. CAF continued its securitisation activities, with $A4.0 billion of motor vehicle and equipment leases and loans securitised during FY15.

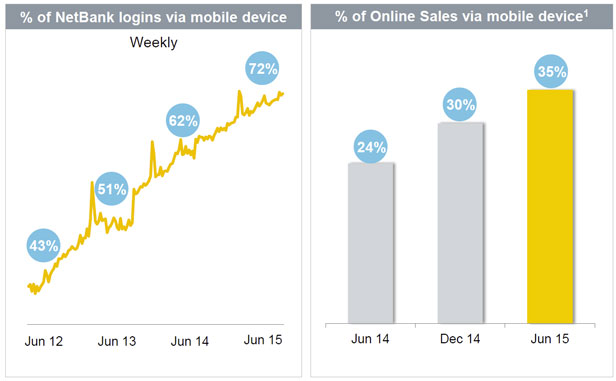
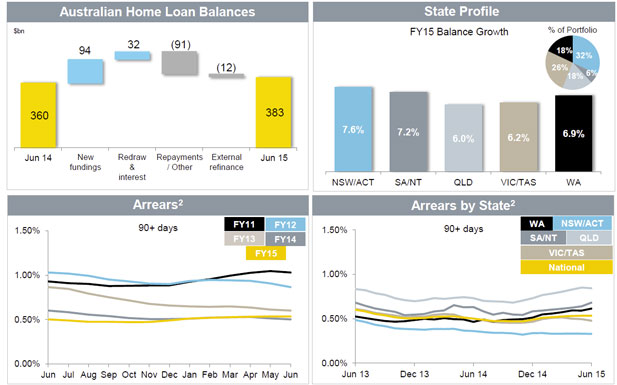
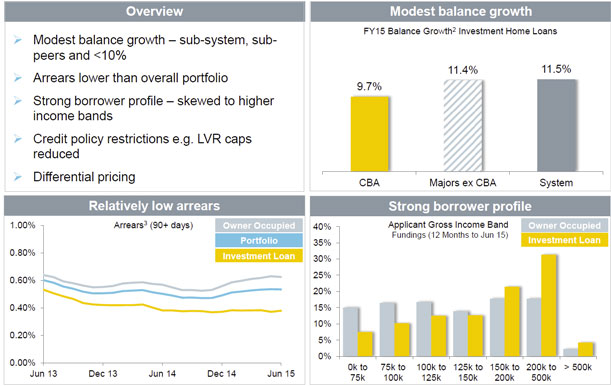
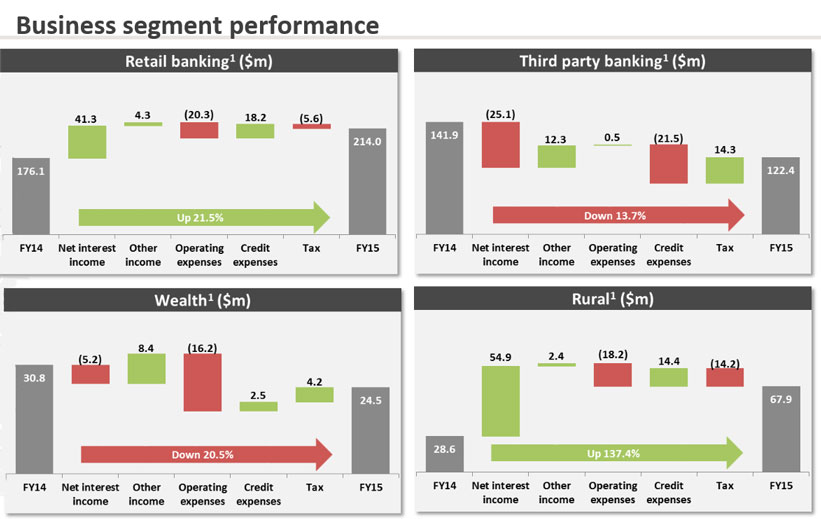
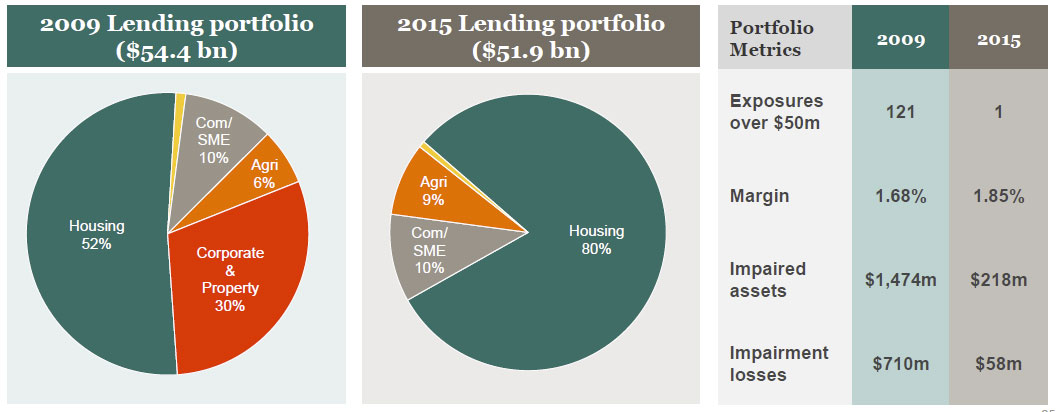
Banking and Financial Services delivered a net profit contribution1 of $A285 million, up 10 per cent on the prior year. BFS’ Australian mortgage portfolio grew by 44 per cent to $A24.5 billion, including $A2.5 billion in residential mortgage portfolios acquired during the year. This portfolio represents 1.7 per cent of the Australian mortgage market. Macquarie platform assets under administration increased by 19 per cent during the year to $A48.0 billion, while Macquarie Life inforce risk premiums increased by 17 per cent to $A223 million. Average business banking deposits increased 19 per cent over the year, with the business banking loan portfolio at $A5.2 billion as at 31 March 2015, up 27 per cent from $A4.1 billion in the prior year. Total retail deposits were up 12 per cent to $A37.3 billion. During the year BFS continued to invest in its technology to improve client experience, support growth and simplify, streamline and centralise its product and transactional functions.

Macquarie Securities Group delivered a net profit contribution1 of $A64 million, down from $A107 million in the prior year. Brokerage income remained relatively flat whilst equity capital markets activity increased on the prior year largely driven by initial public offering (IPO) activity in Australia. Certain markets experienced favourable conditions, which benefited the derivatives and trading divisions, however operating expenses (excluding brokerage, commission and trading-related expenses) were up 11 per cent on the prior year, resulting largely from investment in platforms and processes driven by regulatory compliance requirements, as well as restructuring costs from the exit of Structured Products. Macquarie was ranked No.1 in Australia for IPOs and No.2 for Australian equity and equity related deals in calendar year 2014. MSG continued to build on its expertise as one of the largest derivative warrant issuers in the Asia-Pacific region, holding No.1 market share for listed warrants in Singapore and Malaysia, No.3 in Thailand and No.7 in Hong Kong.

Macquarie Capital delivered a net profit contribution1 of $A430 million, up 54 per cent on the prior year. The business advised on 470 transactions worth $A141 billion and was ranked No.1 for announced and completed merger and acquisitions (M&A) deals in Australia in calendar year 2014. During the year, Macquarie Capital advised Freeport LNG on its landmark $US11.0 billion equity and debt raising to project finance its LNG export facility in Texas; was Joint Lead Manager on the $A5.7 billion IPO of Medibank Private, the largest Australian IPO in calendar year 2014 and the second largest Australian IPO ever; advised Emperador on its acquisition of Whyte & Mackay from United Spirits for £430 million; and was sole Sponsor and exclusive Financial Adviser to IHS Lothian for the project finance facilities of £185 million to the Royal Hospital for Sick Children public private partnership project in Edinburgh.

Commodities and Financial Markets delivered a net profit contribution1 of $A835 million, up 15 per cent on the prior year. The improved result reflected a general improvement in market conditions compared to the prior year. The Energy Markets business was a significant contributor to CFM’s overall result with revenues generated across the global energy platform, particularly in Global Oil and North American Gas. The Metals, Mining and Agriculture business had an overall improved result on the prior year, primarily driven by continued growth in the base metals platform across financing, physical execution and hedging activities, however further provisions for impairment were taken on underperforming resources investments and loans. Volatility and volumes improved in foreign exchange, interest rates and futures markets in the second half. US credit markets were mixed, however debt capital markets volumes and fees increased as M&A activity increased. The securitisation and origination businesses experienced continued growth and increased transaction flows, particularly in the UK and Europe.

NAB 1H 2015 Results – UK Exit, Stage Left – DFA Research Alert

NAB today announced their results for 1H 2015, which completes the updates from the major banks this week. Somewhat similar themes, with volumes up but lending margins down, offset by some deposit repricing and lower provisions. The hand of the regulator can be seen on the Australian home loan business, but significantly NAB outlined an exit path from the UK requiring capital, and other strategic initiatives, and a rights issue. No commentary on the potential demands by higher regulatory capital.

On a statutory basis, net profit attributable to owners of the Company was $3.44 billion, an increase of $584 million or 20.4% compared with March 2014. Cash earnings were $3.32 billion, an increase of $170 million or 5.4% with improved performances across all major businesses. This was in line with expectations. Excluding prior period UK conduct related charges, cash earnings rose 0.3%. Analysis of the results shows a trade off between volume growth and margin.

NAB-May-2015-1Revenue increased 3.1%. Excluding gains on the UK Commercial Real Estate (CRE) loan portfolio sale and SGA asset sales, revenue rose 2.2% benefitting from higher lending balances, the impact of changes in foreign exchange rates, stronger Markets and Treasury income and increased NAB Wealth net income. Group net interest margin (NIM) declined 2 basis points over the year and 1 basis point when compared to the September 2014 half year.

NAB-May-2015-2Expenses were broadly flat but excluding a fine paid in relation to UK conduct and prior period UK conduct related charges rose 4.0%. The increase mainly reflects the impact of changes in foreign exchange rates, investment in the Group’s priority customer segments and higher technology costs, combined with occupancy and Enterprise Bargaining wage increases.

Improved asset quality resulted in a total charge to provide for bad and doubtful debts (B&DDs) of $455 million, down 13.8%. This primarily reflects lower charges in UK Banking and NAB UK CRE. Compared to the September 2014 half year, the B&DD charge rose 30.4% due to releases from the Group economic cycle adjustment and NAB UK CRE overlay of $104 million in the prior period which were not repeated. Group asset quality metrics continued to improve over the period. The ratio of Group 90+ days past due and gross impaired assets to gross loans and acceptances of 0.85% at 31 March 2015 was 34 basis points lower compared to 30 September 2014 and 67 basis points lower compared to
31 March 2014.

The Group’s Basel III Common Equity Tier 1 (CET1) ratio was 8.87% as at 31 March 2015, an increase of 24 basis points from September 2014. As previously announced, the Group’s CET1 target ratio from 1 January 2016 remains between 8.75% – 9.25%, based on current regulatory requirements. The interim dividend is 99 cents per share (cps) fully franked, unchanged from the prior interim dividend, and below market expectations.

For the March 2015 half year the Group has raised approximately $17.3 billion of term wholesale funding. The weighted average term to maturity of the funds raised by the Group for the March 2015 half year was approximately 5.0 years.

The Group’s quarterly average liquidity coverage ratio as at 31 March 2015 was 118%. The ratio of collective provision to credit risk weighted assets was 1.01% at 31 March 2015 compared to 0.83% at 30 September 2014 with the increase over the period reflecting transition to AASB. The ratio of specific provisions to impaired assets was 35.5% at 31 March 2015, which compares to 35.3% at 30 September 2014 and 34.8% at 31 March 2014.

There were two significant strategic announcements in the results.

UK Exit – this was signalled in October 2014 as a result of the strategy to focus on the Australian and New Zealand franchise. Significant work has since been undertaken on various exit options, in particular public market options which offer increased certainty on the ability to transact and timing. While remaining open to a trade sale, NAB intends to pursue a public market option of a demerger of approximately 70-80% of Clydesdale Bank’s holding company National Australia Group Europe Ltd and its subsidiaries (Listco) to NAB shareholders and a sale of the balance by way of IPO (approximately 20-30%) to institutional investors. A demerger accelerates the full exit of the UK business, as opposed to a prolonged multi-staged public market sell-down, and allows an exit to be targeted by the end of this calendar year, subject to market conditions. The consequences for NAB will be a reduction in cash earnings on separation of Listco with shares in Listco to be received by NAB shareholders, whilst  NAB cash ROE should increase on separation; the transaction expected to have a broadly neutral impact on NAB’s capital position excluding the capital support to Listco which will receive capital support of £1.7bn is, from separation, expected to be a full deduction from NAB CET1. Actual losses lower than £1.7bn should result in a capital release for NAB over time. Post separation, future actual conduct cost will be recognised by NAB within discontinued operations outside of cash earnings with no impact on capital (netted against £1.7bn support).  No impact on NAB’s credit ratings expected

NAB Wealth today announced it has received APRA approval for its life insurance arm to enter into a reinsurance arrangement with a major global reinsurer for approximately 21% of its in-force retail advised insurance book. The transaction is expected to release approximately $500 million of CET1 capital (13 basis points) to the NAB Group, and represents approximately 15% of NAB Wealth’s life insurance embedded value. This is expected to result in a reduction in NAB Wealth cash earnings of approximately $25 million per annum.

Also, NAB will be undertaking a 2 for 25 fully underwritten pro rata accelerated renounceable rights issue with retail rights trading (the Entitlement Offer) at an offer price of $28.50, to raise approximately $5.5 billion. Approximately 194 million new NAB ordinary shares are to be issued (approximately 8.0% of issued capital). New shares issued under the Entitlement Offer will rank equally with existing shares from the date of allotment. New shares will not however be entitled to the interim dividend for the half year ended 31 March 2015 of 99 cps because they will not be issued before the dividend record date.

Looking at the segmentals, Australian Banking cash earnings were $2,574 million, an increase of 4.0%, with revenue the key driver. Revenue rose 3.9% reflecting a stronger trading performance, combined with higher volumes of housing and business lending, partly offset by weaker margins. Expenses rose 3.8% driven by additional service roles and front line business bankers, combined with Enterprise Bargaining wage increases and higher technology costs. Cost to income rose by 10 basis points to 40.7%. Asset quality metrics continued to improve and B&DD charges of $366 million fell 2.4%, benefitting from lower business impairment activity partly offset by higher collective provision charges including a $49 million overlay for agriculture and resource sectors. NIM declined 3 basis points to 1.60% as a result of asset competition and lending mix impacts.

NAB-May-2015-5Although NAB experienced above system growth in mortgages, margins on home lending were squeezed 5 basis points.

NAB-May-2015-3Broker volumes grew from 30.2% to 30.9% of loans originated. There was a net 209 increase in brokers across aggregators PLAN, Choice and FAST – currently 3,700 affiliated brokers, and a 31% increase in white label transaction. LVR’s over 80% were circa 20% of transactions, and around 15% of book, with a slight fall above 90%.

NAB-May-2015-6Looking at the loan portfolio mix, 28.8% of loans were for investment property (up from 28.2% in Sept 2014), and 35% of loans were interest only.  The average balance was $276,000. 90 Day past due was 0.48% and impaired loans 0.14%. The loss rate is 0.03%. Home loan impairment is lower through the broker channels than proprietary channels (opposite to what the regulator says, by the way, but consistent with our own modelling).

NAB-May-2015-4Steps are being taken to slow growth in investor mortgage lending to meet APRA’s 10% YoY threshold – currently 13%, and they say they are on track to comply with APRA’s best practice serviceability guidelines by June 2015 – floor rate comfortably above 7.0% and serviceability buffer comfortably above 2.0% (including buffer on existing debt). Interest only lending assessed on a principal and interest basis. This shows the regulator is having an impact and that lending criteria are tightening.

NZ Banking local currency cash earnings rose 4.5% to NZ$418 million with higher revenue given steady growth in lending volumes and improved margins (up 7 basis points, but with a 13 basis fall in lending margin, offset by 10 basis point rise in deposit margin, as well as funding and capital benefits) reflecting lower funding costs and benefits from both higher capital levels and higher earnings on capital. Costs rose 1.8% due mainly to increased personnel expenses, but were broadly flat compared to the September 2014 half year. Cost to income ratio rose 80 basis points to 40.2% B&DD charges were higher over the period with lower collective provision write-backs, but were flat over the six months to 31 March 2015 given the continued benign credit environment.

NAB Wealth cash earnings increased 28.2% to $223 million reflecting improved results from both the investments and insurance businesses, and lower operating expenses. Net income rose 8.0% due to improved insurance claims performance, stable lapses and growth in funds under management (FUM) as a result of strong investment markets, partly offset by lower investment margins related to a change in business mix. Cost to income ratio fell by 7.7% to 67.9%. There was no repeat of the insurance reserve increases seen in prior periods.

UK Banking local currency cash earnings grew 35.6% to £99 million driven by a further material reduction in B&DD charges as the business benefitted from improved economic conditions and loan portfolio shifts. Revenue was slightly weaker despite good growth in home lending volumes with competitive pressures resulting in NIM decline of 11 basis points from lending, points. Costs fell 1.2% (cost to income up 10 basis points to 70.3%) with increased restructuring and marketing spend more than offset by a one-off pension scheme gain in the March 2015 half year and conduct related charges that were incurred only in the March 2014 half year.