
Join us tonight at 20:00 Sydney for a live discussion on our latest research and analysis. You will be able to ask a question live via the YouTube chat. We will also have our post code tool online.
Category: Household Survey
The Australian Real Estate Bubble – Get the Facts
We covered the Australian Macro economic outlook and a deep dive into the Australian property market and look how it can possible be the biggest Real Estate Bubble Australia has ever seen.
Streamed live to YouTube today by
Postcode Analysis: What properties are outperforming the market?
In my latest discussion with Veronica Morgan in the “Elephant In The Room” podcast, we look at household perceptions and financial data across our surveys.

FINAL REMINDER: DFA Live Tonight 8pm Sydney – Latest Household Confidence Update and Live Q&A
Join me tonight at 8pm Sydney for this weeks DFA live stream. We will be updating our latest survey results, looking at the RBA minutes out today, and we will also have our post code database online.
You can ask a question live via the YouTube chat and join the discussion.
Household Financial Stress In 10 Minutes
A replay of a recent presentation I made as part of an online seminar: NGAA Webinar: Financial Stress in Growth Areas – 2 September 2020
More Households Slip Into Financial Stress
The August 2020 data from our surveys continues to tell a sorry tale of more households feeling the pinch, whether they are mortgaged, renting or investing. Within the numbers there was a slid in Victoria in particular reflecting the latest lock down and the rising pressure on business there.
We discussed this at length in our live show yesterday. Here is a link to the HD edition:
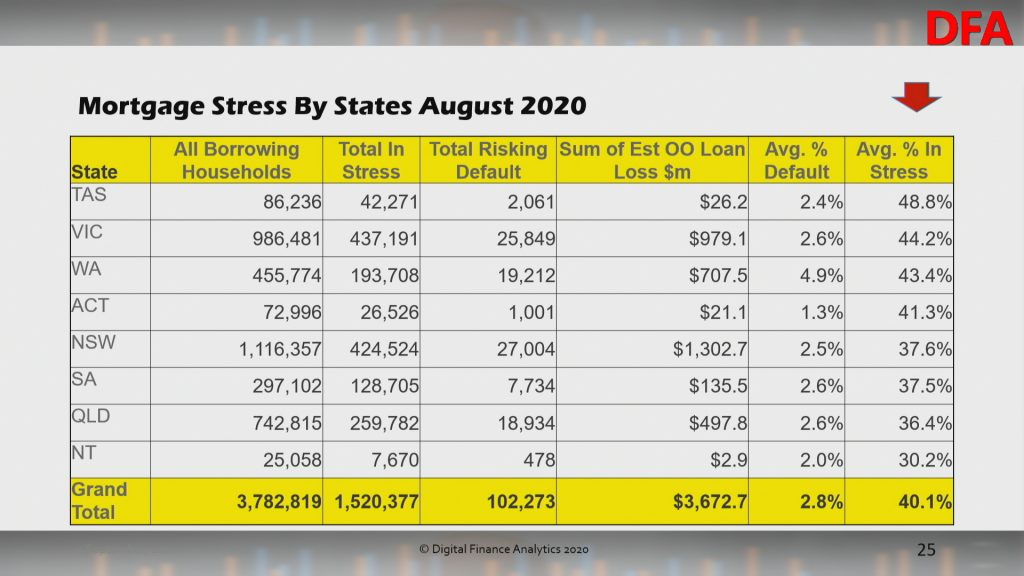
Overall mortgage stress came in at 40.1%:
This equates to 1.52 million households, with TAS, VIC and WA leading the pack.
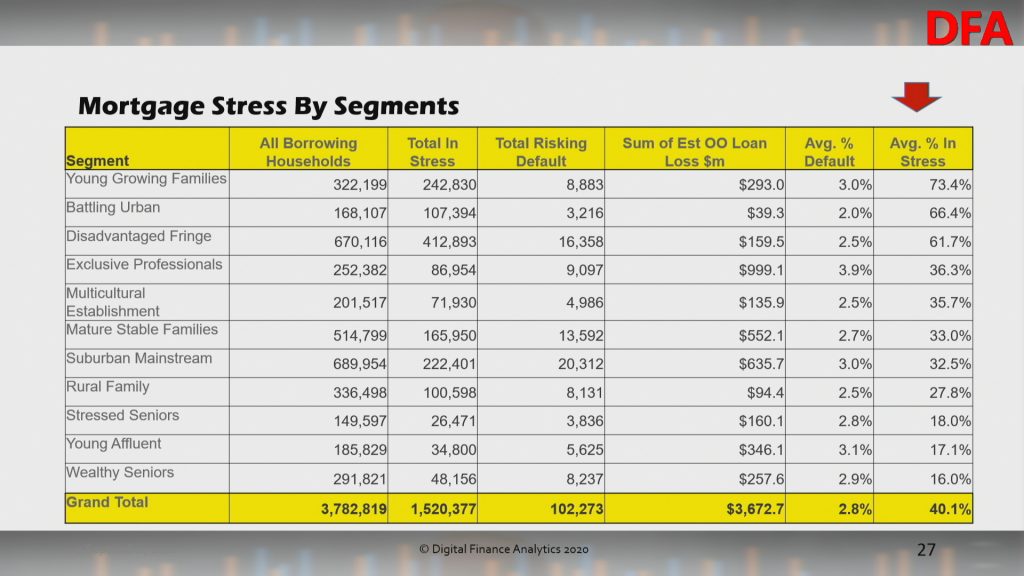
Young Growing Families, and Urban Fringe households are most strongly represented. This includes significant swathes of First Time Buyers.
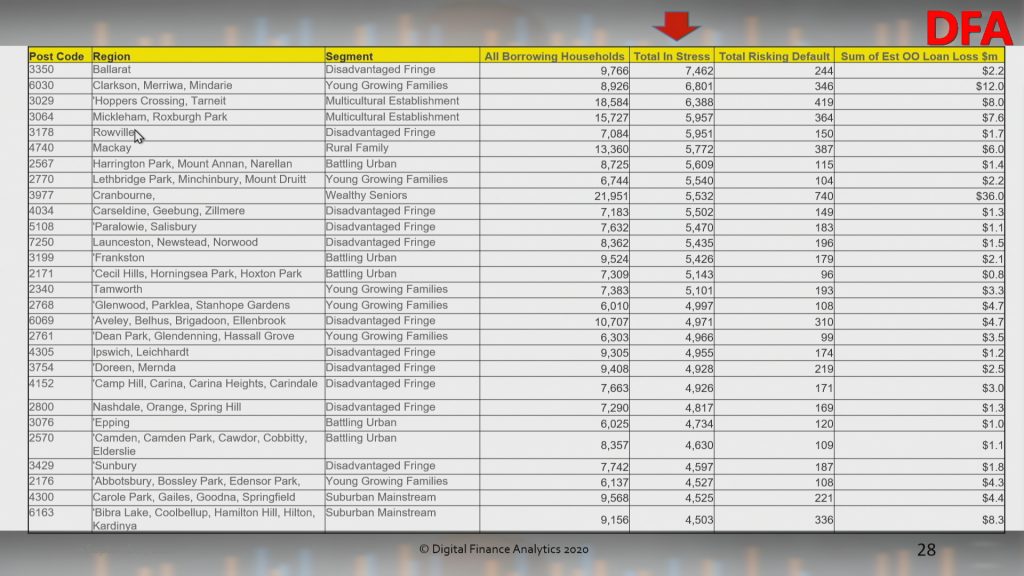
The post codes with the largest counts of stressed households coincide with areas of high recent development, where households have large mortgages, and VIC is over represented thanks to the lock downs.
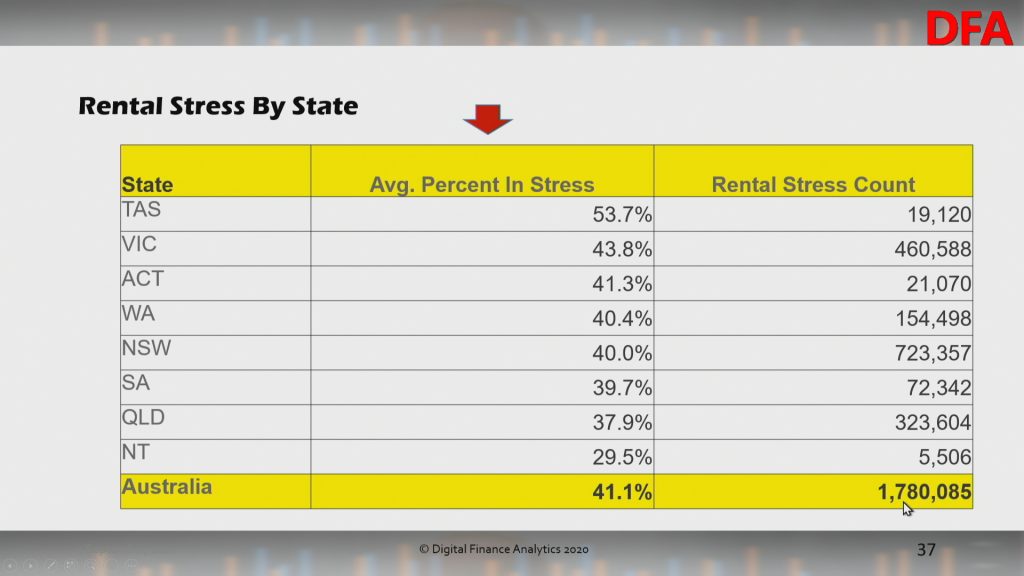
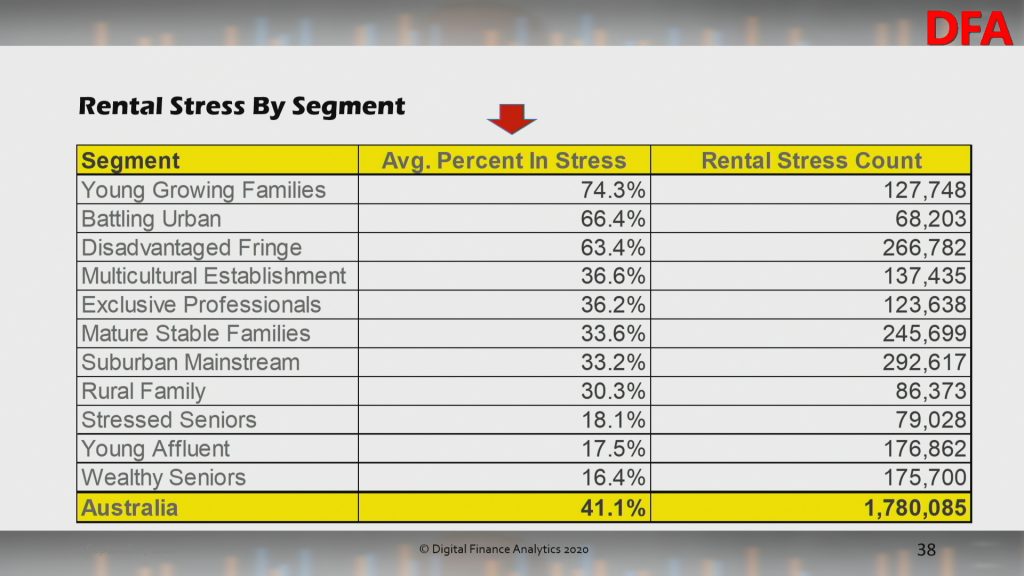
Rental stress remains a significant issue also, with 41.1% of Renters in difficulty, or 1.78 million households.
Within the segments, again Young Growing Families are most impacted.
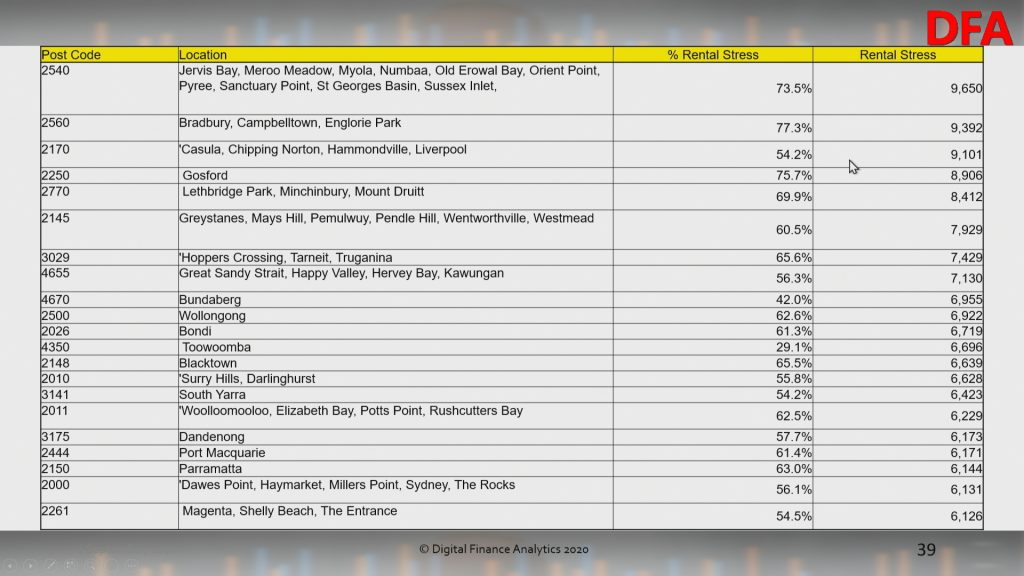
The post codes with the largest counts are revealed here.
Finally, investors remain in crunch territory, with 25.4%, or 826,000 under water, or trying to sell as rentals slide, and property values ease.
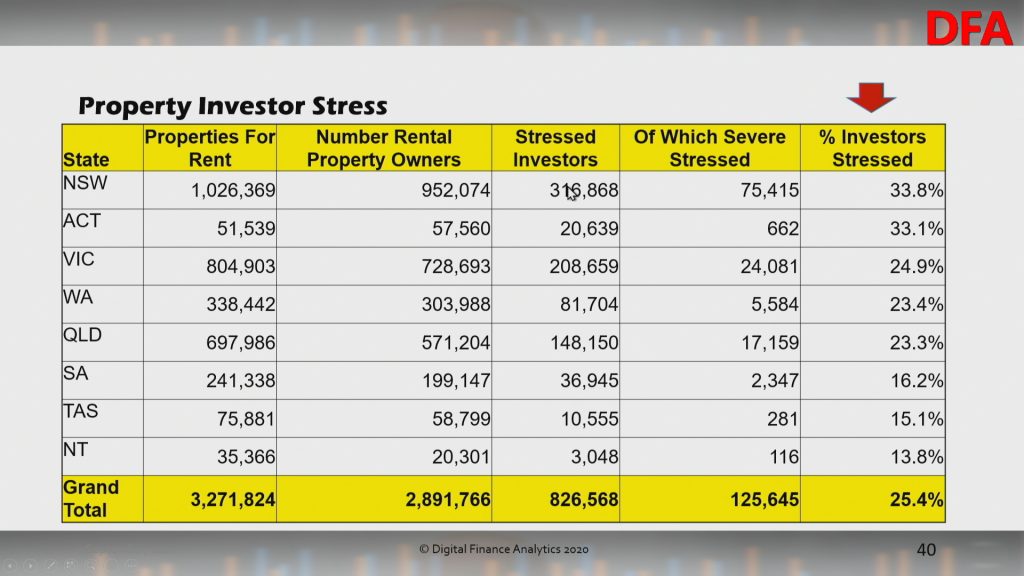
More affluent households are most impacted.
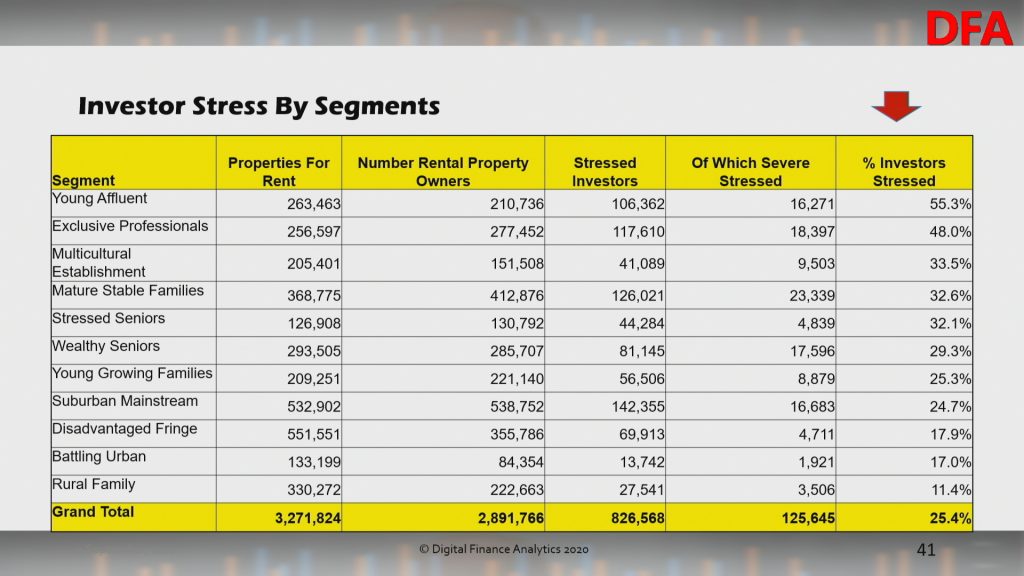
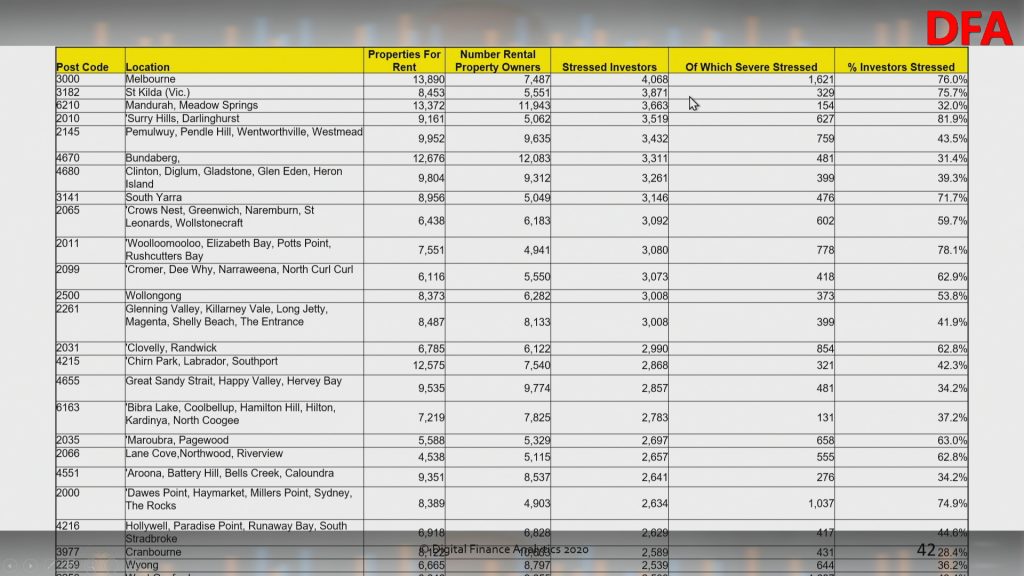
Once again Melbourne 3000 contains the latest number of stressed property investors (their investment portfolios can be anywhere, this is where they reside).
We will publish some stress mapping later, but clearly the fiscal cliff, which is now leglislated, will push more over the edge. Expect higher default levels over the next few month, more forced sales and less household consumption.
Stressing About Financial Stress
We discuss the concept of financial stress and illustrate this with an extract from our household surveys, ahead of the latest results which we will discuss on Tuesday. https://youtu.be/8gO_29PUDw8
National Debt Helpline: https://ndh.org.au/
https://mozo.com.au/family-finances/where-to-find-free-financial-counselling-services-in-australia
Mortgage Stress Eases A Little In May
The latest DFA household survey results for May 2020, from our rolling 52,000 survey reveals a slight fall in households in mortgage stress, from over 38% last month to 37.5%. This still means 1.4 million households are experiencing cash flow issues, despise the Government support programmes and Bank repayment holidays. The full pack is available for download.
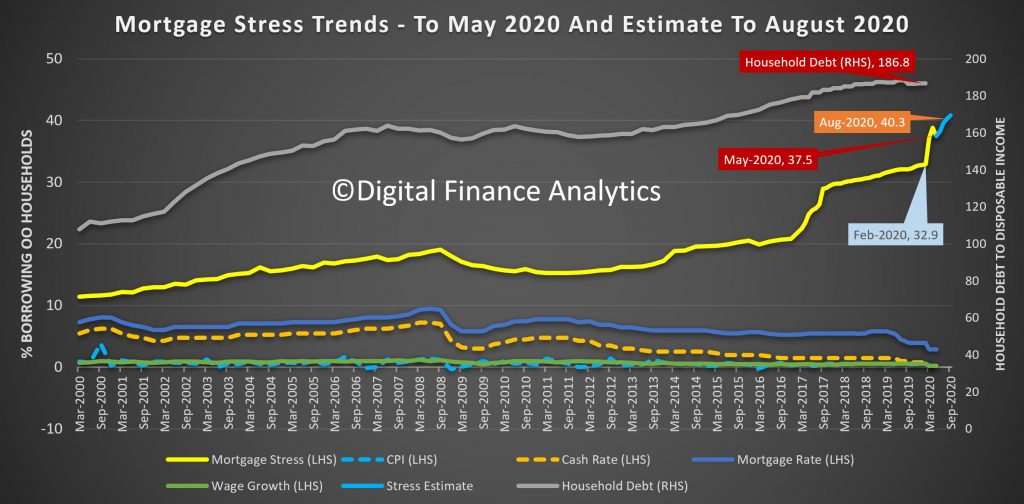
Before COVID, the rate was up to 32.9%, thanks to rising costs and flat incomes, and the rate would have been significantly higher without JobSeeker, JobKeeper and Bank repayment holidays. Ahead, of the September “cliff” when the supports are removed we are projecting a further rise to 40.3%, though if the supports are tapered, this might be lower in reality.
To assess mortgage stress we do not use a set percentage of income going on mortgage repayments, rather we look at total cash flow – money in and money out. If households are under water they are deemed to be in stress. More than 10% under water, then severe stress. Of course they may have assets like deposits, or put more on credit cards, but generally households under pressure spend less, hunker down, and some, 2-3 years later end up selling or even defaulting. Stress indicators are an early warning sign of potential issues ahead.
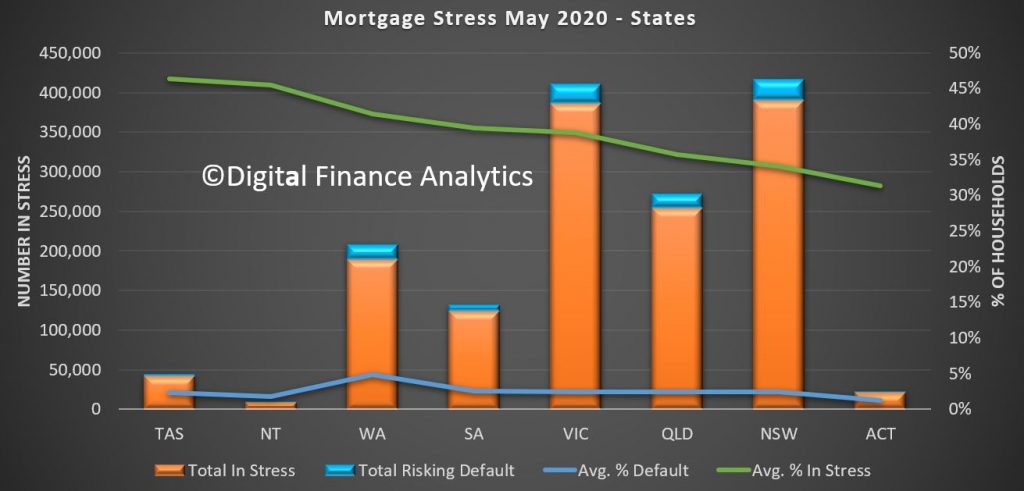
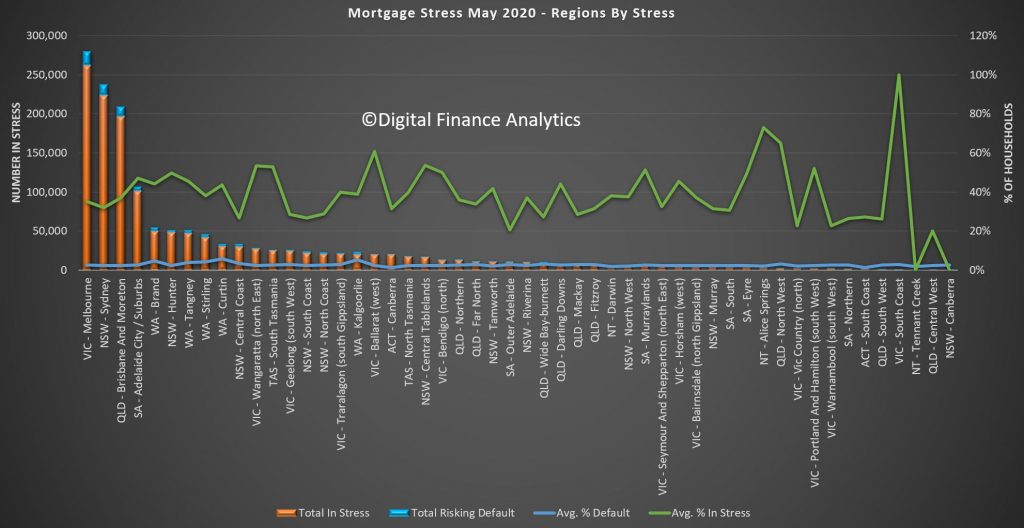
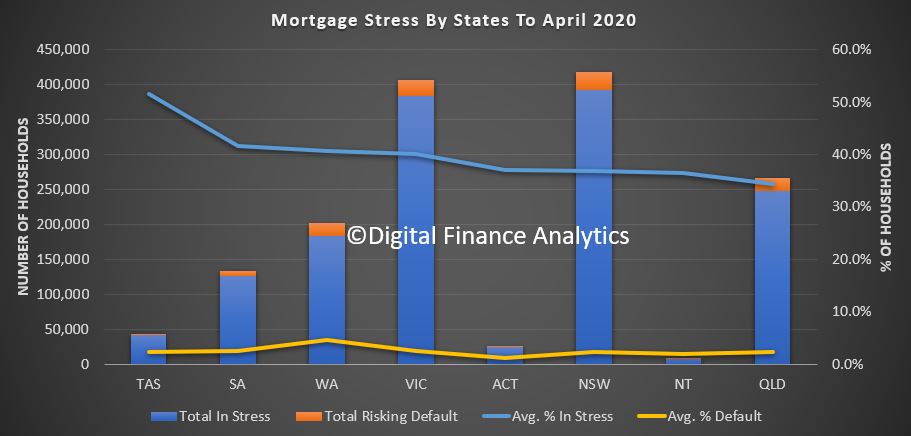
Across the states, Tasmania has highest proportion of households in stress (a function of lower incomes,recently rising home prices and mortgages and a stalled tourist sector in the state). The largest counts are found in NSW and VIC, whereas the highest default projection rates are found in WA.
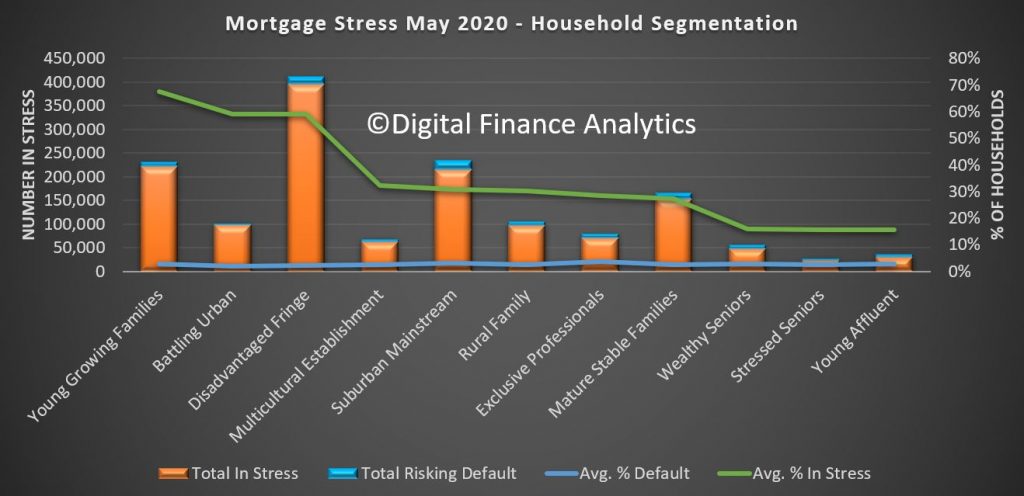
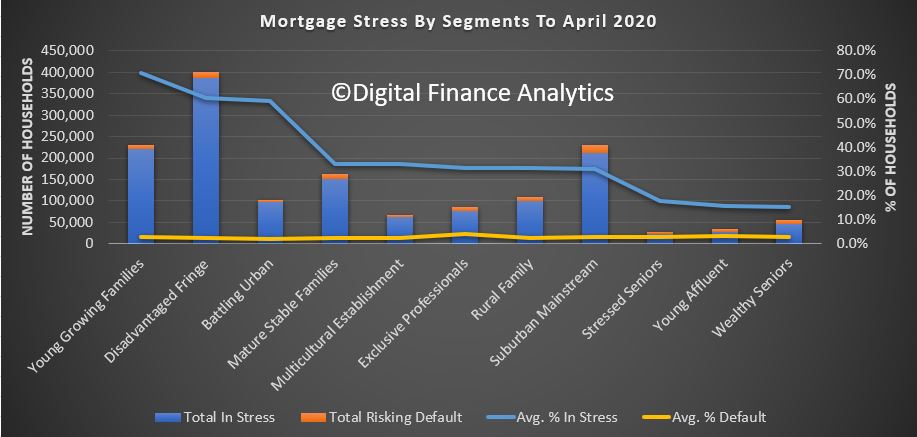
Across our segments, young growing families, including first time buyers, are the most stressed. However we also see a rise in “affluent stress”
Stress exists across the regions, this is not just a major City story. In fact some of the most stressed areas include regional Victoria and New South Wales. The percentages of households in stress do vary.
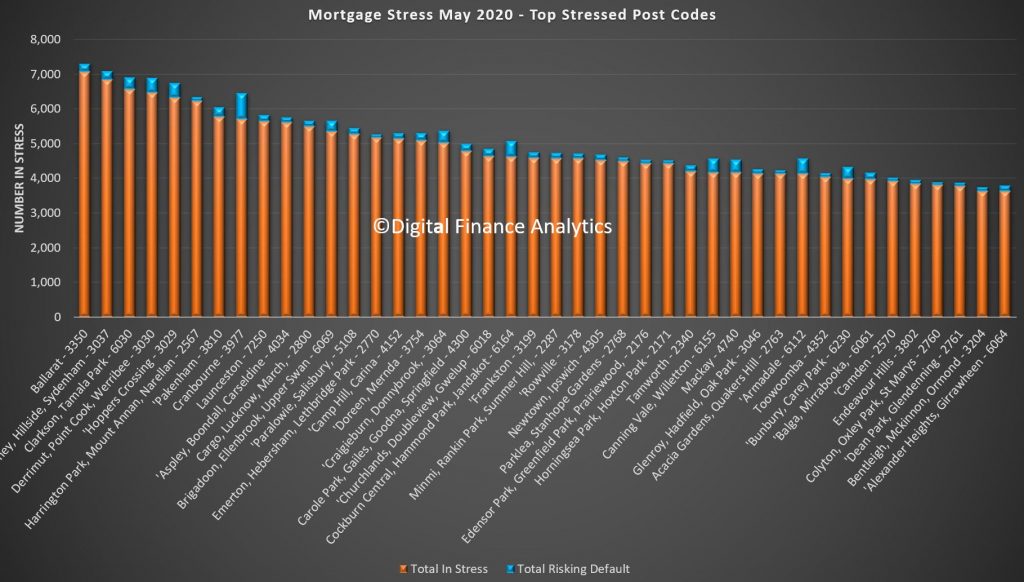
Nationally the most stressed post codes include Ballarat 3350, Hillside and Sydneham 3037, 6030 which includes Clarkson and Tamala Park, and 3030 Werribee and Point Cook. Many of these areas include large swathes of relatively newly built property on small urban estates. Cranbourne 3977 carries the largest number of households risking default.
You can look at the detail behind our analysis. Click on the image to load or save the PDF file. You will need to have Acrobat installed.
You can also watch our live show where we discuss mortgage stress and report on a range of individual households.
Finally, I discussed our research with Nucleus Wealth in their Podcast Series:
DFA Property Market Presentation May 2020
This was my contribution to today’s live event which included Harry Dent and Robert Kiyosaki. I discuss my latest survey results and property and finance scenarios.
Mortgage Stress Up Again In April
The latest DFA mortgage stress data, derived from our rolling household surveys reveals than an additional 100,000 households joined the cash-flow stressed in April, bringing the percentage of households to more than 38%, which equates to more than 1.4 million.
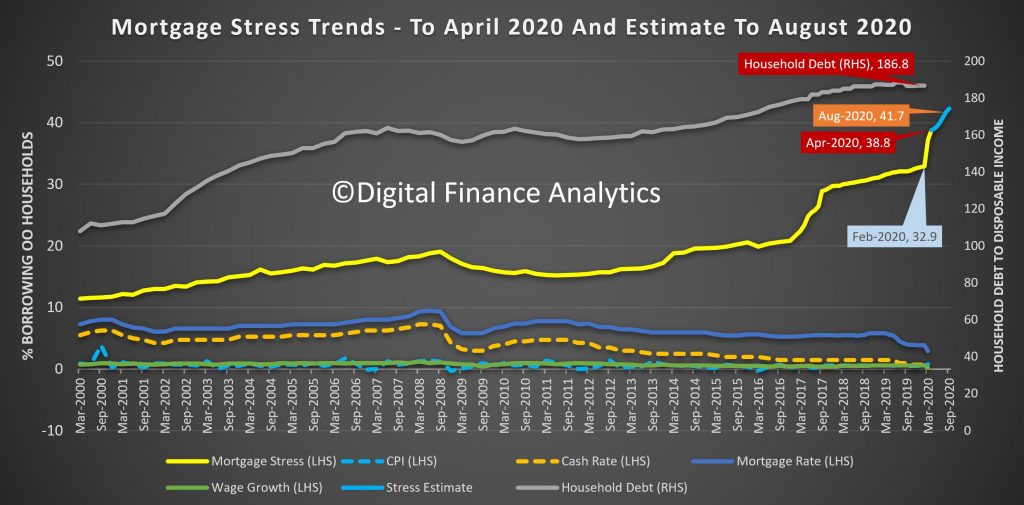
The trajectory is still set to reach more than 41% by August. Our estimates take account of the enhanced JobSeeker, JobKeeper and Bank mortgage repayment holidays. Given the ABS reported around 650-700,000 employed people have lost work since mid-March, we expected these increases to track close to our estimates.
A reminder, we define mortgage stress in cash flow terms, rather than a set proportion of income. One other factor in play is that many households relied on multiple incomes and the loss of just one is sufficient often to push people into stress. Defaults are likely to follow, but not immediately, as people draw on savings, put more on credit, or simple hunker down for a time.
Across our segments, young growing families, at more than 70%, are at risk, follower by those battling on the urban fringe. But we continue to see a growth in more affluent households also being hit.
Across the states, Tasmania contains the highest levels of mortgage stress, thanks to the over-reliance on tourism and recent price rises relative to income. Some lenders have become more cautious here, with many investors unable to secure a mortgage repayment holiday.
Across the regions we see pockets rising in regional areas, as well as the main urban centres. Mortgage stress is not just a big-city disease.
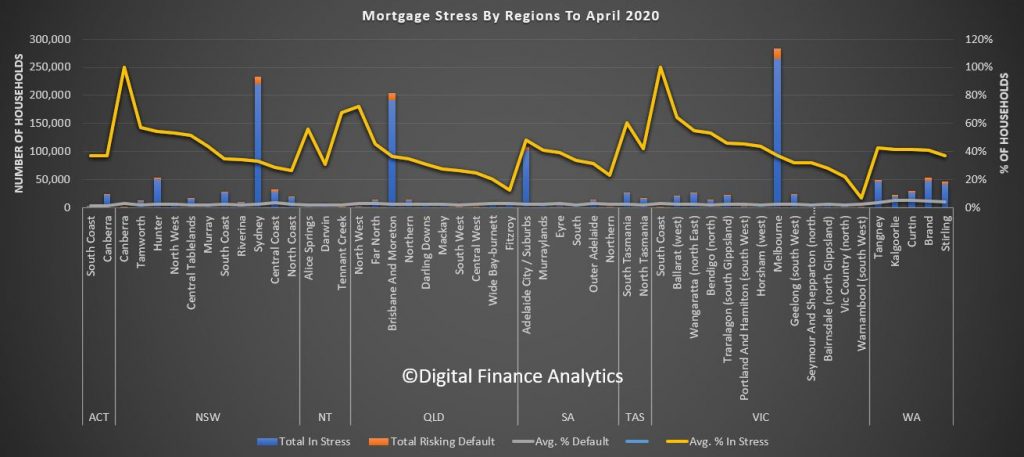
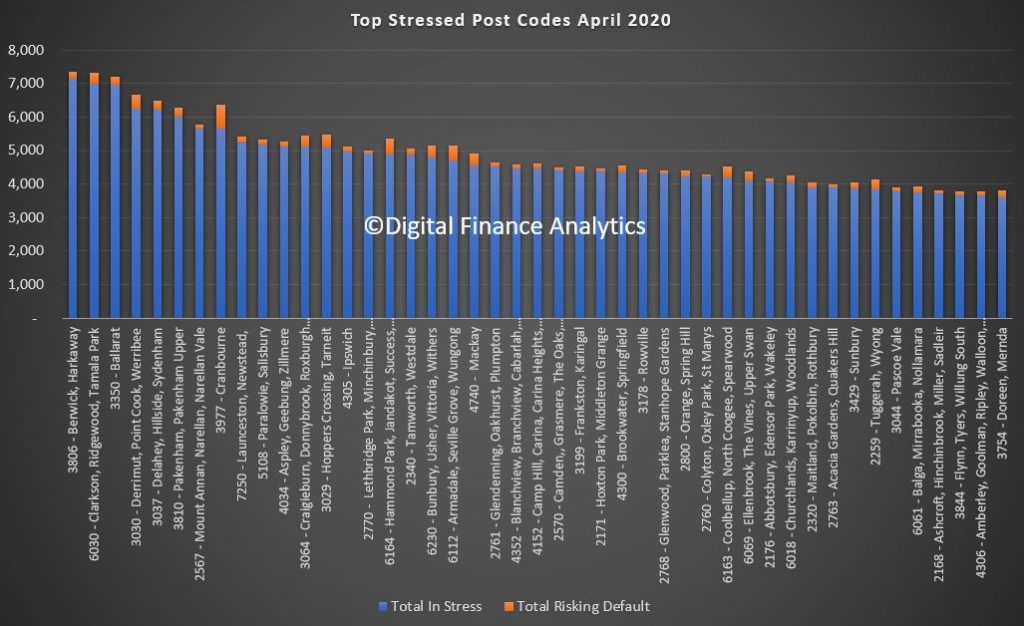
By postcode, Melbourne post code 3806, Berwick and Harkaway now leads the way with more than 7,000 households in the district under pressure. VIC figures strongly with the top 5, with 3350 Ballarat, 3030 Werribee and 3037 Sydenham all impacted. Second though behind 3806 is WA code 6030 which includes Clarkson and Tamala Park. Most of these areas are high growth development corridors, where prices and incomes are above average. Within these areas there are also a sizable number of property investors.
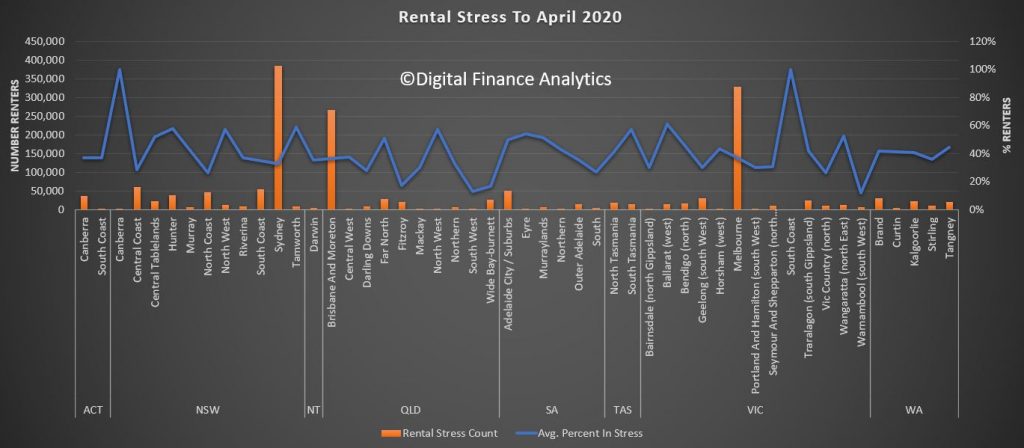
Finally, there are 1.7 million households in rental stress – defined again in cash flow terms. This equates to nearly 40% of all renting households. The regional variations are again quite stark with stress peaking in Canberra and the South Coast (where bush fire damage remains).
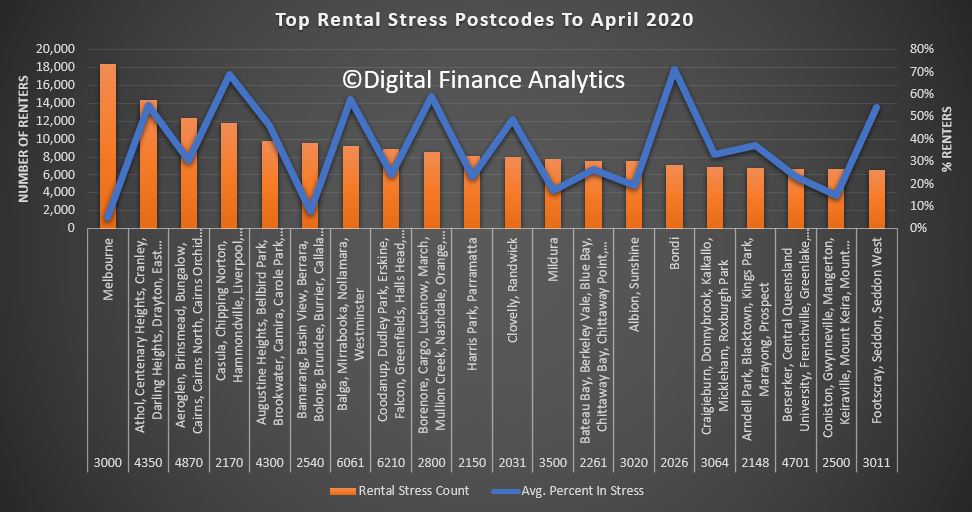
Melbourne post code 3000 recorded the highest count of rental stress, thanks to large numbers of high-rise units being built there, the loss of student and AirB&B clients and simple oversupply. But post codes in Queensland and NSW are also badly hit.
Given the trajectory of the economic downturn, we expect stress to continue to build. The most significant question is the impact of the “cliff” in September where mortgage repayments and rental default freezes, at the same time when Government support schemes all are expected to terminate. Given that the June unemployment figure will likely to 10% (the true figure much higher) and according to the RBA unemployment will remain elevated through 2021, there is little prospect of the trends reversing anytime soon, even at current low interest rates.
Individual households will need to consider cutting their losses in these circumstances and as a result we expect the supply of rental property will rise, and a hike in property to list will follow later.
This has the hallmark of a long slow” U” not a “V” shaped recovery.