Crunch Time In Australian Banking – The Property Imperative Weekly – 04 Nov 2017

Its crunch time in Australian banking, as property momentum slows, households feel the pinch and mortgage risks rise. Welcome to the Property Imperative Weekly to 4th November 2017.

Watch the video or read the transcript.

We start this week’s review by looking at interest rates. The Bank of England lifted their cash rate by 25 basis points, the first hike since July 2007. The move  highlights how shrinking output gaps and tighter labour markets are pushing central banks towards interest rate normalisation. The FED kept US rates on hold at their November meeting, but signalled its intent to lift rates further, and Trump’s nomination for the FED Chair, Jay Powell to replace Yelland will probably not change this.  The US economy is certainly outpacing Australia’s at the moment. Rates are indeed on the rise and policy makers are of the view that if there is the need to lift rates, the tightening should be gradual as to not destabilize the economy. The question is though whether this will neutralise the impact, or simply prolong the pain as we adjust to more normal rates.  The boom brought about by the banks’ policy of extending credit must necessarily end sooner or later. RBA please note!

Turning to this week’s Australian economic data, Retail turnover was flat in September according to the Australian Bureau of Statistics. More evidence that many households are under financial pressure. In trend terms, there were falls in WA, NT and ACT. NSW had a 0.1% rise compared to last month. On the other hand, Dwelling approvals were stronger than expected, up 1.8 per cent in September 2017, in trend terms, the eighth rise in a row. Approvals for private sector houses rose 0.7 per cent.

The latest credit data from the RBA showed housing lending grew the most, with overall lending for housing up 0.5% in September or 6.6% for the year, which is higher than the 6.4% the previous year. Looking at the adjusted RBA percentage changes we see that over the 12 months’ investor lending is still stronger than owner occupied lending, though both showed a slowing growth trend. They said $59 billion of loans have been switched from investment to owner occupied loans over the period of July 2015 to September 2017, of which $1.4 billion occurred in September 2017. So more noise in the numbers!

Unusually, personal credit rose slightly in the month though down 1.0 % in the past year.  Lending to business rose just 0.1% to 4.3% for the year, which is down from 4.8% the previous year. Business investment (or the lack of it), is a real problem. As John Fraser, Secretary to the Treasury said the bottom line is as the mining investment boom ended, Australia has struggled with weak investment in the non-mining sectors, weighing on the labour market, productivity and ultimately economic growth.

And data from APRA showed that the banks are still doubling down on mortgages, in September. Owner occupied loan portfolios grew 0.48% to $1.03 trillion, after last month’s fall thanks to the CBA loan re-classifications. Investment lending grew just a little to $550 billion, and comprise 34.8% of all loans. Overall the loan books grew by 0.3% in the month. We saw some significant variations in portfolio flows, with CBA, Suncorp, Macquarie and Members Equity bank all reducing their investment loan balances, either from reclassification or refinanced away. The majors focussed on owner occupied lending – which explains all the attractor rates for new business. Westpac continues to drive investor loans hard. Comparing the RBA and APRA figures, it does appear the non-banks are lifting their share of business, as the banks are forced to lift their lending standards. But they are still fighting hard to gain market share, which is not surprising seeing it is the only game in town!

Corelogic’s October property price trends showed that Sydney’s deflating house prices have dragged the property market down across the entire country, the most conclusive sign yet that the boom is over. October is traditionally a bumper month for property sales but average house prices across Australia’s capital cities posted no growth at all. Sydney house prices fell by 0.5 per cent, bringing quarterly losses to 0.6 per cent. Prices in Canberra and Darwin also fell (by 0.1 per cent and 1.6 per cent respectively), while Adelaide and Perth each posted zero growth. Of the capital cities, only Melbourne, Brisbane and Hobart saw property prices increase, at 0.5 per cent, 0.2 per cent and 0.9 per cent respectively. The Australian Property boom is “Officially Over”, despite stronger auction clearance results this past week, which underscored the gap between the momentum in Sydney and Melbourne. Total listings and clearance rates were significantly higher down south.

The HIA reported a further decline in New Home Sales. The results are contained in the latest edition of the HIA New Home Sales Report. During September 2017, new detached house sales fell by 4.5 with a reduction of 16.7 per cent on the multi-unit side of the market.

Lender Mortgage Insurer, Genworth a bellwether for the broader mortgage industry, reported their Q3 performance. While the volume of new business written was down 9.8% on 3Q16, the gross written premium was only down 3.9%. Underlying NPAT was down 14.5% to $40.5 million. The total portfolio of delinquencies rose 4.4% to 7,146, and the loss rate overall was 3 basis points. The regional variations are stark, the performance in Queensland and Western Australia remains challenging and delinquencies are elevated they said. WA was 0.88%, up 19 basis points and QLD was 0.72% up 5 basis points.  According to the Australian Financial Security Authority, insolvencies are also rising in WA and QLD, which is mirroring the rise in mortgage delinquency.

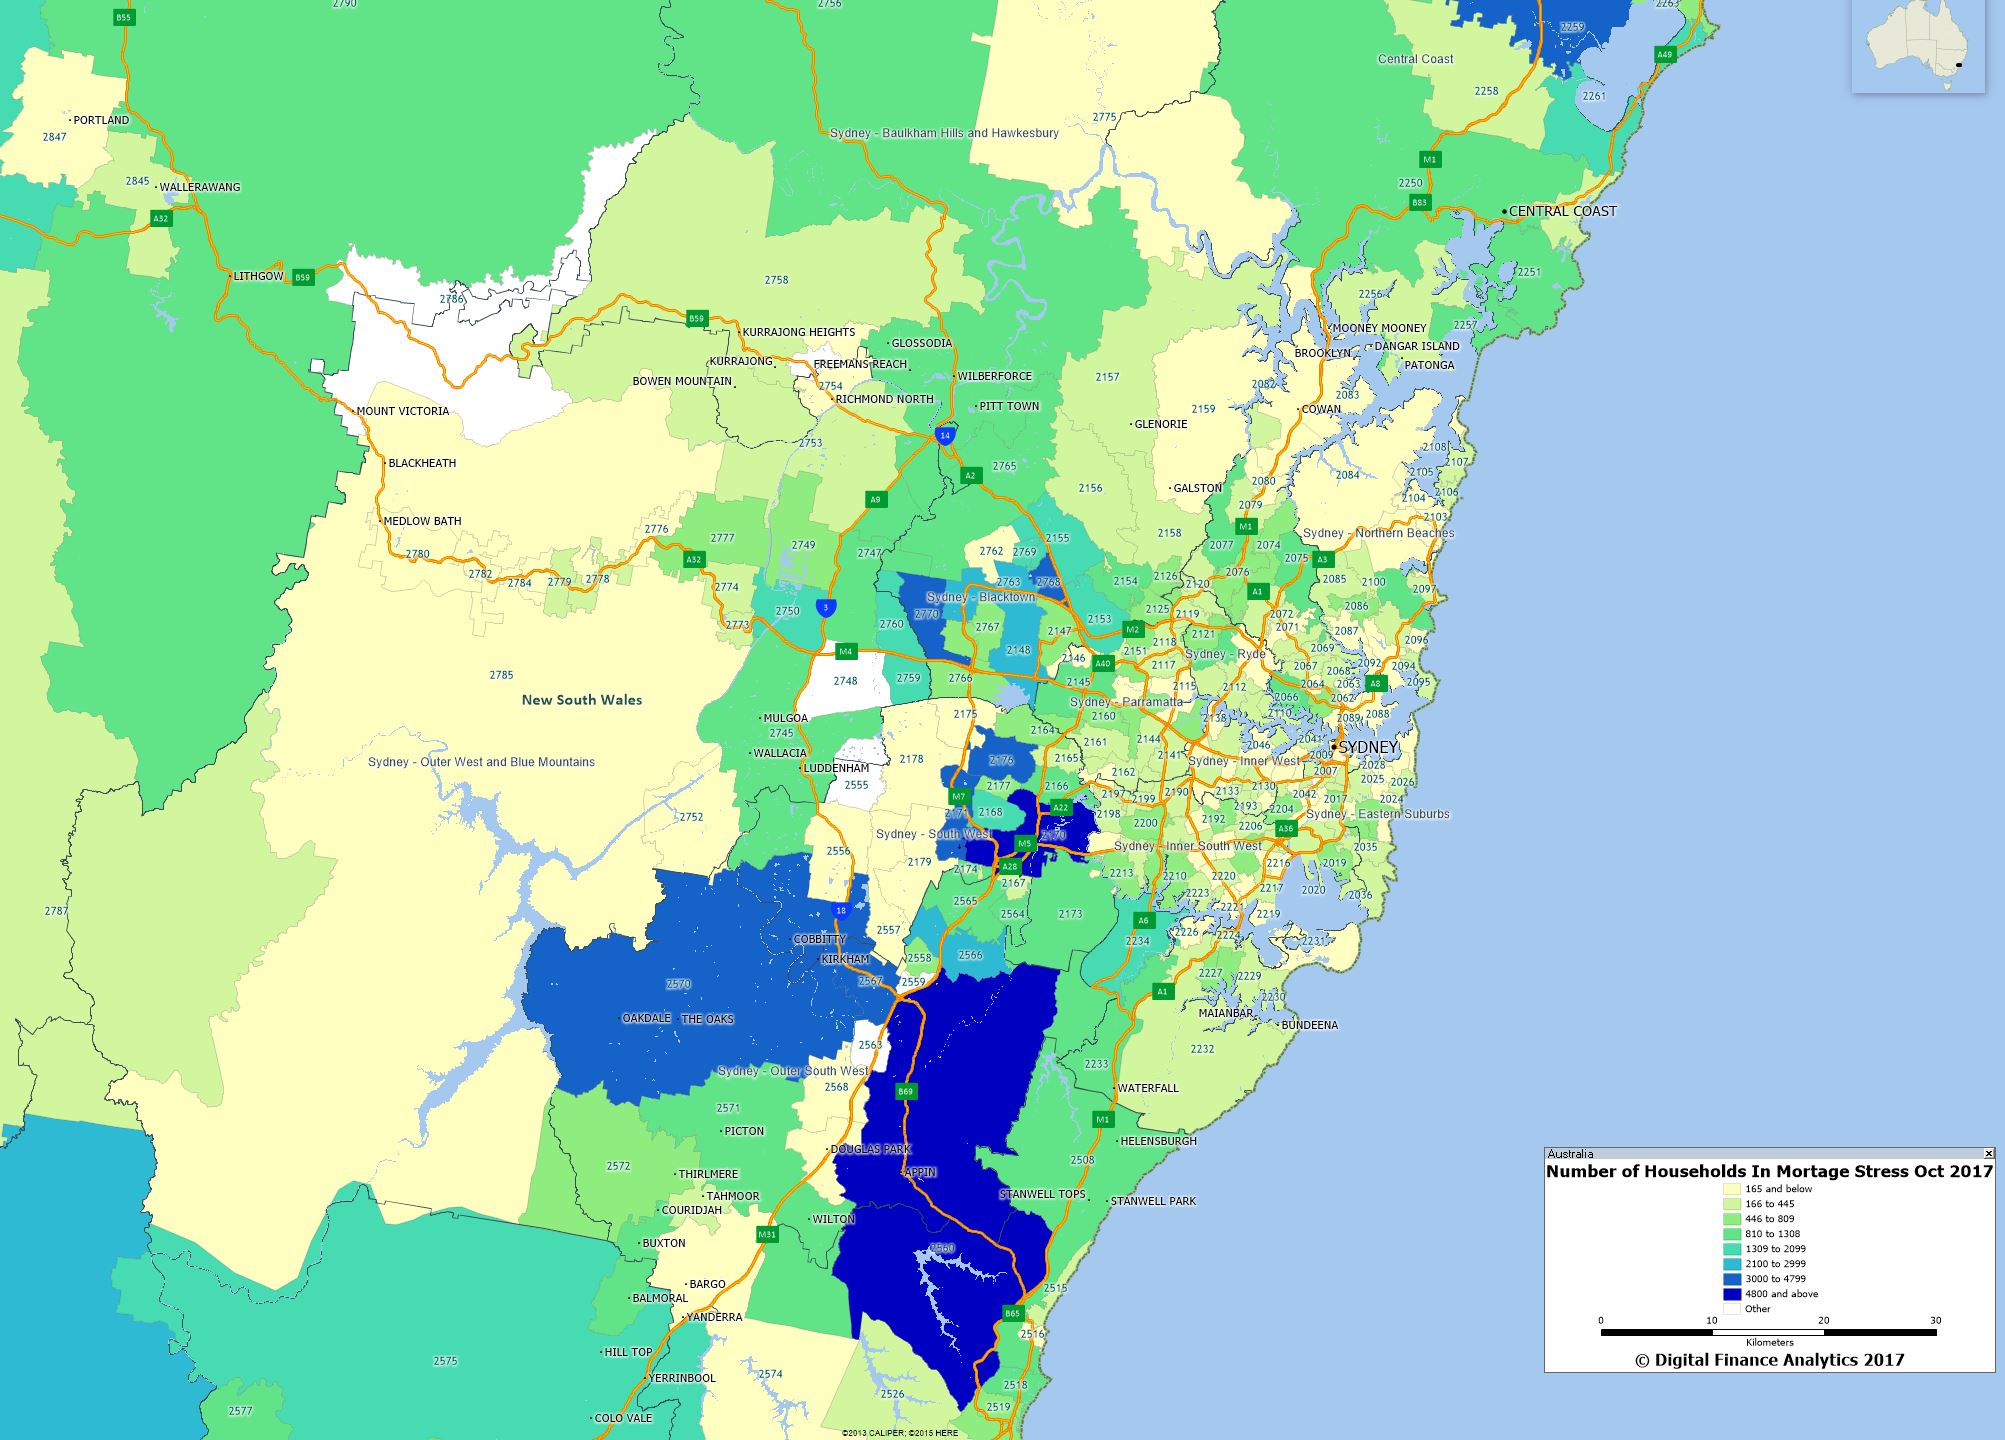
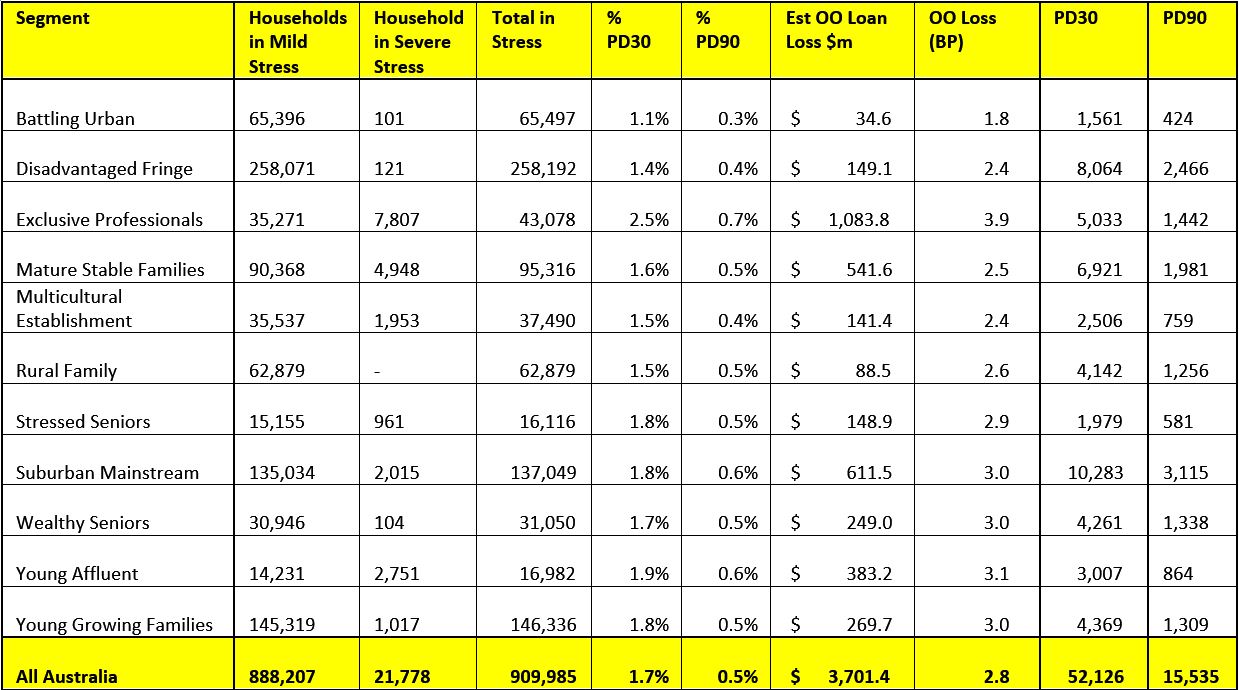
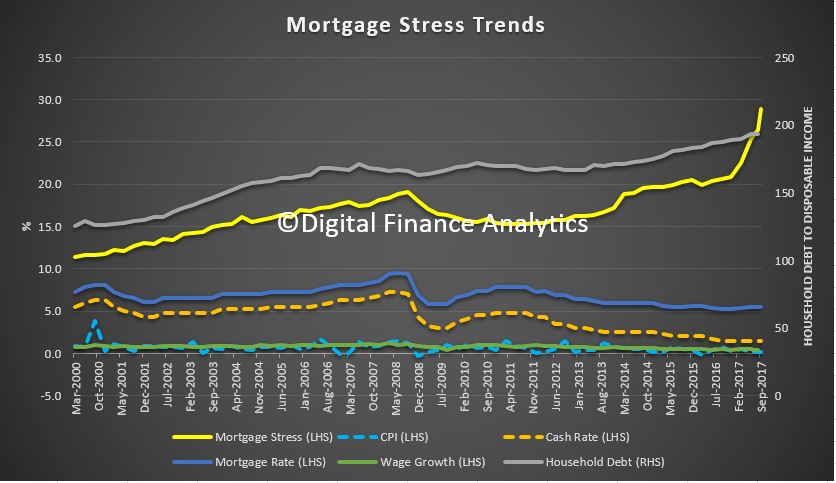
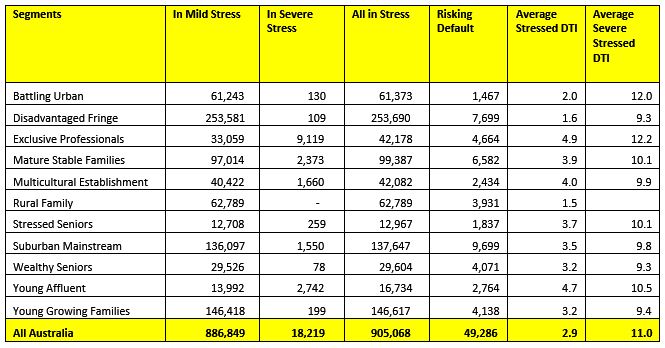
We released our October 2017 Mortgage Stress and Default Analysis. Across Australia, more than 910,000 households are estimated to be now in mortgage stress up 5,000 from last month. This equates to 29.2% of households. More than 21,000 of these are in severe stress, up by 3,000. We see continued default pressure building in Western Australia, as well as among more affluent household, beyond the traditional mortgage belts across the country. We estimate that more than 52,000 households risk 30-day default in the next 12 months, up 3,000 from last month. We expect bank portfolio losses to be around 2.8 basis points ahead, though with WA losses rising to 4.9 basis points.

Risks in the system continue to rise, and while recent strengthening of lending standards will help protect new borrowers, there are many households currently holding loans which would not now be approved. As continued pressure from low wage growth and rising costs bites, those with larger mortgages are having more difficulty balancing the family budget. These stressed households are less likely to spend at the shops, which will act as a further drag anchor on future growth, one reason why retail spending is muted.

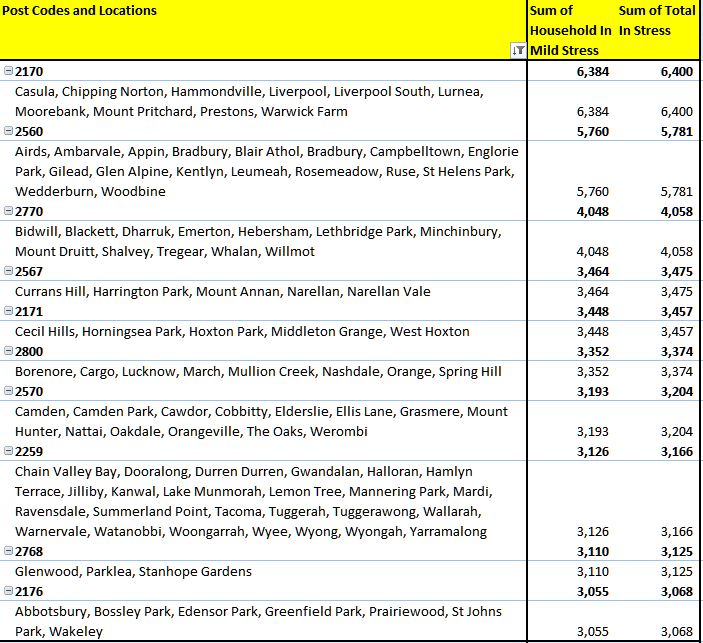
The post code with the highest count of stressed households, and up from fourth place last month is NSW post code 2170, the area around Liverpool, Warwick Farm and Chipping Norton, which is around 27 kilometers west of Sydney. There are 6,380 households in mortgage stress here. The average home price is $803,000 compared with $385,000 in 2010. There are around 27,000 families in the area, with an average age of 34. The average income is $5,950. 36% have a mortgage and the average repayment is about $2,000 each month.

Mortgage stress is still strongly associated with fast growing suburbs, where households have bought property relatively recently, often on the urban fringe. The ranges of incomes and property prices vary, but strikingly it is not necessarily those on the lowest incomes who are most stretched. The leverage effect of larger mortgages has a significant impact.

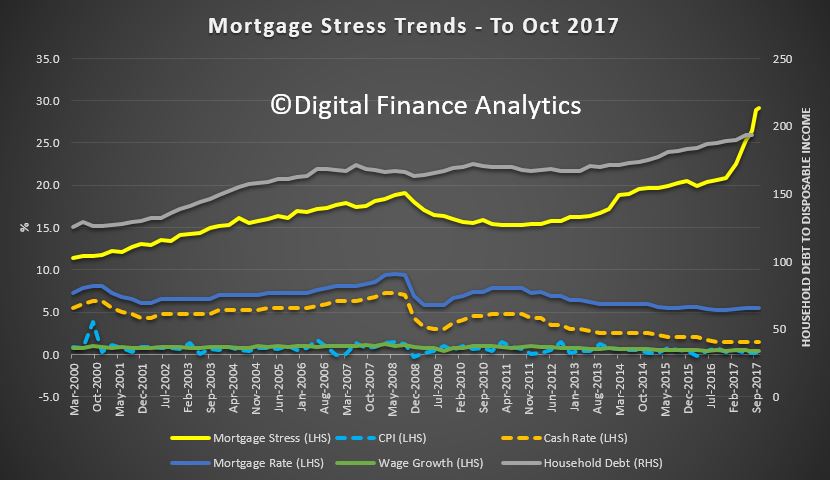
The latest Household Debt Trends from the ABS also showed first, more households are in debt today, compared with 2005-6, and second more households have debts at more than three times their income. Those on lower incomes have borrowed harder, with 50% in the bottom income range borrowing, compared with 44.6% in 2003-4.

Many banks are cutting their mortgage rates to try to attract new borrowers, desperate to write business in a slowing market, because mortgage lending remains the only growth engine in town. We saw announcements from ANZ, and Virgin Money, the Bank of Queensland-owned lender who cut rates by up to 21 basis points and also lifted the maximum LVR to 80%.  On the other hand, mirroring other lenders, Westpac is the latest to bring in a number of responsible lending changes affecting how brokers enter in requirements and objectives (R&O) questions for clients. In a note to brokers the bank said: “This will ensure that the correct R&O are captured accurately for all applications submitted and resubmitted and there is a central location that incorporates all the R&O information that has been discussed between yourself and the client with documented evidence of any loan changes,”.

More evidence of the impact of regulation on the mortgage sector came when Bengido and Adelaide Bank’s CEO provided a brief trading update as part of the FY17 AGM. There are some interesting comments on the FY18 outlook. First they have been forced to “slam on the breaks” on mortgage lending to ensure they comply with APRA’s limits on interest only loans and investor loans. As a result, their balance sheet will not grow as fast as previously expected. On the other hand, this should help them maintain their net interest margins, their previous results had shown a steady improvement and strong exit margin.  They are forecasting 2.34%.

NAB reported their FY17 results and cash earnings were up 2.5% to $6,642 million, which was below expectations. NAB now has its main footprint in Australia, (and New Zealand). Of the $565 billion in loans, 84% of gross loans are in Australia, and 13% in New Zealand. 58% of the business is mortgages, and 10.9% of gross loans, or $62bn are commercial real estate loans, mainly in Australia. So you can see how reliant NAB is on the property sector. NIM improved a bit, although the long term trend is down. Wealth performance was soft, and expenses were higher than expected, but lending, both mortgages and to businesses, supported the results.  They made a provision for potential risks in the retail and the mortgage portfolio, with a BDD charge of 15 basis points but new at risk assets were down significantly this last half. The key risk, or opportunity, depending on your point of view, is the property sector. Currently portfolio losses are low at 2 basis points but WA past 90-day mortgages were up. If property prices start to fall away seriously, new mortgage flows taper down, or households get into more difficulty (especially if rates rise), NAB will find it hard to sustain its current levels of business performance. Ahead, they flagged considerable investment in driving digital, and major cost savings later into FY20 with a net reduction of 4,000 staff.

It is worth saying that back in the year 2000, NAB’s net interest margin was 2.88% compared with 1.85% today, which is lower than ANZ’s 1.99% recently reported. This should be compared with US banks who are achieving 3.21% on average according to Moody’s. It shows that considerable reform of banks in Australia are required. The biggest expense by far is the people they employ. The future of banking is digital! As the mortgage lending tide recedes, the underlying business models of Australian banks are firmly exposed. They have to find a different economic model for their business. Just pulling back to Australia and New Zealand and flogging more mortgages will not solve their problem.

And that’s the Property Imperative Weekly to the 4th November 2017. If you found this useful, as always, do leave a comment below, subscribe to receive future updates, and check back next week for our latest weekly digest

Mapping The Mortgage Stressed Households In Greater Sydney

Following our October 2017 Mortgage Stress update, here is a map of the count of households in mortgage stress in Greater Sydney, using our Core Market Model.

Here is a list of the top 10 most stressed post codes in the region, by the number of households in stress.

We will post similar maps and lists across the other states shortly.

October Mortgage Stress Higher Again – See The Top 10 Post Codes

Digital Finance Analytics has released the October 2017 Mortgage Stress and Default Analysis update. Across Australia, more than 910,000 households are estimated to be now in mortgage stress (last month 905,000) and more than 21,000 of these in severe stress, up by 3,000 from last month. This equates to 29.2% of households. We see continued default pressure building in Western Australia, as well as among more affluent household, beyond the traditional mortgage belts across the country.

We estimate that more than 52,000 households risk 30-day default in the next 12 months, up 3,000 from last month. We expect bank portfolio losses to be around 2.8 basis points ahead, though with losses in WA rising to 4.9 basis points.

Watch the video to see our countdown of the top-10 postcodes across the country this month.

Risks in the system continue to rise, and while recent strengthening of lending standards will help protect new borrowers, there are many households currently holding loans which would not now be approved. As continued pressure from low wage growth and rising costs bites, those with larger mortgages are having more difficulty balancing the family budget. These stressed households are less likely to spend at the shops, which will act as a further drag anchor on future growth, one reason why retail spending is muted. The number of households impacted are economically significant, especially as household debt continues to climb to new record levels. Mortgage lending is still growing at three times income. This is not sustainable.

Our analysis uses the DFA core market model which combines information from our 52,000 household surveys, public data from the RBA, ABS and APRA; and private data from lenders and aggregators. The data is current to end October 2017. We analyse household cash flow based on real incomes, outgoings and mortgage repayments, rather than using an arbitrary 30% of income.

Households are defined as “stressed” when net income (or cash flow) does not cover ongoing costs. Households in mild stress have little leeway in their cash flows, whereas those in severe stress are unable to meet repayments from current income. In both cases, households manage this deficit by cutting back on spending, putting more on credit cards and seeking to refinance, restructure or sell their home.  Those in severe stress are more likely to be seeking hardship assistance and are often forced to sell.

The forces which are lifting mortgage stress levels remain largely the same. In cash flow terms, we see households having to cope with rising living costs whilst real incomes continue to fall and underemployment remains high. Households have larger mortgages, thanks to the strong rise in home prices, especially in the main eastern state centres. While mortgage rates remain quite low for owner occupied borrowers, those with interest only loans or investment loans have seen significant rises.  We expect some upward pressure on real mortgage rates in the next year as international funding pressures mount, a potential for local rate rises and margin pressure on the banks. We revised our expectation of potential interest rate rises, given the stronger data on the global economy.

Probability of default extends our mortgage stress analysis by overlaying economic indicators such as employment, future wage growth and cpi changes.  We have also extended our Core Market Model to examine the potential of 90-Day defaults (PD90) and portfolio risk of loss in basis point and value terms. Losses (in terms of value) are likely to be higher among more affluent households.

Regional analysis shows that NSW has 242,399 households in stress (238,703 last month), VIC 250,259 (243,752 last month), QLD 162,726 (168,051 last month) and WA 121,393 (124,754 last month). The probability of default rose, with around 9,800 in WA, around 9,600 in QLD, 13,000 in VIC and 13,900 in NSW.

You can request our media release. Note this will NOT automatically send you our research updates, for that register here.

[contact-form to=’mnorth@digitalfinanceanalytics.com’ subject=’Request The Oct 2017 Stress Release’][contact-field label=’Name’ type=’name’ required=’1’/][contact-field label=’Email’ type=’email’ required=’1’/][contact-field label=’Email Me The Oct 2017 Media Release’ type=’radio’ required=’1′ options=’Yes Please’/][contact-field label=”Comment If You Like” type=”textarea”/][/contact-form]

Note that the detailed results from our surveys and analysis are made available to our paying clients.

Pulling In Two Directions – The Property Imperative Weekly 21 Oct 2017

The latest economic and finance data appears to be pulling in two directions, so we discuss the trends.

Welcome to the Property Imperative Weekly to 21st October 2017. Watch the video, or read the transcript!

In this week’s review of the latest finance and property news, we start with data from the Australian Institute of Health and Welfare in their newly released report Australian Welfare 2017. This is a distillation of data from various public sources, rather than offering new research.

In the housing chapter, they reinforce the well-known fact that home ownership is falling in Australia, while rates have been rising in a number of other comparable countries. Contributing to this trend overseas, at least in part, they say, are changes in the characteristics of households (including population ageing, household structure, and income and education) and policy influences, such as mortgage market innovations (including the relaxation of deposit constraints, increasing home ownership rates among lower income households, and tax reliefs on mortgage debt financing). In Australia, the steepest decline in home ownership rates across the 25 years to 2013–14 has been for people aged 25–34. This is typically the age at which first transitions into home ownership are made. But, fewer and fewer people in this age group are entering home ownership, with a 21 percentage point decline to just 39% in 2013–14 (compared with 60% in 1988–89). Home ownership rates for people aged 35–44 also fell, but not so much (12 percentage points).

Also, the proportion of home owners without a mortgage has continued to fall, while the proportion of renters has increased. Now more home owners have a mortgage, compared with those who own their property outright. Another fact is the startling gap between the rise in home prices, relative to disposable incomes, creating a barrier to home ownership for many. This gap has been fuelled by rapid house price growth (up 250% since the 1990’s), after the financial system was deregulated, with the total value of Australian housing estimated to be more than $6.5 trillion. Of course, the impact of higher house prices has been partially offset by lower mortgage interest rates, increased credit availability and changes in financial agency practices. These favourable lending conditions and low interest rates have encouraged buyers into the market, despite the growth in house prices themselves. This could all got wrong should mortgage rates rise.

The final piece of data shows that households are getting a mortgage later in life, and holding it longer, often well into retirement. In 2013, 71% of people born between 1957 and 1966 (mainly baby boomers), were financing a mortgage when aged 45–54. This trend is of particular concern as these households’ approach retirement without their home and asset base being paid off. For people looking to retire in the next 10 years, 45% of 55–64-year-olds in 2013 were still servicing a mortgage, compared with just 26% in 1982.

As the recent Citi report emphasises, and using our Core Market Data, the large level of debt outstanding by borrowers aged in their 50s and 60s means many investors will need to sell property to discharge their debts, especially those holding interest only loans. Given that the average age of wealthy seniors is 63 and the average IO debt is $236,400, Citi expressed concern that this cohort will not have enough time to repay the principal “without a significant hit to household cash flows”.

We still think the mortgage underwriting standards are too lose in Australia, as regulators try to balance slowing the market, but not killing the goose which is laying the golden economic egg.  So we found the Canadian regulators intervention in their mortgage market this week significant. There the index of house prices to disposable income has increased 25%, from 2000,  raising the prospect that real estate overvaluation is driving up overall household debt and overextending borrowers. So they tightened serviceability requirements and imposed loan to value limits on lenders.

Good news on housing affordability this week from the HIA, at least for some. Their Housing Affordability index for Australia improved by 0.5 per cent in the September 2017 quarter but still remains 4.4 per cent below the level recorded a year ago. It also showed that while some owner occupied borrowers had seen their mortgage rates drop, many property investors, has seen their rates rise. Sydney remains the least affordable market they say.

Our friends at Mozo wrote a blog post for us on the impact of the APRA changes to mortgage rates, which underscored the movements by type of loan.

More good news from the ABS. The monthly trend unemployment rate decreased by 0.2 per cent over the past year to 5.5 per cent in September, the lowest rate seen since March 2013. The participation rate remained steady at 65.2 per cent, within that male participation rate was 70.8 per cent, while the female participation rate reached a record high of 59.9 per cent. Over the past year, the states with the strongest annual growth in employment were Queensland (4.1 per cent), Tasmania (3.9 per cent), Victoria (3.1 per cent) and Western Australia (2.9 per cent). However, the underemployment trend rate still does not look that flash, especially in TAS, SA and WA, and we have a very high unemployment rate among younger workers as well as a rise in more casual, part-time work. All of this translates to lower wages.

The latest data from S&P showed a small decline in mortgage defaults in August. S&P said arrears decreased in all states and territories except the Australian Capital Territory (ACT) over the month, with noticeable improvements in Australia’s mining states and territories. The Northern Territory recorded the largest improvement, with arrears declining to 1.63% from 1.98% a month earlier. In Western Australia, arrears fell to 2.22% in August from a historic high of 2.38% in July. They still warned of potential risks in the system, especially from higher LVR IO loans written before 2015. And of course, this is looking a selection of securitised loans which may not be typical, and in any case, in most places home price rises mean struggling borrowers should have the capacity to sell and repay the bank. That would change if prices started to fall seriously.

Talking of risks, there were interesting comments from ASIC this week, suggesting that whilst brokers may be having appropriate conversations with their interest only mortgage customers, there was evidence of poor record keeping. This follows the regulator’s announcement they would commence a loan file review, to ensure that consumers are not paying for more expensive products that are unsuitable. Without good documentation brokers and lenders leave themselves open to the charge of making unsuitable loans, which can have significant consequences.

Another indicator of potential risks in the system is the rise in the number of households seeking short term loans from pay day lenders and other providers. Our surveys show that more than 1.4 million of the 9.5 million households in Australia are looking for finance (and it is rising fast as cash flows are stressed). Not all will successfully obtain a loan. We think more than $1 billion in loans are out there, and our research shows that such short term loans really do not solve household financial issues. However, when people are desperate, they will tend to grasp at any straw in the wind, regardless of cost or consequences. We also find these households are within certain household segments, who tend to be less affluent, and less well educated.

The RBA minutes, release this week, did not tell us much more, but contained this morsel. “Members noted that housing loans as a share of banks’ domestic credit had increased markedly over the preceding two decades. APRA intended to publish a discussion paper later in 2017 addressing the concentration of banks’ exposures to housing.  Members also noted that APRA had intensified its focus on Australian banks strengthening their risk culture”.  We can barely contain our excitement at the prospect! A discussion paper later in the year!

CoreLogic’s latest auction clearance results showed there is still demand for property, with a preliminary clearance rate of 70.6 per cent, and increase from last week when the final clearance rate slipped to 64.4 per cent, the lowest clearance rate since January 2016.

Finally, we released our latest flagship report – The Property Imperative, Volume 9. This is available free on request from our web site and is a distillation of our research into the finance and property market, using data from our household surveys and other public data. Whilst we provide these weekly updates via our blog, twice a year we publish a full report. Volume 9 offers, in one place, a unique summary of the finance and property markets, from a household perspective, over more than 70 pages.

What really struck us as we wrote the report was the amount of change in the property and finance sector, with significant regulatory tightening, changes in mortgage pricing and a rotation in mortgage lending. But the underlying facts of high prices, mortgage stress and rising risks in the system appear unchanged. The number of reports highlighting the risks have risen substantially.

Standing back, sure the data is pulling to two directions, with employment higher, auction clearance rates firm and affordability for some manageable. But the bigger picture contains a number of risks, stemming from the divergence of incomes and home prices, the lose lending standards over the past few years, and the risks from the more recent tightening of the rules, at a time when interest rates are more likely to rise than fall. Without a significant rise in incomes in real terms – and we cannot see where this will come from – the risks to growth and financial stability are still not fully understood.

And that’s the Property Imperative to 21st October 2017. Follow this link to request the Volume 9 Property Imperative Report.

The Distribution of Multiple Investment Properties

We had a number of questions following the AFR report over the weekend about the distribution of investment properties across the population.

Using data from our latest surveys, we can estimate the relative distribution across households. The most interesting is the average number of properties held.  Around 80% of the investment population has a single investment property, a further 8% have two, and more than 4% have either 4 or 5. The highest count in our survey was 23!

If we overlay our household segmentation on this data, we discover that portfolio property investors have the highest distribution, followed by down traders.  First time buyers are more likely to be at the lower end.

The highest count registered in the ACT, followed by NSW.

Note this is data based on the number of properties held, not the number of properties mortgaged!


345,000 Aussie mortgage holders have no real equity in their homes

From Roy Morgan Research.

Overall some 8% (345,000) of mortgage holders in Australia in the year to August 2017 have been identified as having little or no real equity in their home, an increase from 7.1% twelve months ago. This is based on the fact that the value of their home is only equal to or less than the amount they still owe, placing them at considerable risk if they have to sell or prices decline.

These are the latest findings from Roy Morgan’s Single Source Survey which is based on over 50,000 interviews per annum, including more than 10,000 with owner occupied mortgage holders.

Apart from the ability to keep up with mortgage repayments, another critical factor in assessing financial risk for mortgage holders is to compare the value of their property with the amount outstanding on their loan. The purpose of this is to establish the level of equity (if any) they have, as this is a major component of most households’ financial position and potential risk.

Mortgage holders in WA most at risk

On average, the value of properties in Australia subject to a mortgage is well in excess of the amount outstanding but there are problem areas. The state at highest risk is WA where 14% (71,000) of mortgage customers’ have no real equity in their home.

Value of home is less or equal to amount owing

Source: Roy Morgan Single Source (Australia). 12 months ended August 2016, n= 10,746; 12 months ended August 2017, n= 10,251. Base: Australians 14+ with owner occupied home loan.

Over the last 12 months there has been an increase of 3.3% points in the proportion of mortgage holders in WA with little or no equity in their home. Tasmania has the lowest proportion of mortgage holders with little or no equity in their home, with only 4.9% (4,000). NSW is the second-best performer with 5.6% (81,000) of mortgage holders facing equity risk, followed by VIC with 6.1% (62,000), SA with 7.6% (26,000) and QLD with 10.3% (89,000). The strong performance in VIC and NSW is due mainly to the rapid rise in Sydney and Melbourne prices which has generally outpaced the amount owing on mortgages.

Lower-value homes face more equity risk

The mortgage holders with little or no equity in their homes have much lower average house values ($501,000) compared to all mortgage holders ($761,000).

Mortgage holders with home value less or equal to amount owing vs all mortgage holders

Source: Roy Morgan Single Source (Australia). 12 months ended August 2017, n= 10,251. Base: Australians 14+ with owner occupied home loan.

Across all states, the value of the homes overall with a mortgage is much higher than the value of homes owned by mortgage holders who have no real equity in their home. In NSW for example, the average value of homes with a mortgage is $975,000, compared to the much lower average of $623,000 for mortgage holders where the value of their home is less or equal to the amount they owe. In VIC the figures are $804,000 for the average home value with a mortgage, well above the $549,000 for mortgage holders with no equity in their home.

The Growing Gap Between Employment And Financial Security

The September update of the Digital Finance Analytics Household Finance Security Index, released today, underscores the growing gap between employment, which remains relatively strong, and the Financial Security of households.  We discussed this recently on ABC The Business. The Index fell from 98.6 in August to 97.5 in September.

This is below the 100 neutral setting, and continues the decline since December 2016.  Watch the video, or read the transcript.

The state by state view highlights a fall in NSW, while VIC holds higher, and there was a rise in WA from February 2017 lows. This highlights the fact the households across the national are under different levels of pressure.

Tracking by age bands we find younger households are significantly less confident, compared with those aged 50-60 years.  But across the board, the general trend is lower.

Property ownership remains a large factor, with those renting still below those owning property. We also see an ongoing decline in property investor confidence, thanks to tighter underwriting standards, higher mortgage rates, and the reduction in interest only loans availability.

Looking at the scorecard, there was a 4% fall in households comfortable with their savings, as they are forced to raid them to cover ongoing expenses (and the low returns on deposit balances as the banks seek to build margin).  There was a rise of nearly 3% of households who were uncomfortable with the amount of debt they hold, reflecting higher mortgage rates, especially on investment loans and interest only loans, and concerns about future rate movements. Finally, more households reported their overall net worth has deteriorated as home prices came under pressure.

The disconnect is that while people can, in the main, get some work, their earned income is not rising as fast as costs. We also find more households relying of a larger mix of fragmented part-time jobs, which tend to be less predictable.  As a result, we expect the current trends to continue, as momentum in the housing sector ebbs.  There is no obvious circuit breaker available in the current low interest rate, low growth environment.

By way of background, these results are derived from our household surveys, averaged across Australia. We have 52,000 households in our sample at any one time. We include detailed questions covering various aspects of a household’s financial footprint. The index measures how households are feeling about their financial health. To calculate the index we ask questions which cover a number of different dimensions. We start by asking households how confident they are feeling about their job security, whether their real income has risen or fallen in the past year, their view on their costs of living over the same period, whether they have increased their loans and other outstanding debts including credit cards and whether they are saving more than last year. Finally we ask about their overall change in net worth over the past 12 months – by net worth we mean net assets less outstanding debts.

We will update the results again next month.

Top 10 Mortgage Stress Count Down – September 2017

Mortgage stress rose again in September according to Digital Finance Analytics analysis, crossing the 900,000 household rubicon for the first time. The latest RBA data shows household debt to income rose again in June, to 193.7, further confirmation of Australia’s debt problem.

Across the nation, more than 905,000 households are estimated to be now in mortgage stress (last month 860,000) and more than 18,000 of these in severe stress. This equates to 28.9% of households. A rising number of more affluent households are being impacted as the contagion of mortgage stress continues to spread beyond the traditional mortgage belts. We estimate that more than 49,000 households risk default in the next 12 months, up 3,000 from last month.

Watch the video to learn more, and count down the latest top 10 post codes. We had some new regions “promoted” into the list this time.

The main drivers of stress are rising mortgage rates and living costs whilst real incomes continue to fall and underemployment remains high.  Some households are now making larger mortgage repayments following out of cycle interest rate rises, and are simultaneously facing higher power prices, council rates and childcare costs. This remains a deadly combination and is touching households across the country, not just in the mortgage belts.

Our analysis uses the DFA core market model which combines information from our 52,000 household surveys, public data from the RBA, ABS and APRA; and private data from lenders and aggregators. The data is current to end September 2017. We analyse household cash flow based on real incomes, outgoings and mortgage repayments, rather than using an arbitrary 30% of income.

Households are defined as “stressed” when net income (or cashflow) does not cover ongoing costs. Households in mild stress have little leeway in their cash flows, whereas those in severe stress are unable to meet repayments from current income. In both cases, households manage this deficit by cutting back on spending, putting more on credit cards and seeking to refinance, restructure or sell their home.  Those in severe stress are more likely to be seeking hardship assistance and are often forced to sell. The debt-to-income (DTI) ratios in severely stressed households are on average eleven times their current annual incomes and this is high on any measure. The combined statistics suggest there are continuing concerns about underwriting standards.

We revised our expectation of potential interest rate rises, given the stronger data on the global economy. Probability of default extends our mortgage stress analysis by overlaying economic indicators such as employment, future wage growth and cpi changes.

Martin North, Principal of Digital Finance Analytics said that “continued pressure from low wage and rising costs means those with bigger mortgages are especially under the gun. These stressed households are less likely to spend at the shops, which will act as a further drag anchor on future growth. The number of households impacted are economically significant, especially as household debt continues to climb to new record levels”. The latest household debt to income ratio is now at a record 193.7.[1]

Gill North, joint Principal of Digital Finance Analytics and a Professorial Research Fellow in the law school at Deakin University, citing her recent research, suggests the Australian house party has been glorious – but the hangover may be severe and more should be done to mitigate future risks and harm to highly indebted households and the nation.[2]

She notes that at the beginning of 2016 the RBA and APRA stood largely aloof from concerns around levels of household debt and the major risk was complacency. While the RBA and APRA have been more vocal since and have taken steps to tighten lending standards, she calls for additional measures and highlights the continuing vulnerability of many households without financial buffers for adverse contingencies.[3]

Regional analysis shows that NSW has 238,703 households in stress (238,755 last month), VIC 243,752 (236,544 last month), QLD 168,051 (146,497 last month) and WA 124,754 (118,860 last month). The probability of default rose, with around 9,300 in WA, around 9,100 QLD, 12,800 in VIC and 13,100 in NSW.

You can request our media release. Note this will NOT automatically send you our research updates, for that register here.

[contact-form to=’mnorth@digitalfinanceanalytics.com’ subject=’Request The Sept 2017 Stress Release’][contact-field label=’Name’ type=’name’ required=’1’/][contact-field label=’Email’ type=’email’ required=’1’/][contact-field label=’Email Me The Sept 2017 Media Release’ type=’radio’ required=’1′ options=’Yes Please’/][contact-field label=”Comment If You Like” type=”textarea”/][/contact-form]

Note that the detailed results from our surveys and analysis are made available to our paying clients.

[1] RBA E2 Household Finances – Selected Ratios June 2017

[2] Gill North ‘The Australian House Party Has Been Glorious – But the Hangover May Be Severe: Reforms to Mitigate Some of the Risks’ in R Levy, M O’Brien, S Rice, P Ridge and M Thornton (eds), New Directions For Law In Australia (ANU Press, Canberra, 2017). An earlier version of this book chapter is available at https://ssrn.com/author=905894.

[3] See also, Gill North, ‘Regulation Governing the Provision of Credit Assistance & Financial Advice in Australia: A Consumer’s Perspective’ (2015) 43 Federal Law Review 369. An earlier draft of this article is available at https://ssrn.com/author=905894.


Mortgage stress up despite decline in rates

New research from Roy Morgan shows that mortgage stress has increased to 17.3% of borrowers in July, an increase of 0.3% points over the last 12 months, despite a decline in loan rates.

Home loan rates were based on the standard variable rate from the RBA which in the three months ended July 2017 averaged 5.25%, down from 5.40% for the same period in 2016.

These are the latest findings from Roy Morgan’s Single Source Survey (Australia) of over 50,000 consumers per annum, which includes interviews with over 10,000 owner occupied mortgage holders.

Increase in ‘At Risk’ and ‘Extremely at Risk’ mortgage holders

Over the last 12 months there has been an increase in mortgage stress for both those considered to be ‘At Risk’ (which is based on the amount originally borrowed) and those ‘Extremely at Risk’ (based on the amount currently outstanding). In the three months to July 2016, 17.0% of mortgage holders were ‘At Risk’, this has increased to 17.3% in July 2017. Over the same period the proportion that were ‘Extremely at Risk’ also increased from 12.4% to 12.8%.

Mortgage Stress – Owner Occupied Mortgage Holders


Mortgage stress is based on the ability of home borrowers to meet the repayment guidelines currently provided by the major banks. 1. “At Risk” is based on those paying more than a certain proportion of their household income (15% to 50% depending on income) into their loans based on the appropriate Standard Variable Rate reported by the RBA and the amount the respondent initially borrowed. 2. “Extremely at Risk” is based on those paying more than a certain proportion of their household income (30% to 45% depending on Income) into their home loans based on the Standard Variable Rate set by the RBA on the amount respondents currently owe on their home loan. Source: Roy Morgan Single Source (Australia) 3 months ended July 2016, n = 2,673, 3 months ended July 2017, n = 2,734. Base: Australians 14+ with owner occupied home loan

Household incomes of mortgage holder’s not keeping pace with borrowings

The main cause of the increase in mortgage stress was the fact that over the last year, the median household income of mortgage holders only increased by 2.0%, well behind the increase in the median amount borrowed (up 7.4%) and the median amount outstanding (up 13.1%).

Major Factors Impacting Increase in Mortgage Stress – Last 12 Months

1. Percentage change is based on 3 months to July 2017, compared to 3 months to July 2016. Source: Roy Morgan Single Source (Australia) 3 months ended July 2016, n = 2,673, 3 months ended July 2017, n = 2,734. Base: Australians 14+ with owner occupied home loan

The increase in mortgage stress was despite the fact that home loan rates (based on the RBA standard variable rate) over this period actually declined from 5.40% to 5.25%.

Mortgage Tightening – The Property Imperative Weekly 30 Sept 2017

Mortgage Lending is slowing and banks are tightening their underwriting standards still further, so what does this tell us about the trajectory of home prices, and the risks currently in the system?

Welcome to the Property Imperative weekly to 30th September 2017. Watch the video, or read the transcript.

We start our review of the week’s finance and property news with the latest lending data from the regulators.

According to the RBA, overall housing credit rose 0.5% in August, and 6.6% for the year. Personal credit fell again, down 0.2%, and 1.1% on a 12-month basis. Business credit also rose 0.5%, or 4.5% on annual basis. Owner occupied lending was up $17.5 billion (0.68%) and investment lending was up $0.8 billion (0.14%). Credit for housing (owner occupied and investor) still grew as a proportion of all lending. The RBA said the switching between owner-occupier and investment lending is now $58 billion from July 2015, of which $1.7 billion occurred last month. These changes are incorporated in their growth rates.

On the other hand, data on the banks from APRA tells a different story. Overall the value of their mortgage portfolio fell 0.11% to $1.57 trillion. Within that owner occupied lending rose 0.1% to $1.02 trillion while investment lending fell 0.54% to $550 billion. As a result, the proportion of loans for investment purposes fell to 34.9%.

This explains all the discounts and special offers we have been tracking in the past few weeks, as banks become more desperate to grow their books in a falling market. Portfolio movements across the banks were quite marked, with Westpac and NAB growing their investment lending, while CBA and ANZ cutting theirs, but this may include loans switched between category. Remember that if banks are able to switch loans to owner occupied categories, they create more capacity to lend for investment purposes.  Putting the two data-sets together, we also conclude that the non-bank sector is also taking up some of the slack.

Our mortgage stress data got a good run this week, with the AFR featuring our analysis of Affluent Stress. More than 30,000 households in the nation’s wealthiest suburbs are facing financial stress, with hundreds risking default over the next 12 months because of soaring debts and static incomes. This includes blue ribbon post codes like Brighton and Glen Iris in Victoria, Mosman and Vaucluse in NSW and Nedlands and Claremont in WA.

The RBA is worrying about household debt, from a financial stability perspective, according to Assistant Governor Michele Bullock.  She said households have really high debt – mainly mortgages, as a result of low interest rates and rising house prices, and especially interest only loans. “High levels of debt does leave households vulnerable to shocks.” She said. The debt to income ratio is rising (150%), but for some it is much higher. We will release our September Stress update this coming week.

Debt continues to remain an issue. For example, new data from the Australian Financial Security Authority shows that in 2016–17, the most common non-business related causes of debtors entering personal insolvencies was the excessive use of credit (8,870 debtors), followed by unemployment or loss of income (8,035 debtors) and then domestic discord or relationship breakdown (3,222 debtors). However, employment related issues figured first in WA and SA.

It is also worth saying the Bank of England has now signalled that the UK cash rate will rise, and this follows recent statements from the FED in the same vein. It is increasingly clear these moves to lift rates will raise international funding costs to banks and put more pressure on the RBA to follow suit.

Meantime, lenders continue to tighten their underwriting standards.

ANZ announced that it will be implementing new restrictions on some loans for residential apartments, units and flats in Brisbane and Perth. Now there will be a maximum 80 per cent loan-to-value ratio for owner-occupier and investment loans for all apartments in certain inner-city post codes. We think these changes reflect concerns about elevated risks, due to oversupply and price falls. ANZ’s policy changes apply to all apartments in affected postcodes, including off-the-plan and non-standard small residential properties valued at less than $3 million. Granny flats though are excluded.

More generally, ANZ also issued a Customer Interview Guide with specific which topics brokers should discuss with home and investment loan borrowers. “We expect brokers to use a customer interview guide (CIG) to record customer conversations as a minimum moving forward,” noted ANZ “while it is not required to submit the CIG with the application, it should be made available when requested as a part of the qualitative file reviews.”

CBA launched an interest-only simulator to help brokers show customers the differences between IO and P&I repayments and a new compulsory Customer Acknowledgement form to be submitted with all home loan applications that have interest-only payments to ensure that IO payments meet customer needs. CBA said that brokers must complete the simulator for all customers who are considering IO payments irrespective of whether the customer chooses to proceed with them. These requirements will be mandatory for all brokers and will become effective on Monday, 9 October.

Suncorp announced it is introducing new pricing methodology for interest only home lending. Variable interest rates on existing owner-occupier interest only rates will increase by 0.10% p.a and variable interest rates on all investor interest only rates will increase 0.38% p.a., effective 1 November, 2017.

But what about property demand and supply?

The ABS said Australia’s population grew by 1.6% during the year ended 31 March 2017. Natural increase and Net Overseas contributed 36.6% and 59.6% respectively. In fact, all states and territories recorded positive population growth in the year ended 31 March 2017, but Victoria recorded the highest growth rate at 2.4%. and The Northern Territory recorded the lowest growth rate at 0.1%. Significantly, Victoria, the state with the highest growth rate is currently seeing the strongest auction clearance rates, strong demand, and home price growth. This is not a surprise, given the high migration and this may put a floor on potential property price falls.

On the other hand, we also see an imbalance between those seeking to Trade up and those looking to Trade down, according to our research. Those trading up are driven by expectations of greater capital growth (42%), for more space (27%), life-style change (14%) and job change (11%). Those seeking to trade down are driven by the desire to release capital for retirement (37%), to move to a place which is more convenient (either location, or for easier maintenance) (31%), or a desire to switch to, or invest in an investment property (18%).  In the past we saw a relative balance between those seeking to trade up and those seeking to trade down, but this is now changing.

Intention to transact, highlights that relatively more down traders are expecting to transact in the next year, compared with up traders. Given that there around 1.2 million Down Traders and around 800,000 Up Traders, we think there will be more seeking to sell, than buyers able to buy. As a result, this will provide a further drag on future price growth, especially in the middle and upper segments of the markets, where first time buyers are less likely to transact. This simple demand/supply curve provides another reason why prices may soon pass their peaks. Up Traders have more reason to delay, while Down Traders are seeking to extract capital, and as a result they have more of a burning platform.

Finally, auction clearance rates were still quite firm, despite the fact that property price growth continues to ease and time on market indicators suggest a shift in the supply and demand drivers, especially in Sydney.

So, overall, banks are on one hand still wanting to grow their home loan portfolios (as it remains the main profit driver), but lending momentum is slowing, and underwriting standards are being tightened further, at a time when home price growth is slowing.

This leaves many households with loans now outside current lending criteria, households who are already feeling the pain of low income growth as costs rise. More households are falling into mortgage stress, and this will put further downward pressure on prices and demand.

So we think the risks in the mortgage market are extending further, and the problem is that recent moves to ease momentum have come too late to assist those with large loans relative to income. As a result, when rates rise, as they will, the pain will only increase further.

And that’s the Property Imperative weekly to 30th September 2017.