Many Eastern States Investment Properties Are Underwater

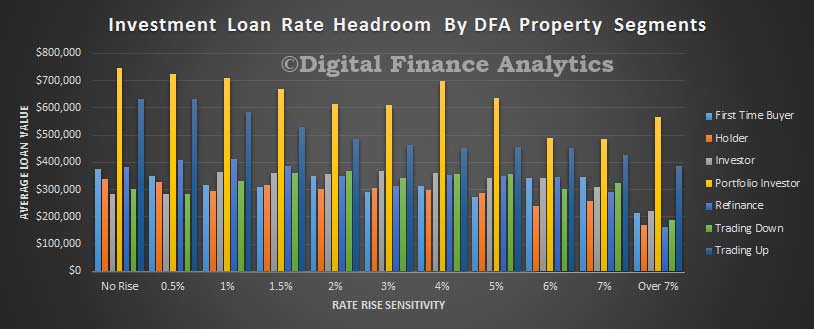
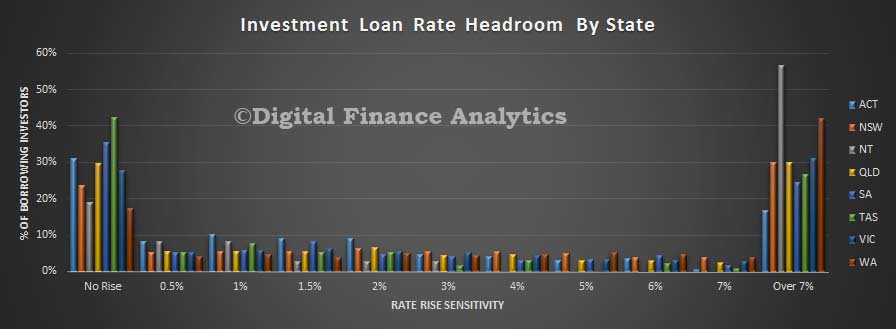
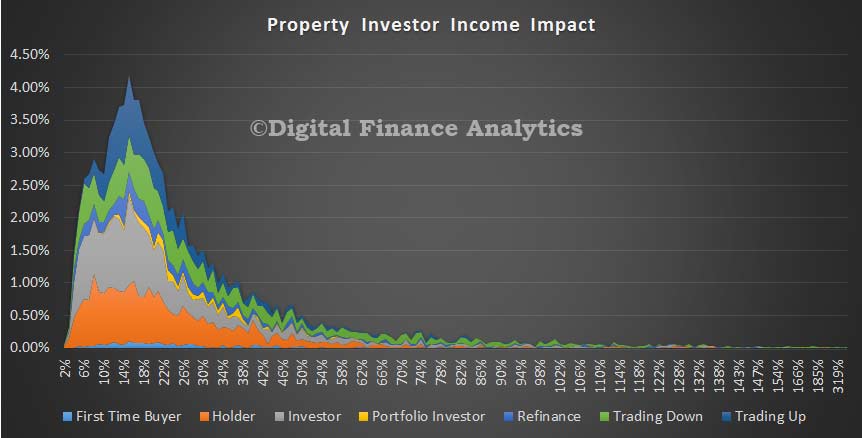
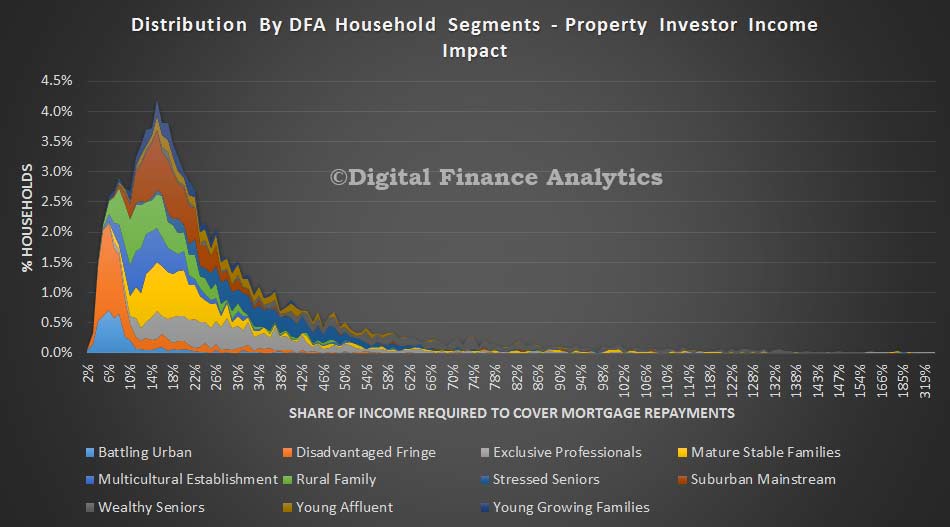
We have had the opportunity to do a deep dive on investment property loans, using data from our household surveys. We have looked at gross rental returns, net rental returns (after the costs of mortgage servicing are included) and net equity held (current property value minus mortgage outstanding). The results are in, and they make fascinating reading, especially in the context of up to 40% of all residential property loans being for investment purposes, according to the RBA. Whilst we will not be sharing the full results here, one chart tells the story quite well.

We show the average gross rental yield on houses by state, (the blue bar), net rental yields before tax (the orange bar) and the net gross average capital gain (the yellow line). Gross yield is annualised rental over current value, assuming full occupancy;  net rental is annual rental less annual mortgage repayments; and capital value is the current marked to market price less current outstanding mortgage. The first two are shown as a percentage, the last as a dollar value. The chart below only covers houses, we have separate data on other property types but won’t show that here.
Rental-SnapshotWe found that investment property which were houses in VIC were on average losing money at the net rental level (and this is before any maintenance or other costs on the property). Those in NSW were a little better, but still in negative territory. The other states were in positive ground – some only just – and of course this is at current interest rates, before the latest uplifts were applied by the banks. We accept that the pre-tax position does not tell the full story, but as a stand-alone investment, many property investors are from a cash flow perspective underwater. Indeed, they are banking on prospective capital gains, and at the moment, they do have a cushion, but if prices were to slip, many would find this eroded quickly.

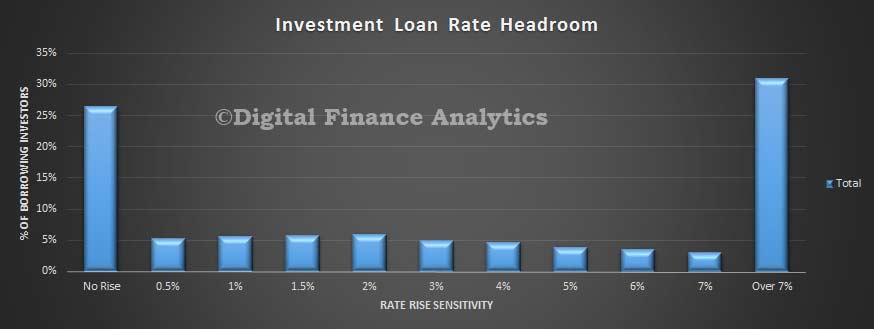
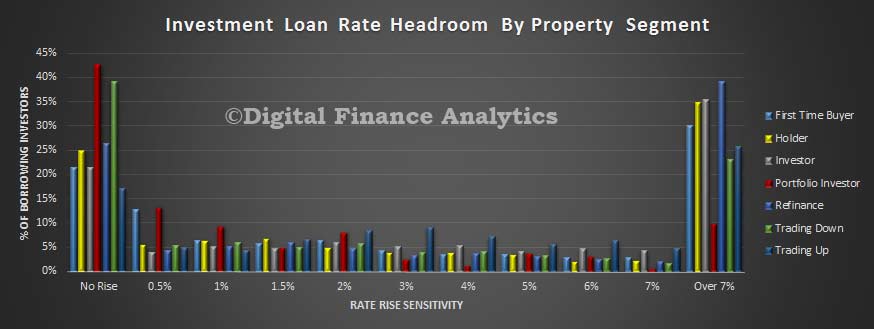
Our take is that the property investment sector contains considerable risks for banks, and investors, and these are not well understood at the moment. The more detailed analysis we did also showed that some specific customer segments, regions and postcodes were more at risk. Running scenarios on small interest rate rises shows that things get worse very quickly, especially for higher LVR loans.

We concur with analysis from Ireland and New Zealand, that the risks in the investment loan portfolios, despite the apparent historic low rates of default, are higher, and under Basel IV we expect investment loans to carry a higher capital rating, meaning that interest rates on investment loans are likely to rise more in the future, relative the the cash rate.


America’s rental affordability crisis is about to go from bad to worse

From The Conversation.

We just learned America’s rental affordability crisis is as bad as it’s ever been. Unfortunately, it’s about to get a whole lot worse.

The American Community Survey for 2014, released a few weeks ago, found that the number of renters paying 30% or more of their income on housing – the standard benchmark for what’s considered affordable – reached a new record high of 20.7 million households, up nearly a half-million from the year before. Despite the improving economy, the increase was nearly five times bigger than last year’s gain.

That means about half of all renters live in housing considered unaffordable. And the latest increase comes on top of substantial growth since 2000 that has seen this number climb by roughly six million households over the period, an increase of about 41%.

Worse still are the more than 11 million households with severe cost burdens, paying more than half their income for housing, up from seven million at the start of the century.

Having so many families and individuals struggling to pay their monthly rent is a clear cause for concern. Renters in this situation are forced to make difficult trade-offs to make ends meet, including opting for housing in distressed neighborhoods or in poor condition. In fact, in an analysis of consumer expenditure data we undertook at the Harvard Joint Center for Housing Studies, we found that renters in this situation largely accommodate their high housing costs by spending substantially less on such basic needs as food and health care.

This growing problem needs to be addressed because having a stable, decent home has been found to produce a wide variety of benefits, from better health outcomes to improved school performance among children. There is also growing evidence that providing permanent affordable housing for homeless individuals and families is much more cost effective than paying for temporary housing.

With the housing crash receding from the headlines and prices on the rise again, it is all too easy to believe that as the economy heals, the housing affordability crisis will naturally ebb without the need for greater efforts by our public leaders.

Unfortunately, this is wishful thinking.

US-Rentals-1

Prospects for improvement

The rising tide of cost-burdened renters has its roots both in the real (inflation-adjusted) growth in the cost of rental housing and in falling renter incomes.

Since 2001, the median monthly rental price in the US has climbed significantly faster than inflation, while the typical renter’s pretax income has fallen by 11%. These trends were evident even before the recession and housing bust, but have certainly been exacerbated by the economic travails since.

Now that the economy is nearing full employment and holding out the prospect of a rebound in incomes and construction of new apartments is reaching levels not seen since the 1980s, there would seem to be some hope that the extent of rental cost burdens would start to abate. But at the same time, there are also demographic forces at work that are likely to make matters worse.

The two fastest-growing segments of the population in coming years will be those over age 65 and Hispanics, both of which are more likely to experience cost burdens.

In collaboration with researchers at the affordable housing nonprofit Enterprise Community Partners, the Joint Center for Housing Studies set out to simulate future trends for cost-burdened renters based on our household projections for the next decade under different scenarios in which rents continue to outpace incomes, or, alternatively, where we see a turnaround in current conditions and incomes grow faster than rents.

As we document in our recent report, we found that demographic forces alone will push up the number of renters with severe rent burdens by 11% to more than 13 million by 2025, with a large share of the growth among the elderly and Latinos. That’s assuming incomes and rents both grow in line with overall inflation.

If we do get lucky enough to see gains in income outpace the rise in rents by 1% annually over the next decade, we would see a modest decline of some 200,000 renters with severe burdens. That’s some improvement but not nearly enough to appreciably change the current challenge. And this modest net improvement would mask a still-significant growth in rent burdens among Hispanics of 12%.

US-Rentals-2But alternatively, if rents continue to grow faster than incomes at a pace similar to what we see today, we could see the number of renters spending more than half their income on housing reach 14.8 million, an increase of 25% over today’s record levels. That would mean 31% of US renters – and most likely at least a few of your family and friends – would be desperately struggling to get by.

What can we do about it?

So what do we need to do to address this situation?

Since falling incomes are a key part of the problem, efforts to raise take-home pay will have to be part of the solution. Increases in the minimum wages will help to some extent. Improvements in education and job training that prepare people for decent paying jobs are also needed.

On the housing front, there is also a strong case for an expansion of assistance for the nation’s lowest-income households. About 28% of renters earn less than US$20,000 a year. At that income, monthly housing costs have to be $500 or less to be affordable.

The private market simply can’t supply housing at such low rents. Public assistance is needed to close the gap. However, at present only about one out of four households who would qualify for this federal housing assistance based on their income is able to secure one of these units. Unlike other programs in the social safety net, housing assistance is not an entitlement. And we simply don’t come anywhere close to fully funding housing assistance to help all those eligible.

The vast majority of those who are left out face so-called worst-case housing needs, paying more than half their income for housing or living in severely inadequate housing.

Solving the housing problem

There are two main ways in which we have extended housing assistance in recent decades: 1) by providing housing choice vouchers that subsidize monthly costs for homes the tenant finds in the private market or 2) by subsidizing the cost of new housing or the rehabilitation of existing housing with support of the Low Income Housing Tax Credit.

Both programs have their place. In markets where modestly priced housing in a range of neighborhoods is not in short supply, vouchers make sense as a means of taking advantage of housing that already exists. Vouchers also have the potential for giving greater choice about where residents want to live in a metro area.

The housing credit program also plays an important role in helping to preserve existing subsidized housing that needs new investment, in helping to turn around neighborhoods where new housing can have a positive impact and in adding affordable housing in neighborhoods where it would not otherwise be provided.

Still, both programs could benefit from reforms to ensure that funds are used efficiently and that the housing opportunities provided are not concentrated in distressed neighborhoods.

For example, the Department of Housing and Urban Development recently started a pilot program that factors the variability of market rental prices across neighborhoods into the maximum rent its vouchers cover. Currently, the limit it is set at is the same for an entire metropolitan area. The new approach would allow that limit to vary across neighborhoods, giving beneficiaries more choice in where to live and also keep HUD from overpaying in distressed areas.

There are also proposals for reforming the housing tax credit program to allow it to serve a broader range of income levels and make it easier for people to get aid in high-cost markets like New York, San Francisco and Boston, where rental burdens are increasingly a problem among moderate-income households and not just the poor.

The grass roots

Beyond these federal efforts, state and local governments also have an important role to play in fostering a greater supply of affordable housing.

In addition to providing public funds for this purpose, these levels of government set land use regulations and policies that have the potential to spur affordable housing production. But all too often, they deter affordable housing production through complex and costly approval processes as well as limits on the types of housing that can be built.

With both demographic and economic trends likely to keep the number of cost-burdened renters at record levels for years to come, the issue is not going to go away. But we still lack the political urgency to take the steps needed to do something about the problem; housing affordability hasn’t even come up in any of the presidential debates.

It may be because it has historically been borne by the nation’s most disadvantaged families and individuals. But with the number of cost-burdened renters reaching highs each year, the challenge of paying the rent each month is becoming a significant concern for a broader swath of the country with each passing year.

It’s time our political leaders take notice and take action.

Author: Chris Herbert, Managing Director of the Joint Center for Housing Studies, Harvard University, Andrew Jakabovics, senior director for policy development and research at affordable-housing nonprofit Enterprise Community Partners.

Private Health Insurance Sector Needs Reform

The ACCC has released its 16th report to the Australian Senate on competition and consumer issues in the private health insurance industry for the period 1 July 2013 to 30 June 2014. The ACCC has previously found that the industry is characterised by information asymmetry and complexity. These findings have been replicated in this report. The ACCC has an obligation to provide an annual report on competition and consumer issues within the private health insurance industry under an Australian Senate order. However, seems that not much follows from such reviews!

The private health insurance industry is an important component of the Australian health care system. The number of people with private health insurance has been growing steadily, with year on year average increases of 2.5 per cent over the last 10 years. At the end of 2013–14, 47.2 per cent of the population was covered for hospital treatment and 55.2 per cent was covered by general treatment policies, commonly referred to as ‘extras’ cover. Health insurers generate revenue from the sale of health insurance policies as well as through the investment of premium reserves. Currently there are over 20 000 private health insurance policies on offer to consumers in Australia. Over the next five years, industry revenue and profit are forecast to grow at a compound annual rate of 6.4 per cent to reach $28.8 billion. Annual revenue in 2014-15 is estimated at $21.1bn and returning $1.5bn in profit. There are 34 businesses providing health care insurance.

Their main findings were:

First, there are market failures due to asymmetric and imperfect information. This leads to complexity in private health insurance policies, which reduce consumers’ ability to compare policies and make informed choices. Further, consumers have limited information about their likely future health needs, which may lead to consumers underestimating their future medical needs and instead focusing on the immediate costs and benefits of private health insurance.

Second, existing regulatory settings can change consumers’ incentives in purchasing private health insurance and drive insurers to offer products to primarily reduce consumers’ tax liabilities, rather than also focussing on consumers’ current and future medical needs (which are difficult to predict). As funds respond to market demand for affordable policies, there are increasing policy limitations and exclusions leading to higher numbers of consumers having policies with less cover than they expected. This leads to an increased risk of consumers facing unexpected out-of-pocket expenses and general dissatisfaction with the system. We accept that some consumers in purchasing private health insurance may only be seeking to reduce their tax burden and/or the risk of the LHC loading. However, they still expect basic
cover from their purchase.

Third, while health insurers may be strictly compliant with the requirements of the Private Health Insurance Act and the Code, the research has revealed examples where representations by insurers to consumers, including when entwined with policy variations, may be at risk of breaching the consumer laws.

There were some interesting consumer insights:

Consumers’ understanding of policy benefits and exclusions will vary depending on the complexity of the information provided and their familiarity with the health system and their health needs. Where insurers provide information that is overwhelming, incomplete or complex, it is less likely that consumers will be able to exercise informed choices to purchase cover that is appropriate to their needs and circumstances. In turn, these consumers are more likely to face unknown or hidden costs of private services that are not covered in full by their insurance. There are a range of factors in the private health sector that increase complexity for consumers, including:

  1. regulatory settings, providing participation incentives and government rebates that vary depending on age and income
  2. policy exclusions, excesses, co-payments and waivers
  3. preferred provider arrangements
  4. the rewards and benefits being offered by larger insurers if certain conditions are met.

Adding to the complexity is the sheer number of options available, and that each insurer has different terminology and ways of presenting information, which makes comparisons difficult. Policies can contain a mix of levies, surcharges and rebates. Sometimes the specific details are hidden or obscured in lengthy and complex policy documents that are not easily accessible to consumers. In addition, private health insurance contracts allow for the insurer to unilaterally vary a consumer’s policy terms, conditions and exclusions (subject to private health insurance legislation). This means that even where a consumer spends considerable effort in understanding the policies on offer in order to make an informed choice, that effort may become redundant if an insurer subsequently decreases the cover provided. Under the ACL, provisions that allow such unilateral variations may constitute unfair contract terms (subject to a number of exemptions), particularly if the term is not transparent and causes consumer detriment.
The mix of levies, combined with a tendency by funds to change their policies over time, make it difficult for even astute consumers to judge the true cost and value of their private health insurance.

Most consumers with private health insurance will access some of their benefits at some point. The quantitative research found that while 30 per cent of consumers rarely access their benefits, 43 per cent sometimes do and 18 per cent do so frequently. Eight per cent had not yet accessed their private health insurance. The quantitative research also indicates that consumers who regularly use their private health insurance are more likely to feel informed about their health insurance, and confident they have received all they expected in terms of their rebate or claim. However, the data further discloses
that one quarter of consumers who have accessed their benefits have experienced at least one occasion where their expectations were not met, largely because they were dissatisfied with the claim amount or believed they were covered for something that they were not.

The quantitative research found that just under two thirds of all respondents have had private health insurance for 10 or more years. However, only 14 per cent of respondents had changed insurers, despite 48 per cent having thought about changing insurer and some taking steps to do so without completing the transaction. For respondents who have changed insurer or contemplated it, the most reported reason was that the premium was too expensive (57 per cent), followed by dissatisfaction with claim amount and policy benefits and exclusions (both 6 per cent). Respondents who have thought about changing private health insurers but have not done so, reported that their main reason for not changing was that they have not found an insurer that meets their needs (21 per cent), whilst 12 per cent considered that the process of changing is too difficult.


The Stressed Household Finance Report 2015 is Available

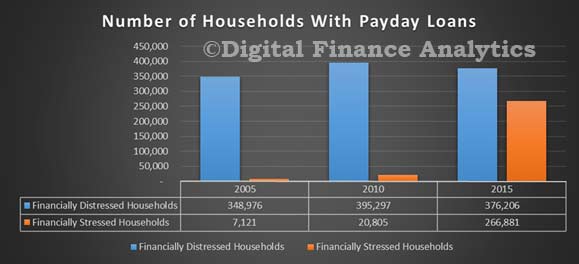
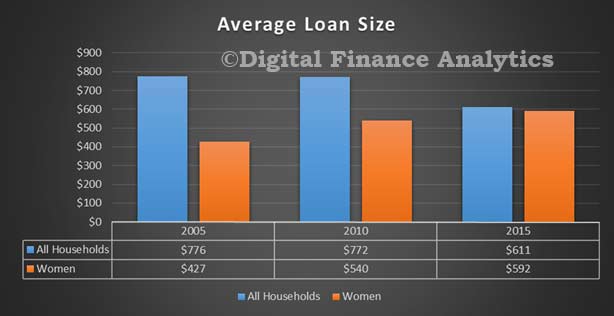
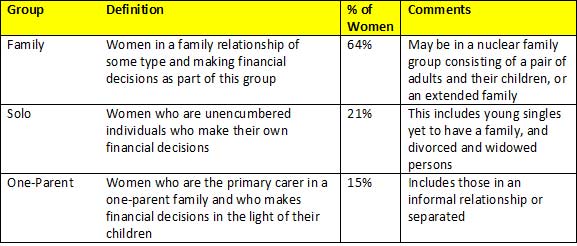
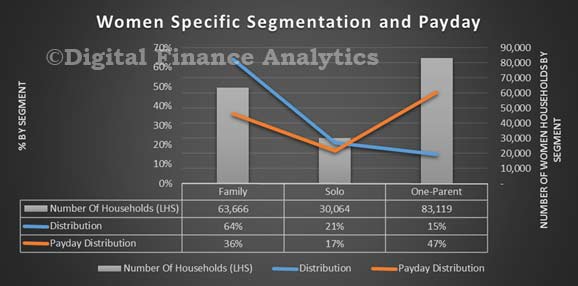
DFA has completed detailed analysis of households and their use of small amount credit contracts, a.k.a. payday lending.

Note this is looking at short term credit. If you are after our recent work on mortgage defaults and household financial stress, please follow this link:

The analysis, derived from our longstanding household surveys, was undertaken in conjunction with Monash University Centre for Commercial Law and Regulatory Studies (CLARS) and commissioned by Consumer Action Law Centre, Good Shepherd Microfinance, and Financial Rights Legal Centre.

Stressed-TitleWe review detailed data from the 2005, 2010 and 2015 surveys as a means to dissect and analyse the longitudinal trends. The data results are averaged across Australia to provide a comprehensive national picture. We segment Australian households in order to provide layered evidence on the financial behaviour of Australians, with a particular focus on the role and impact of payday lending.

To request the report, complete the form below. When submitted you will see an immediate acknowledgement, and receive the report via email after a short delay. Note this will not subscribe you to the DFA Blog. You can register to receive future updates here.
[contact-form to=’mnorth@digitalfinanceanalytics.com’ subject=’The Stressed Household Finance Report 2015′][contact-field label=’Name’ type=’name’ required=’1’/][contact-field label=’Email’ type=’email’ required=’1’/][contact-field label=’Comment If You Like’ type=’textarea’/][contact-field label=’Request Report’ type=’radio’ options=’Please Email Me The Report’/][/contact-form]

Online Access Is Driving Payday Industry to New Heights

DFA has completed detailed analysis of households and their use of small amount credit contracts, a.k.a. payday lending. The analysis, derived from our longstanding household surveys, was undertaken in conjunction with Monash University Centre for Commercial Law and Regulatory Studies (CLARS) and commissioned by Consumer Action Law Centre, Good Shepherd Microfinance, and Financial Rights Legal Centre. The report “The Stressed Finance Landscape” is available here.
We review detailed data from the 2005, 2010 and 2015 surveys as a means to dissect and analyse the longitudinal trends. The data results are averaged across Australia to provide a comprehensive national picture. We segment Australian households in order to provide layered evidence on the financial behaviour of Australians, with a particular focus on the role and impact of payday lending.
We think the overall size of the market is growing, thanks to the rise on online access, and we recently posted our modelling, which we summarise below:

PayDaySizeOct2015The transference to online channels is linked with a rise in the number of households who, whilst not financially distressed (distressed households are first not meeting their financial commitments as they fall due, and are also exhibiting chronic repeat behaviour, and have limited financial resources available) are financially stressed (struggling to manage their financial affairs, behind with loan repayments, in mortgage stress, etc).

Digital disruption opens the door to new lenders (local and overseas), and makes potential access to this source of credit immediate. The volume of loans is set to increase and more than ever will be originated online. In addition, some digital players offer special member designated areas secured by a password, where special offers and repeat loans could be made away from public sight.  Online services are now mainstream, and this presents significant new challenges for customers, policy makers and regulators.
Some of the key points (as summarised by Good Shepherd Microfinance) from the report:

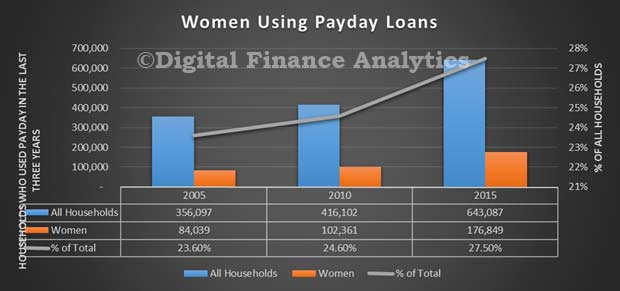
• The total number of households using a payday lending service in the past three years has increased by more than 80 per cent over the past decade (356,097 to 643,087 households).

• All payday borrowers were either ‘financially stressed’ (41 per cent) in that they couldn’t meet their financial commitments or ‘financially distressed’ (59 per cent) because in addition to not meeting their financial commitments, they exhibited chronic repeat behaviour and had limited financial resources.

• 2.69 million households are in ‘financial stress’ which represents 31.8 per cent of all households and is a 42 per cent increase on 2005. Of the households in financial stress, 1.8 million are ‘financially distressed’ (just over 20 per cent of all households) – a 65 per cent increase on 2005.

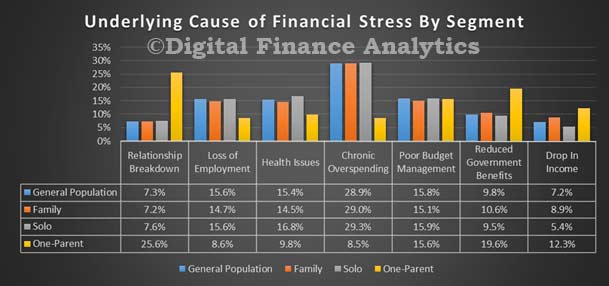
• The number of people who nominated overspending and poor budget management as causes of financial stress had decreased over the past 10 years (from 57.2 per cent to 44.7 per cent). Unemployment has become a more significant factor with over 15 per cent of households indicating this caused their financial problems.

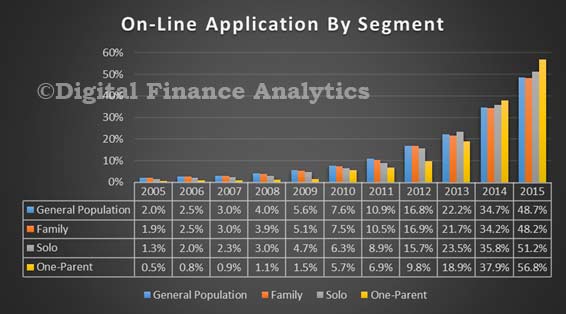
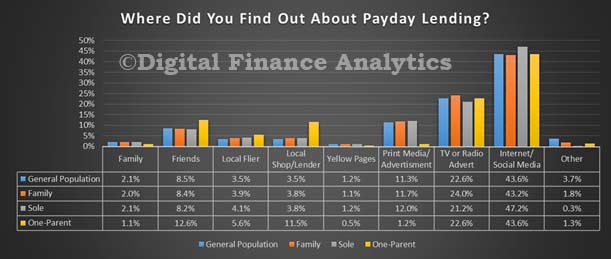
• In 2005, telephone and local shops were the most common interface to payday lenders. By 2015, more than 68 per cent of households used the internet to access payday lending. Mobile phones and public personal computers (eg libraries) were the most common device used.

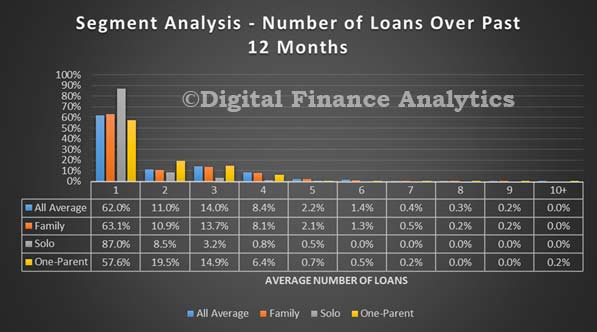
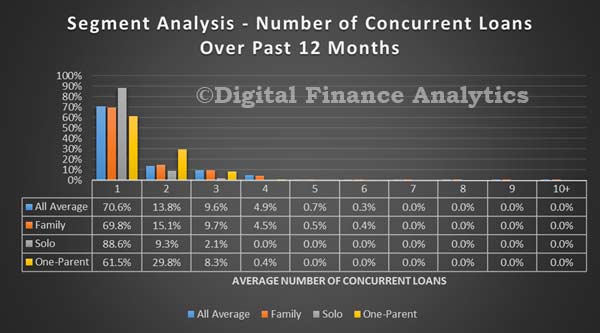
• The number of borrowers taking out more than one payday loan in 12 months has grown from 17.2 per cent in 2005 to 38 per cent in 2015 and borrowers with concurrent loans have increased from 9.8 per cent to 29.4 per cent in the same period.

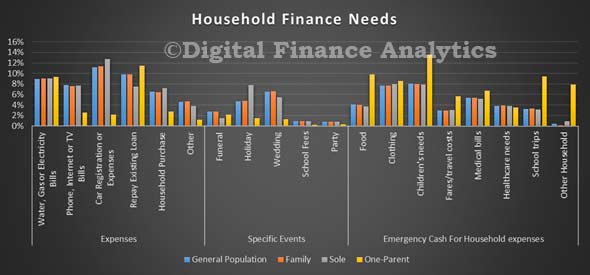
• The top three purposes for a payday loan were: emergency cash for household expenses (35.6 per cent). Emergency cash for household expenses included children’s needs (22.7%), clothing (21.6%), medical bills (15.1%) and food (11.4%). More payday loans are being used to cover the costs of internet services, phone bill and TV subscriptions (7.8 per cent) than in 2005 and 2010.

• Many distressed households (38.7 per cent) were refinancing another debt and 36.8 per cent already had another payday loan when taking out their payday loan. Around half of the households that had used payday lending services indicated they would be willing to take out another payday loan.

• Single men were more likely to use a payday loan (53 per cent) and the average age of the borrower was 41 years old. In the last five years, households in their thirties almost doubled their use of payday loans (16.3 per cent in 2005 to 30.35 per cent in 2015). Only 5.26 per cent of borrowers had a university education. The average annual income of payday borrowers in 2015 was $35,702.

• ‘Financially distressed’ households generally use payday loans either because it is seen as the only option (78 per cent), while ‘financially stressed’ households are attracted by the convenience (60.5 per cent).

How Big Is The Payday Lending Market In Australia?

Given the current Small Amount Credit Contract Laws review is in train, DFA has been looking at the data in our household surveys to try and quantify the potential size, and trends in the market – colloquially known as the payday lending sector. There is no consistent reporting of payday data, unlike other consumer finance statistics, and the industry comprises a number of commercial entities which do not fall within banking regulation or reporting.  Whilst the market is small compared with the $40bn credit card industry or the $140bn total consumer credit market, there are signs of growth, especially facilitated by online origination. We won’t rehearse the definitions or pros and cons of these loans, but will present our work on estimating the size of the payday market. This may assist others interested in the sector.

By way of context, there are many and varied estimates as to the size of the market. ASIC in 2013-2014 suggested $400m, and since 2010, ASIC enforcement action has resulted in close to $2 million in refunds to more than 10,000 consumers who have been overcharged when taking out a payday loan. In 2007, an article in the BRW suggested it was $800m, a number offered recently in an article “Making hay from payday loans” by Steve Worthington Adjunct Professor at Swinburne University in 2015.

So to estimate the size, we begin with data from our ongoing household surveys. From this data we can estimate the number and duration of loans being written each year. This is our baseline data and we think about $600m of loans were written in the last full year, to December 2014, a rise from $300m in 2005.

PayDayValueOct2015Significantly, if we apply our segmentation analytics on this data, we discover that the type of household accessing payday loans is changing. Whilst we won’t go into detail here, we identify households which are financially stressed, and those who are distressed. The former are primarily being embarrassed by a short term cash crisis,  and turn to payday on an occasional basis as a convenient fix often via an online service. Financially distressed households are those with chronic debt problems and were the core constituency of payday lenders a few year back. Of course some households who start out as stressed, slip into distress later.

We have also estimated the future value of new loans by these segments, based on a number of assumptions listed below.

PayDayEstimaterSegmentOct2015Note this is an indicative model only, and underlying assumptions and therefore outputs, may change. We model future volumetrics based on our baseline household survey data. We gross up the 26,000 per annum reference data to national level, on a statistical representative basis. We assume there will be similar utilisation and debt patterns, at a segment and state level, and overlay expected population and employment growth. We assume population and household growth will maintain current trend levels. In addition, we overlay current online segment profiles, which shapes the mix between both distressed and stressed households, and reflects the rise of online application and fulfillment for Pay Day loans. We project online take up forward, extrapolating from current trends and device usage. We assume the current mix and duration of loans, including multiple loans, continues at current rates. We assume no change in the current payday legislation, and we assume the current levels of availability of other forms of credit, and current lending rules.

We make the following specific assumptions (the DFA model can be flexed using different parameters).

  1. Unemployment at the national level will remain at 6.3% out to 2018 (and current state differentials continue, with rising rates in WA and SA.
  2. Cash interest rates will rise from 2.0% from mid 2016, to reach 3.5% by 2018
  3. GDP will remain at 2.5% to 2018
  4. Core inflation will remain at 2.5% to 2018
  5. Income growth, after inflation will be zero out to 2018

Estimates are rounded up. Based on past performance, we have a confidence level of +/- 1.5% out to December 2016, and +/- 3% beyond to 2018.

Finally though we want to estimate the total market size, so we need to take account of the total stock of loans outstanding, including those refinanced or extended, and those in default. This is significantly harder to estimate accurately. However, we have made an attempt, and we have assumed default rates will continue to run at close to 20% as indicated in our household surveys.

Thus, the baseline market estimate for the current year will be in the region of $670m, and when we include arrears, refinance and other stock adjustments it could be as high as $908m. We think the market will grow to more than $1bn with current regulatory and economic settings, thanks to the significant rise in online origination and the segment shifts. By 2018, we estimate that more than 80% of loans will be taken via online apps and web sites. The chart below summarises all these points.

PayDaySizeOct2015 One final perspective. If we chart the the DFA estimates for payday and the RBA Personal Finance Stock data (d02Hist) from 2005, we see that Pay Day lending growth is accelerating relative to the broader personal finance trends.

PayDayAndPersonalFinanceGrowth

DFA Household Finance Confidence Index Languishes In September

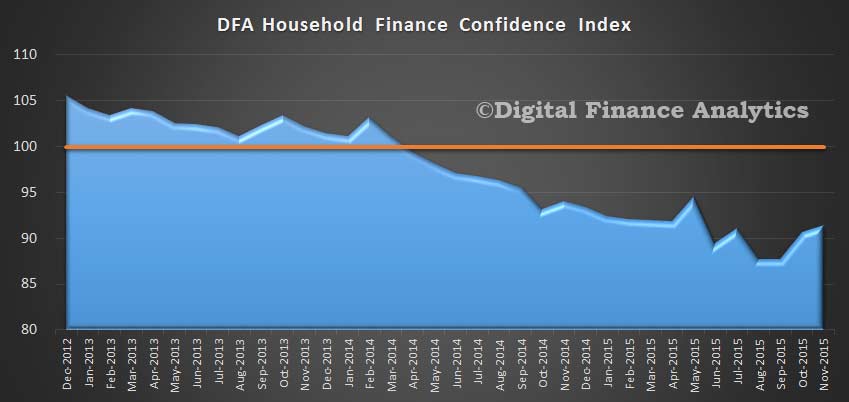
The negative household confidence sentiment continued in September according to the latest results from our household surveys, released today.   The overall score was 87.73, compared with 87.69 last month. These are levels well below 100 which is a neutral result, and still in the lowest region since 2012 when the DFA FCI started. The instability in the financial markets, flat real income growth, and rising costs swamped any positive impact on the change of Prime Minister overall. Households with property investments remain significantly more confident than those who are property inactive.

FCI-Sept-IndexThe results are derived from our household surveys, averaged across Australia. We have 26,000 households in our sample at any one time. We include detailed questions covering various aspects of a household’s financial footprint. The index measures how households are feeling about their financial health.

To calculate the index we ask questions which cover a number of different dimensions. We start by asking households how confident they are feeling about their job security, whether their real income has risen or fallen in the past year, their view on their costs of living over the same period, whether they have increased their loans and other outstanding debts including credit cards and whether they are saving more than last year. Finally we ask about their overall change in net worth over the past 12 months – by net worth we mean net assets less outstanding debts.

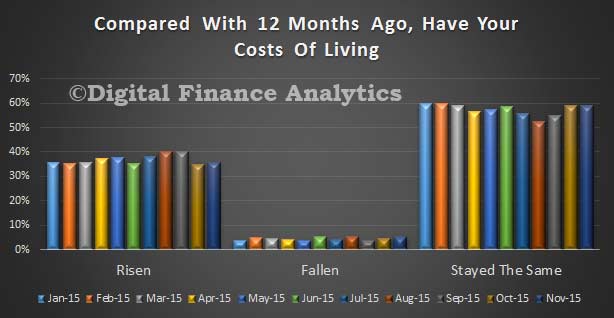
Looking in detail at the elements which drive the survey, 40% of households said their costs of living had risen in the past 12 months, a rise of 0.17% from last month. Only 3.6% of households said their costs had fallen, down 2% on last month. Major movements were driven by the rising costs of some supermarket goods, as well as child care and school fees. 55% of households said their costs of living had not changed in the part year, a rise of 2.5% from last month. The majority of younger households were significantly worse off.

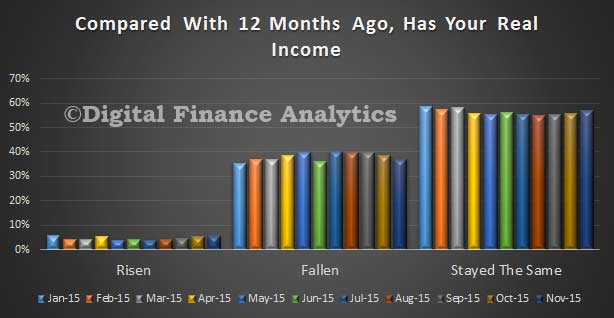
FCI-Sept-CostsTurning to income, after inflation, 4.8% of households said their incomes had risen, up 0.6% on last month, whilst 40% said their real incomes had fallen, down 2% on last month. 55% said there had been no change in the part 12 months. Those relying on income from savings continue to be hit by low deposit account interest rates, and recent stock market falls. We saw a number of households report a fall in overtime, especially in WA and SA, whilst in NSW and VIC additional work was a little easier to find.

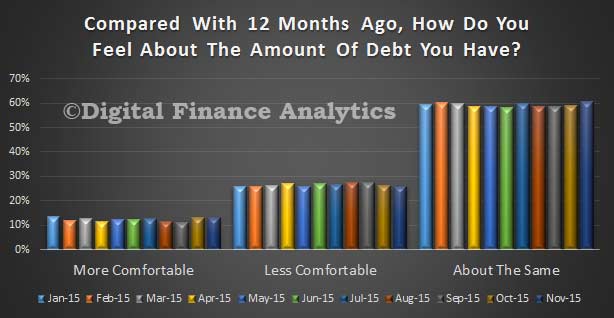
FCI-Sept-IncomeNext we look at debt. 11% of households were more comfortable than 12 months ago, little changed from last month. Many of these continue to pay ahead on their mortgage, and are reducing credit card debt. 27.7% of households were more uncomfortable than a year ago, up 0.38% on last month. Those younger households with a owner occupied mortgage were most concerned, and in addition, we noted the rise of concern among those using credit cards to balance their spending. The ongoing low mortgage rates on owner occupied mortgages provides a buffer, and so far, the higher rates on investment loans have not worked through to dent confidence. 58% of households were as comfortable with the debts they service, very similar to last month.

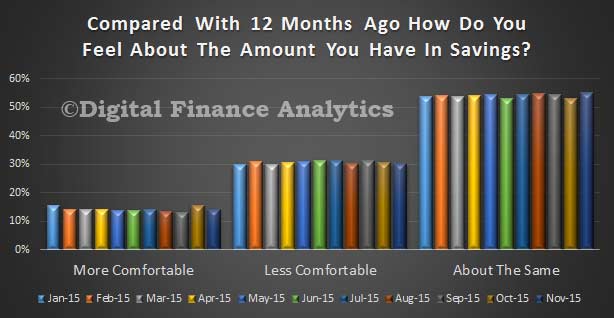
FCI-Sept-DebtLooking specifically at savings, 13.2% were more comfortable, down 0.4% on last month. 31.1% were less comfortable, up 1% on last month, thanks to stock market volatility and ultra low bank deposit rates. There was a higher concern now that the Government may impose more tax on superannuation following the change of leadership. 54% of households were still as comfortable compared with 12 months ago, little changed on the month.

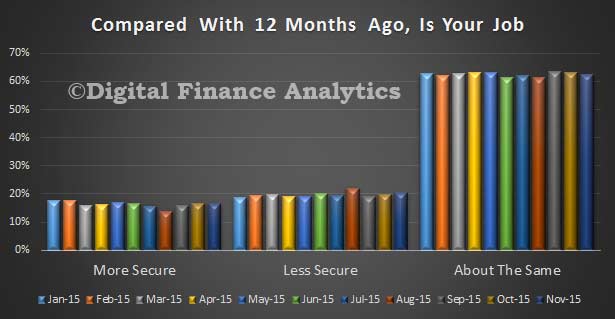
FCI-Sept-SavingsThe state variations in job security are becoming more pronounced, with WA, SA and NT all showing greater concerns, whilst NSW and VIC continued to improve. We noted those currently working in the construction sector were more concerned this month, thanks to an expected development slow-down. Those more secure than last year rose 2.1% to 15.9%, thanks to the NSW and VIC effect. 63% of households were as confident as 12 months ago, up 2%, whilst those less confident overall fell by 2% to 19%. However, there are a number of moving parts which are working in different directions, and which are averaged away in the national summary.

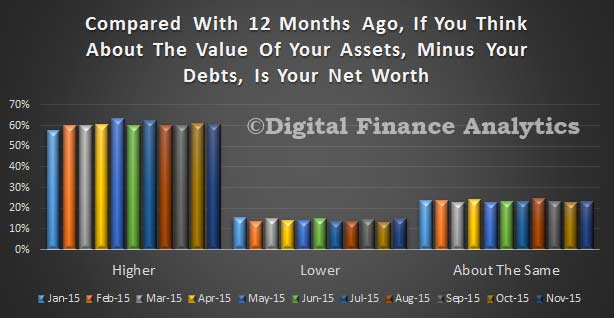
FCI-Sept-JobsFinally, we look at net worth, a measure of overall value held, net of debt by households. Overall, those with higher net worth than a year ago remained at 60%, whilst those with lower net worth rose 1% to 14.5%. 23.5% of households said they had no overall change, up 2.6% on last month. There are again offsetting forces at work in these results, with sustained house price growth in NSW and VIC more than offsetting falls in the stock market. On the other hand, states where house prices were weaker, were more likely to see net worth fall, because mortgage debt is still high.

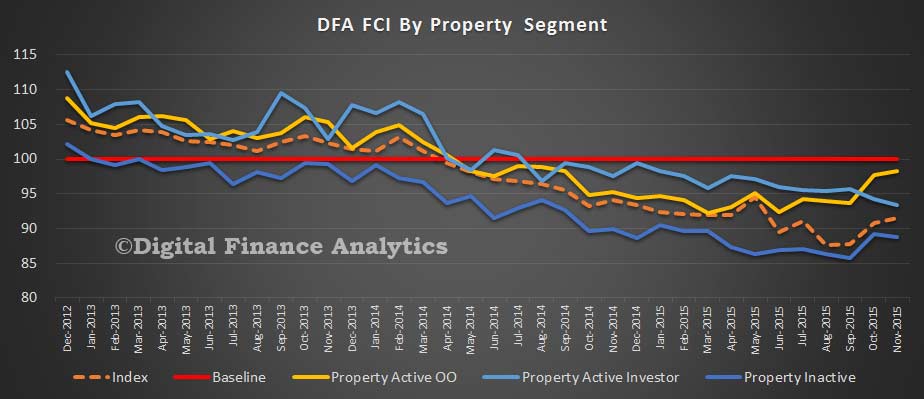
FCI-Sept-WorthIf we look at the overall index by property segment (as defined by DFA), those who are property inactive (either renting, living with friends, at home, or in public housing) had a lower confidence score, because they had all the pressures created by rising costs, static or falling incomes, and no upside from property. Investment property investors were the more confident (though still well below the 100 neutral level), and owner occupied home owners are between the other two segments.

FCI-Sept-Pty-IndexOverall then household financial confidence continues to languish, despite record low interest rates. Because of this we believe many households will continue to spend carefully, and be careful not to extend their high personal debt further. We also see how property is supporting the confidence levels significantly, and of course if this changed for any reason (for example, static or falling capital growth, or rising rates) confidence would be significantly dented further. The future of housing has become the key to confidence.

Property Investment Via SMSF Still On The Rise

As we round out the household segmentation analysis contained in the recently released Property Imperative report, today we look at residential property investment via a self managed superannuation fund.

APRA reports that Self-Managed Superannuation funds held assets were $589 billion at June 2015, a fall from $600 billion in March 2015.

Throughout the survey we noted an interest in investing in residential property via a self-managed superannuation funds (SMSFs). It is feasible to invest if the property meets certain specific criteria. In August the Government said such leveraged investments had their support, although the FSI inquiry had suggested such leverage should be banned. The rationale for this earlier recommendation was to prevent the unnecessary build-up of risk in the superannuation system and the financial system more broadly and fulfill the objective for superannuation to be a savings vehicle for retirement income, rather than a broader wealth management vehicle. Is this something which the Turnbull government might revisit?

Overall our survey showed that around 3.35% of households were holding residential property in SMSF, and a further 3% were actively considering it . Of these, 33% were motivated by the tax efficient nature of the investment, others were attracted by the prospect of appreciating prices (26%), the attractive finance offers available (15%), the potential for leverage (12%) and the prospect of better returns than from bank deposits (10%).

DFA-Sept-SMSF-1We explored where SMSF Trustees sourced advice to invest in property, 21% used a mortgage broker, 23% online information, 11% a Real Estate Agent, 14% Accountant, and 7% a Financial Planner. Financial Planners are significantly out of favour in the light of recent bank disclosures and ASIC publicity on poor advice.

DFA-Sept-SMSF-2The proportion of SMSF in property was on average 34%.

DFA-Sept-SMSF-3
According to the fund level performance from APRA to June 2015, and DFA’s own research, Superannuation has become big business, with total assets now worth over $2 trillion (compare this with the $5.5 trillion in residential property in Australia), an increase of 9.9 % from last year.

Property Investors Are Still Optimists

Continuing our series on the latest findings from The Property Imperative, we look at property investors today. We find that they are seriously optimistic about the future of property (and recent capital gains have fueled their future expectations).

Looking first at what we call solo investors, about 987,000 households only hold investment property, 2.2% of which are held within superannuation. Households in this segment will often own one or two properties, but do not consider they are building an investment portfolio.

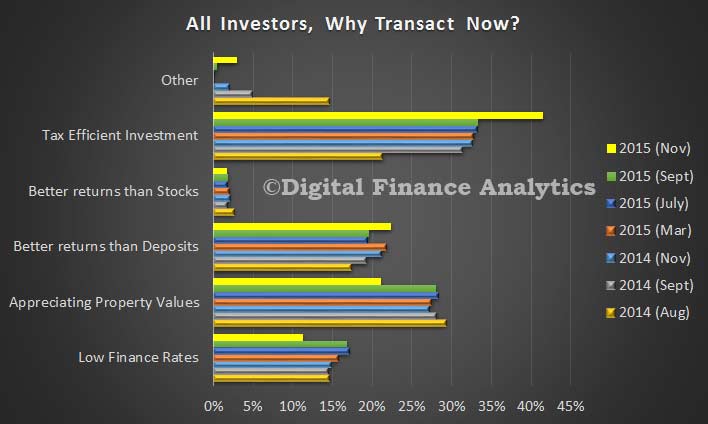
They are strongly driven by the tax efficient nature of property investment via negative gearing and capital gain concessions. They also have enjoyed low finance rates, strong capital appreciation, and better returns than from bank deposits.

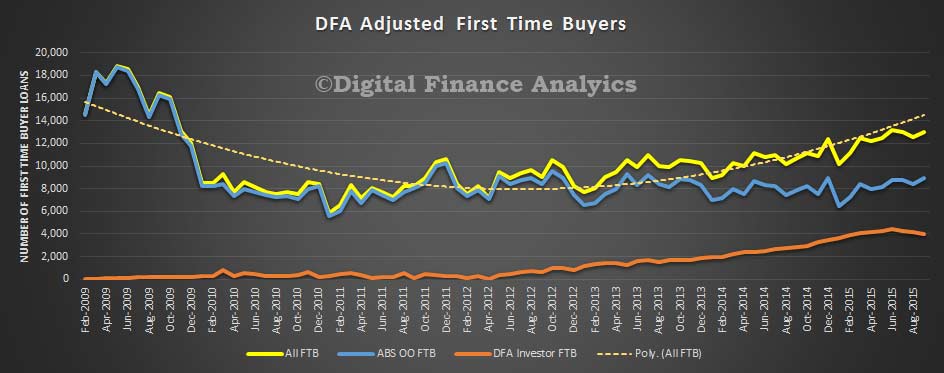
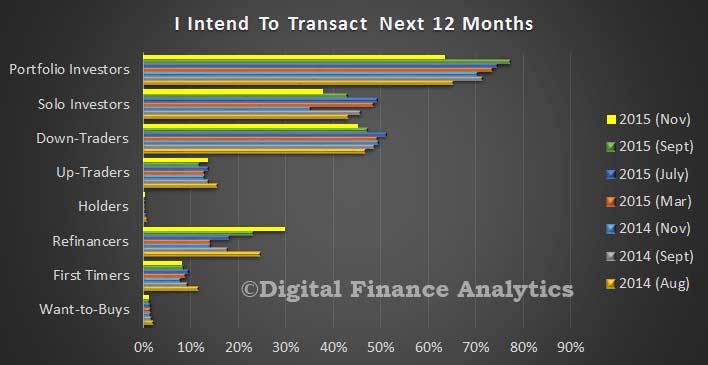
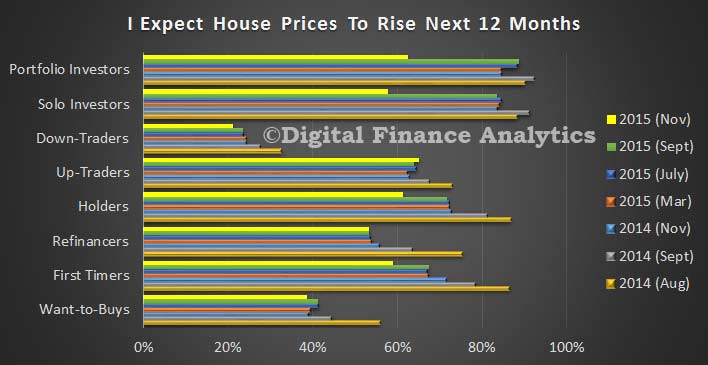
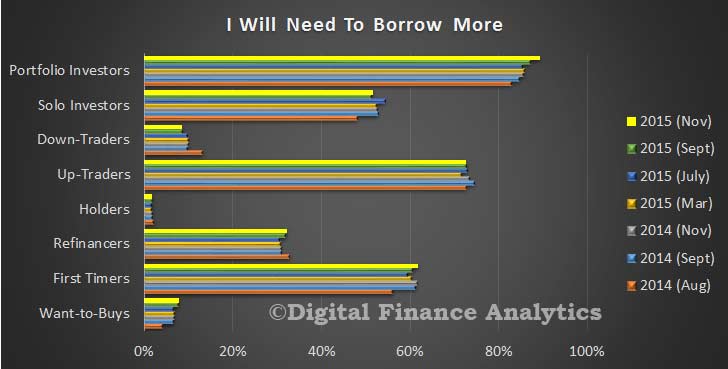
DFA-Sept-Solo-InvestorsAround 84% of households expect prices to rise in the next 12 months, 42% of households expect to transact within the next year, 51% will need to borrow more, and 39% will consider the use of a mortgage broker.

Turning to portfolio investors who are households who are portfolio investors maintain a basket of investment properties. There are 178,000 households in this group.We see somewhat similar motivations as discussed above, with tax efficiency being the strongest driver, followed by appreciating property values and good returns. We see a number of these households devoted to property investment as a full-time occupation.

DFA-Sept-Port-InvIndeed, the median number of properties held by these households is seven. Most households expect that house prices will rise in the next 12 months (88%), and 77% said they will transact in the next 12 months.

Many will borrow more to facilitate the transaction (85%), and 53% will use a mortgage broker. Significantly we now see about 21% of portfolio investors looking to their property investments as the main source of income, it has in effect become their full time job.

Next time we look at those investing via a self managed superannuation fund.

Does Trading Down Trump Trading Up?

As we continue to look over the results of the latest household surveys, as captured in the recently released Property Imperative report to September 2015, we look at households who are wanted to trade up and trade down. These are important segments of the market because they have reason to transact, and access to funding if they decide to trade. In fact they tend to underpin the market, and the balance between the two tell us something about demand and supply, and also which sectors are more likely to be on the up.

So looking first at those seeking to trade up, our survey identified about 1,077,000 households who are considering buying a larger property. Most (91%) are owner occupied. Of these households 12% are expecting to transact within the next 12 months, whilst 64% of households expect house prices to rise in this period.

DFA-Sept-UpTraders
The main reasons for these households to transact are as a property investment (40%), to obtain more space (33%), because of a job move (12%) and for a life-style change (12%). Many of these households will require further finance (72%) and a quarter will consider using a mortgage broker (22%), whilst 33% of these households are actively saving to facilitate a transaction. We note that prospective future capital gains rated most strongly, the view of property as an investment continues to drive behaviour. We also note that the majority of up-traders are seeking houses rather than apartments. Given the focus on owner occupied finance now, lenders and brokers would do well to consider their strategies to assist this market segment.

Turning to down-traders, more than 1.25 million households are considering selling and buying a smaller property. These households tend to be older, and with higher net worth. Of these 71% are considering an owner occupied property, and 29% an investment property. Of these 670,000 currently have no mortgage and own the property outright. Many will not need bank finance to transact. Some however may seek investment finance.

DFA-Sept-Down-Traders

Around 24% of these households expect house prices to rise over the next year, whilst 51% expect to transact within 12 months, 9% will consider using a mortgage broker and 9% will need to borrow more. Households will transact to facilitate increased convenience (30%), to release capital for retirement (28%), because of unemployment (7%) or because of illness or death of a spouse (9%).  Down traders tend to be seeking smaller more convenient property, are more likely to go for an apartment with good access to central facilities, such as shops and healthcare, and some may, as part of a wealth management strategy be seeking to release capital (as they have seen significant upside in recent times) and opt for an investment property (sometime with negative gearing).

But, if we put these two segments together, there are about 765,000 households looking to trade in the next year. Of these, nearly 80% are down traders. We think this will have an impact on the supply and demand footprint in the market, with smaller property being supported by the high number of down traders, and poor supply, whilst those with larger places, and wanting to sell may find a lack of buyers and a saturated market, so price differentials will moderate, with continue growth in the middle market, but more sluggish growth, or even a fall at the top end. This could well also distort prices in specific geographic areas.  In other words, down traders may have to give a little on the price they get to sell their current place, and pay more for their next property, because of the higher level of demand. Up-traders will find good supply of property if they choose to transact, and will be able to negotiate hard on price.

Next time we look at the investment sector.