Australia Becoming a Nation of Landlords – AFR

The AFR report cited research provided by DFA from our household surveys.

Australia is becoming a nation of landlords as record-high real estate prices force house-hunters into buying and renting investment properties rather than becoming owner-occupiers, analysis of purchases reveals.

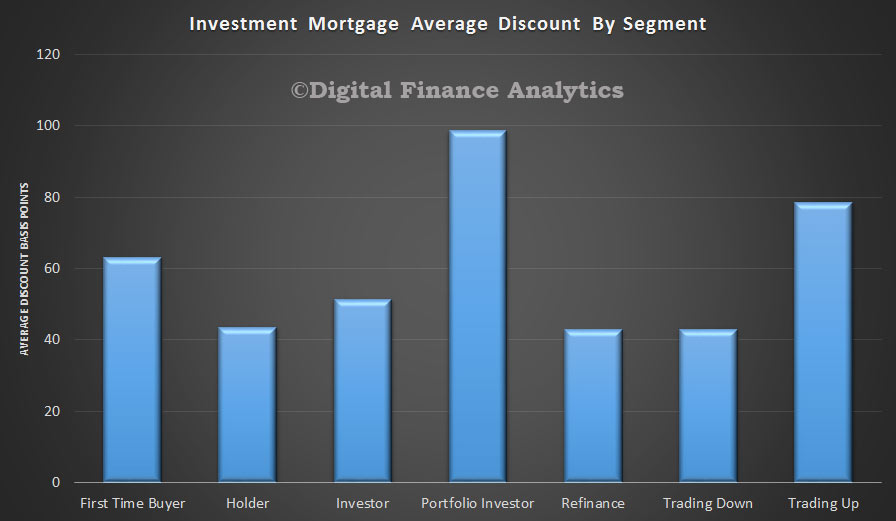
Property investors are also becoming younger and more likely to own several rental properties, with the number of investors with more than five properties having increased by 35 per cent in the past 12 months, from 175,000 to 272,000, according to research by Digital Financial Analytics.

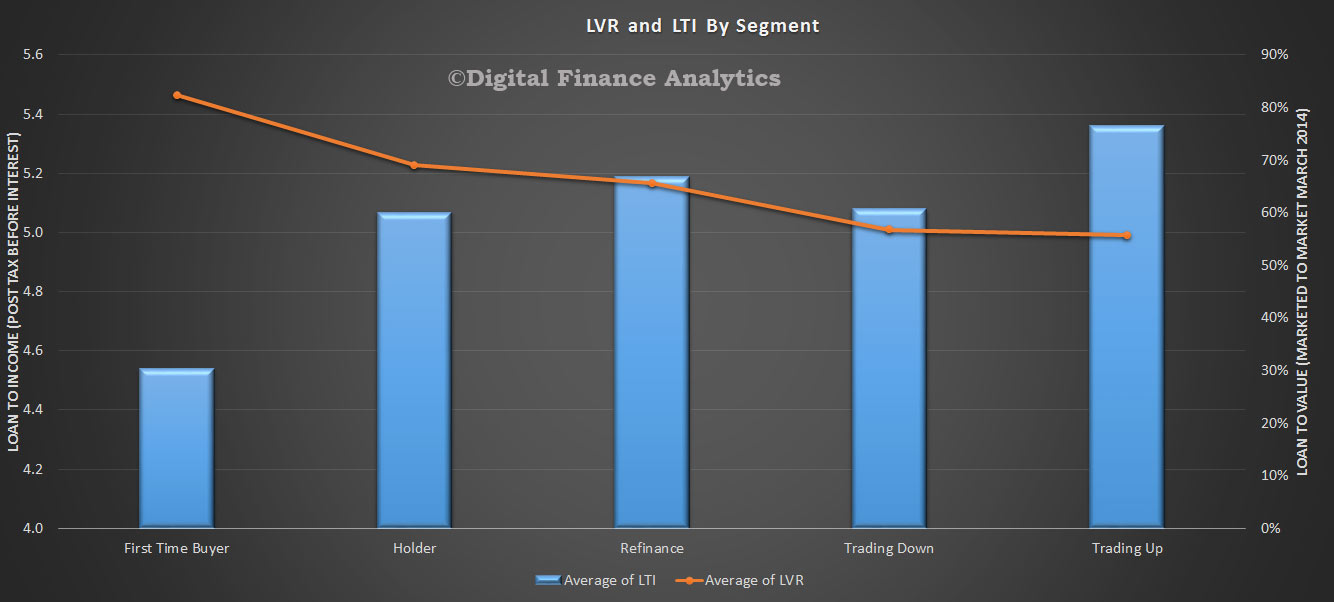
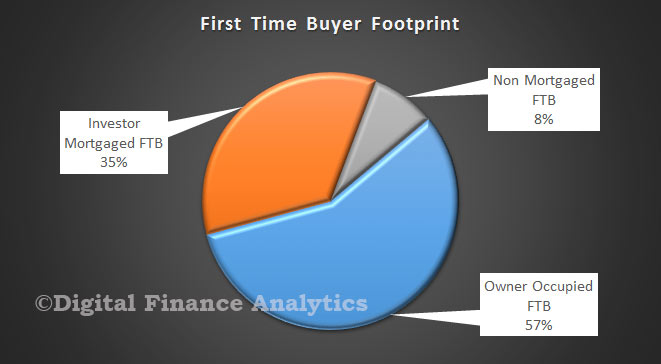
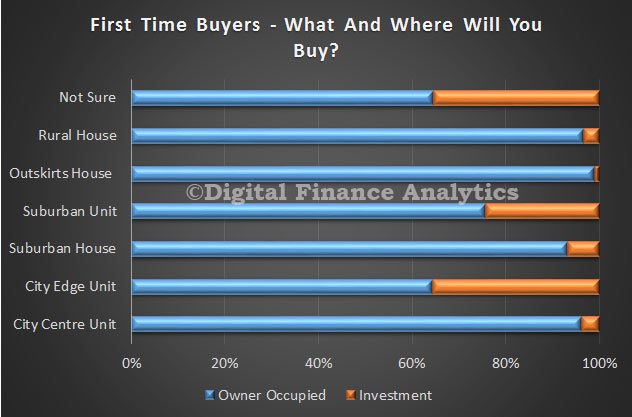
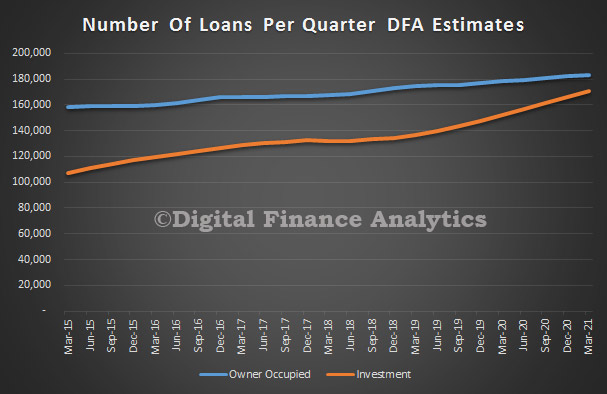
For the first time since records began, more first-time buyers are expected to be investors rather than owner-occupiers by the end of this year, heralding a major change in the nation’s home-owning culture, the research reveals.

The big increase in property investment is “a tower of dominoes”, said Martin North, principal of Digital Financial Analytics, a research firm that works for big banks and financial services companies.

“The question is whether fundamentals like a shortage of supply being soaked up by tenant demand will get us out of jail,” he said. “I think we probably have enough disequilibrium between supply and demand to support the market for the next couple of years.”

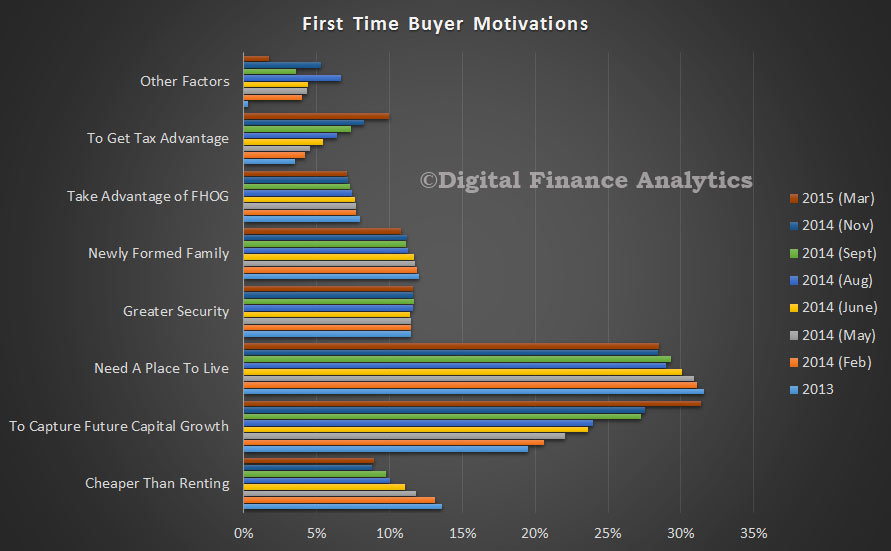
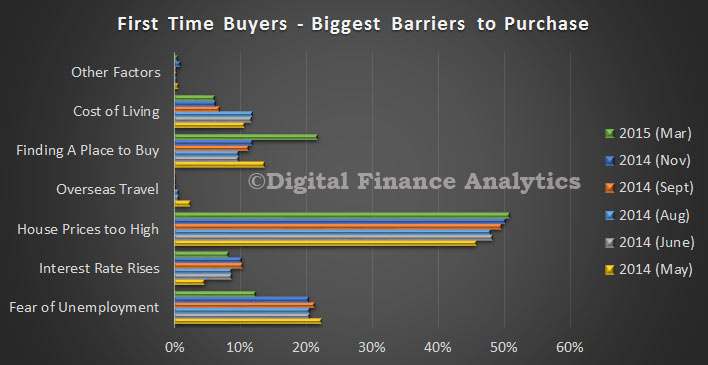
Mr North’s research highlights the number of first-time property buyers who rent the property and then remain at home with their parents or live in a communal arrangement with friends.

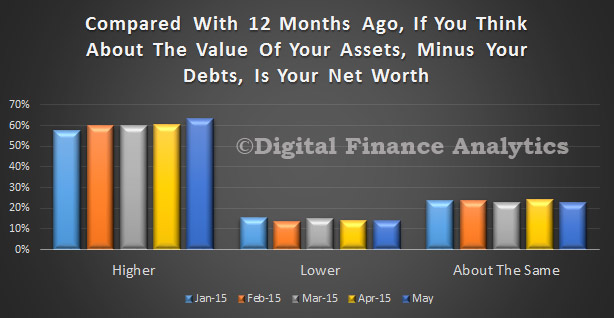
During the same period, the number of want-to-buys, first-time buyers, refinancers, up-traders and down-traders remained about the same.

The number of loans to first-time buyers fell in all states and territories except Tasmania during the March quarter, according to government statistics.

Loan spruiking widespread

Financial advisers are routinely being offered commissions of between 5 per cent and 10 per cent, or fees of $25,000, to encourage investors to take out limited-recourse loans to buy apartments.

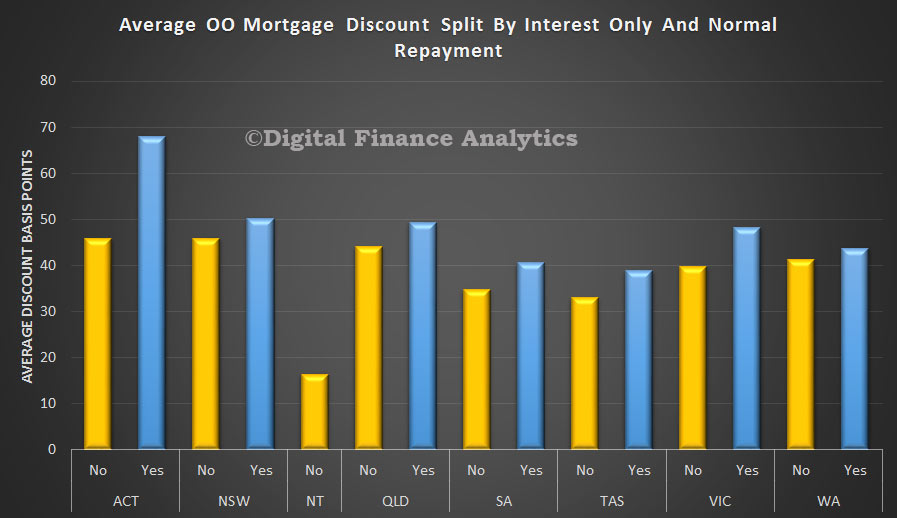
Alternatively, finance brokers, who often work with developers, have been encouraging the widespread use of non-bank interest-only loans using the equity in the investor’s home as security and borrowing about 20 per cent of the value of the investment property to cover the deposit and purchase.

Rental income from the investment property is expected to cover all costs and any capital growth is then leveraged to buy the next property.

Interest-only loans only require repayment of the interest on the loan over the rolling five-year borrowing term.

Mario Borg ​, a finance strategist at Melbourne-based Strategic Finance who owns 10 properties and estimates his worth at more than $10 million, disagrees that portfolio investors are exposed to excessive risk.

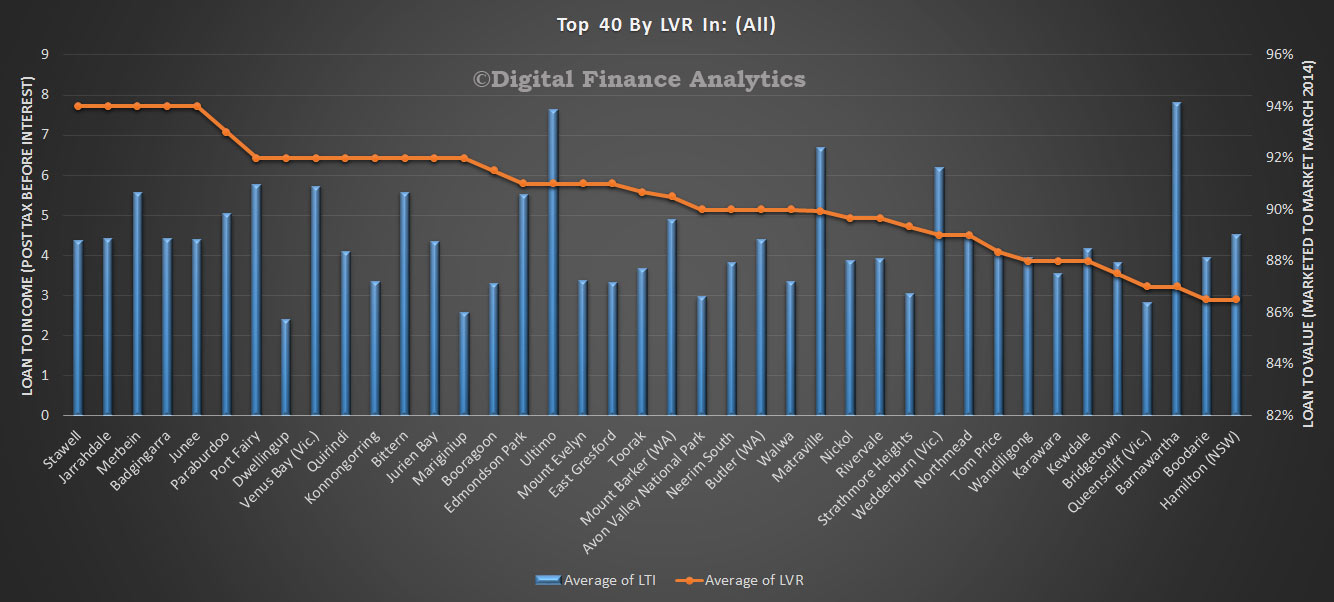
Borg believes attractive properties where people want to live will always find a tenant and is confident the right financing structures will protect portfolios from market corrections. He never allows the loan-to-value ratio to drift above 50 per cent of the portfolio’s value and maintains a credit limit of 80 per cent of the portfolio value to cover any unforseen events.

Christopher Foster-Ramsay, owner of Foster Ramsay Finance, says investors need to be aware of the risks, particularly if prices begin to fall.

“Many want to live the dream without understanding what they are potentially getting into,” he said.

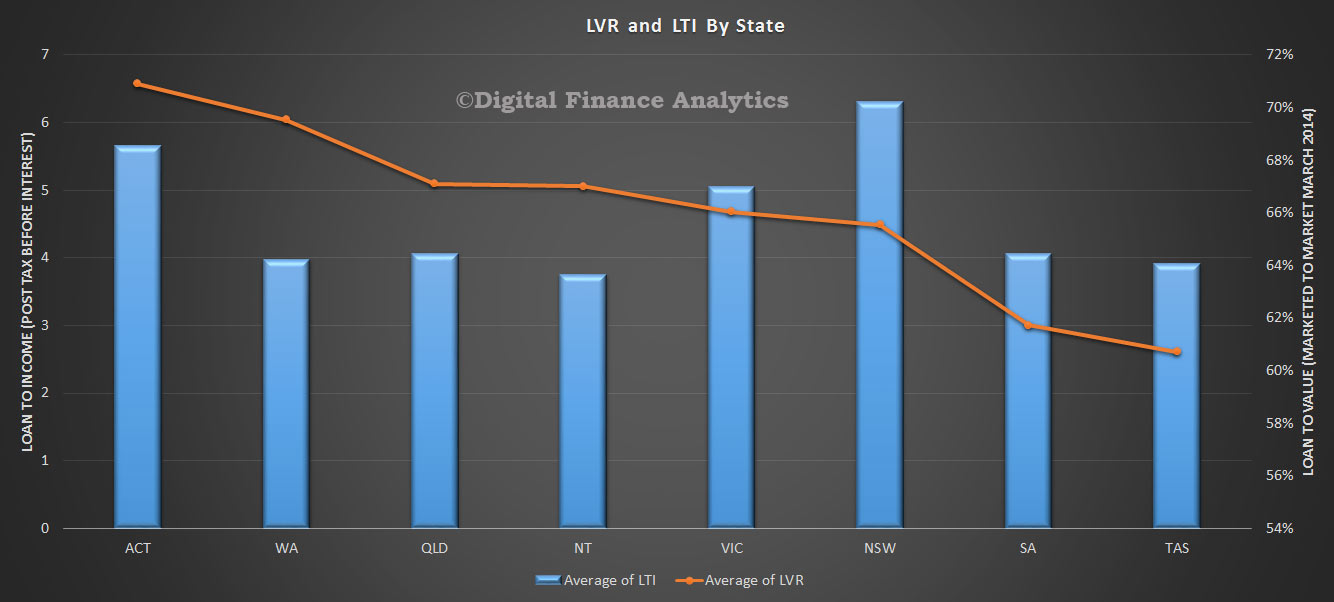
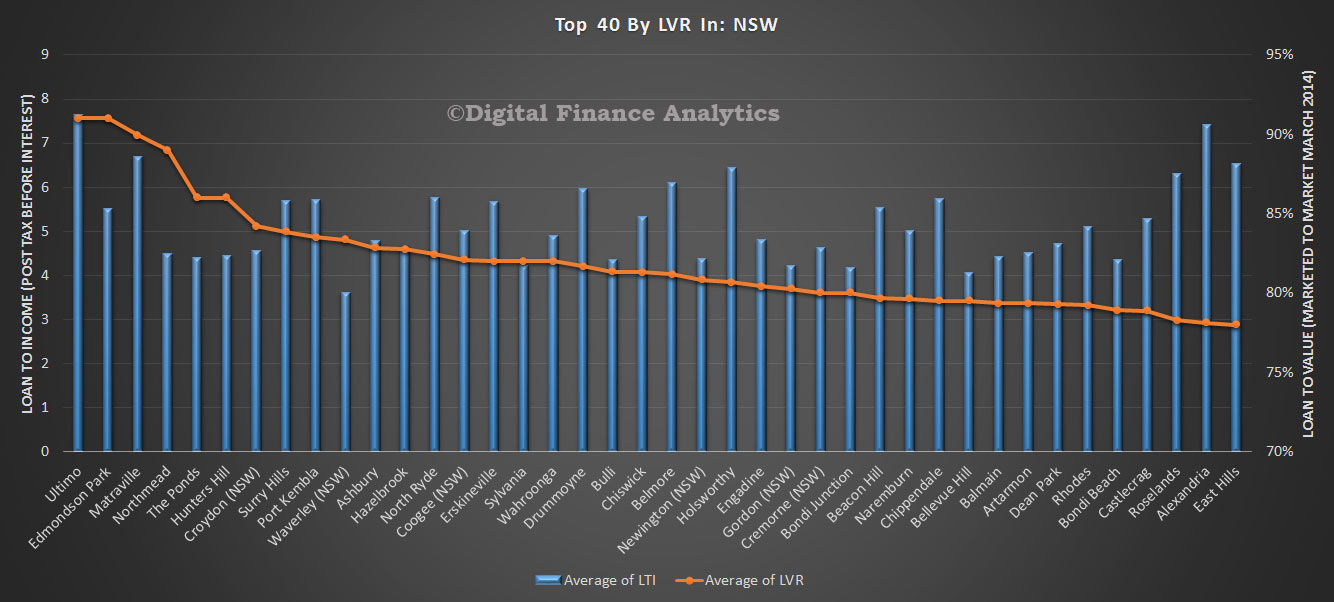
By any international standard, such as loan-to-income ratio or gross domestic product-to-house prices, the nation’s bill for house buying is about 30 per cent above the long-term trend.

DFA Household Finance Confidence Index Up A Bit In May

The latest edition of the DFA Household Finance Confidence Index was released today. The latest data to end May shows there was an improvement over the last month, partly in response to the budget and the RBA rate cut, but the overall score is still well below a neutral setting. The score moved from 91.87 to 94.6.

FCIIndexMay2015 The results are derived from our household surveys, averaged across Australia. We have 26,000 households in our sample at any one time. We include detailed questions covering various aspects of a household’s financial footprint. The index measures how households are feeling about their financial health.

To calculate the index we ask questions which cover a number of different dimensions. We start by asking households how confident they are feeling about their job security, whether their real income has risen or fallen in the past year, their view on their costs of living over the same period, whether they have increased their loans and other outstanding debts including credit cards and whether they are saving more than last year. Finally we ask about their overall change in net worth over the past 12 months – by net worth we mean net assets less outstanding debts.

Looking at the drivers of the index, for all Australia, we see that costs of living are rising, with 37.64% of households seeing a rise in the last 12 months (up from 37.2%), and more than half seeing no improvement in costs of living. Elements which are driving this include fuel costs, rising council charges and costs of imported goods.

FCICostsMay2015Turning to income 3.8% of households have seen a real increase in the last year, compared with 5.5% last month. 39.9% of households have experienced a fall, compared with 38.4% last month, and 55.5% of households stayed the same compared with 55.8% last month.

FCIIncomeMay2015Looking at household debt, 12.3% of households are comfortable with their debt levels, up from 11.4% last month. Households who are uncomfortable with their debt levels fell to 25.8% from 27.2% last month. The change was directly linked to the RBA Cash Rate cut in May, and an expectation that rates will fall further. Those with high credit card debts were significantly more likely to be is the less comfortable category. Those households with interest only mortgages were disproportionally more comfortable than those with a p&i loan.

FCIDebtMay2015Turning to savings, those who are more comfortable fell from 13.9% to 13.7%. We saw a rise in households who were less comfortable (from 30.4% to 30.9%) and more than half saw no change. One element of note was that households are tapping to their savings to fill the gap left by slow income growth, against costs and spending. Low deposit rates are encouraging some households to spend some of their savings.

FCISavingsMay2015On job security, there was a slight rise in those feeling more comfortable (from 16.2% to 16.8%). Interestingly those employment in small businesses saw a significantly larger positive swing, offset by lower levels of security in larger companies. The worst deterioration were in WA and QLD.

FCIJobsMay201563.1% of households saw their net worth rising, up from 60.5% last month, thanks primarily to further rises in real estate (especially in Sydney and Melbourne) and shares. A slightly smaller proportion of households saw their net worth falling (down from 14.2% to 13.86%), the majority of those households who reported a fall were not property active, living in rented accommodation, and more reliant on Centrelink support than average. We also note a skew to rises in net worth in the main urban centres on the east coast, and higher than average income. Households in WA scored the highest fall this month.

FCINetWorthMay2015So overall, we see the continuing trend of lower income, higher costs, those households with property and shares enjoying offsetting net worth growth, but others not participating to the same extent. The budget may have moved the dial a bit, but the RBA rate cut had more impact.

Note that this data is averaged across the states, though we note some significant differences between WA (overall confidence lower) and NSW (overall confidence higher), thanks mainly to differential movements in house prices and employment prospects. We do not published the detailed segment and state based analysis in this post. This detail is available to our paying clients!

Economic Well-Being of U.S. Households – Fed Survey

The Federal Reserve Board’s latest survey of the financial and economic conditions of American households released Wednesday finds that individuals’ overall perceptions of financial well-being improved modestly between 2013 and 2014 but their optimism about future financial prospects increased significantly.

The 2014 Survey of Household Economics and Decisionmaking, provides new insight into Americans’ economic security, housing and living arrangements, banking and credit access, education and student loan debt, savings behavior, and retirement preparedness. Sixty-five percent of adult respondents consider their families to be either “doing okay” or “living comfortably” financially–an increase of 3 percentage points from the 2013 survey.

Looking forward, households are increasingly optimistic. Twenty-nine percent of survey respondents say they expect their income to be higher in the year following the survey, compared to 21 percent of 2013 respondents.

The survey results reveal a lack of economic preparedness among many adults. Only 53 percent of respondents indicate that they could cover a hypothetical emergency expense costing $400 without selling something or borrowing money. Thirty-one percent of respondents report going without some form of medical care in the past year because they could not afford it.

The outlook for the housing market among surveyed homeowners remained generally positive, as 43 percent believe that their house increased in value over the past year and 39 percent expect home values in their neighborhood to rise in the coming year. Many renters also express an interest in buying but report financial barriers to homeownership, with half of all renters listing an inability to afford a down payment as a reason why they rent rather than own and 31 percent citing an inability to qualify for a mortgage as a reason for renting.

Twenty-three percent of the adult population has some form of education debt, according to the survey. However, this debt is not exclusively student loans. Fourteen percent of those with education debt say that some of that debt is on credit cards. Individuals who did not complete an associate or bachelor’s degree, first generation students, blacks and Hispanics, and those who attended for-profit institutions, are all disproportionately likely to be behind on repaying their student loan debt.

Recognizing the importance of degree completion to many outcomes, the survey explores why some individuals leave college without a degree. Family responsibilities is the most common reason, and was cited by 38 percent of all respondents who dropped out and by just less than half of women younger than 45.

The survey results also suggest that many individuals are not adequately prepared for retirement. Thirty-one percent of non-retirees have no retirement savings or pension, including nearly a quarter of those older than 45. Even among individuals who are saving, fewer than half of adults with self-directed retirement savings are mostly or very confident in their ability to make the right investment decisions when managing their retirement savings.

Consistent with a lack of preparedness for retirement, 38 percent of non-retired respondents say that they either do not plan to retire or plan to keep working as long as possible. Among lower-income respondents, whose household income is less than $40,000 per year, 55 percent plan to keep working as long as possible or never plan to retire.

The survey was conducted on behalf of the Board in October and November 2014. More than 5,800 respondents completed the survey. The report summarizing the survey’s key findings may be found at: http://www.federalreserve.gov/communitydev/shed.htm

Mortgage Discounts Still Running Hot

Latest data from the DFA household surveys highlights that many prospective borrowers are still able to grab significant discounts on new or refinanced home loans. The chart below shows the weighted average achieved across loans written, compared with the RBA cash rate. Despite the recent falls, discounting is still rampant.

MortgageDiscountRateMay2015However, we also see significant differences between players and across different customer segments and loan types. Not all households are getting the larger cuts. Discounts also varies by LVR and channel of origination, with those using a broker, on average, doing a little better.

MortgageDiscountsMay2015The deep discounting flowed through to some margin compression in the recent results from the banks, and falls in deposit margins, as they continue to attempt to grab a larger share of new business. Households with a mortgage of more than a couple of years duration would do well to check their rate against those currently on offer in the highly competitive market. Even after switching costs, they may do better.

We also updated our strategic demand model, and our trend estimates for mortgage numbers out to 2020. We expect to see investment loan growth containing to run faster than owner occupation loans. Over the medium term we expect the number of owner occupied loans to grow at an average of 2.8%, and investment loans at 7.8% per annum over this period.

DFAScenariosMay2015Behind the model we have made a number of assumptions about population growth, capital demands, house prices and economic variables, as well as the demand data from our surveys. Significantly, much of the demand is coming from those intending to trade down, buying a smaller place, AND a geared investment property. We will update the segment specific demand data in a later post.

DFA Household Finance Confidence Index Falls Again In April

The latest DFA Household Finance Confidence Index (FCI) to end April 2015, showed a further slight fall, from 91.97 in March to 91.87 in April, and continues to track below the long term neutral position.

FSI-Index-Apr2015The results are derived from our household surveys, averaged across Australia. We have 26,000 households in our sample at any one time. We include detailed questions covering various aspects of a household’s financial footprint. The index measures how households are feeling about their financial health.

To calculate the index we ask questions which cover a number of different dimensions. We start by asking households how confident they are feeling about their job security, whether their real income has risen or fallen in the past year, their view on their costs of living over the same period, whether they have increased their loans and other outstanding debts including credit cards and whether they are saving more than last year. Finally we ask about their overall change in net worth over the past 12 months – by net worth we mean net assets less outstanding debts.

Looking at the drivers of the index, for all Australia, we see that households are a little more confident about their employment status (+0.28%), but there was overall little change (63.2%). We noted a rotation in confidence towards NSW and away from WA, reflecting the impact of the mining boom coming off.

FSI-Jobs-Apr2015Looking at confidence with respect to savings, we find that whilst about half of the households scored about the same, there was a further deterioration in those more comfortable (-0.3%) and a rise in those less comfortable (+0.43%). The main factors which are driving this related to ever lower deposit interest rates, and the need to tap into savings as income growth stalls. Males tend to be more confident than Females.

FSI-Savings-Apr2015Turning to debt, we see that households are less comfortable about the the amount of debt they hold (-0.9%), this is explained by a growth in the absolute level of debt many households have, and concerns that cash flow is under pressure making it more difficult to repay on time. Lower interest rates have not translated into lower debt costs as many hold balances in credit cards where interest rates remain high.

FSI-Debt-Apr2015Turning to real income, some households have seen their incomes rise and were more comfortable (+1.5%), but in contrast more are also less comfortable, as their incomes were eroded in real terms (+1.4%), so as a result, the number who stayed the same fell by 2.2% to 55.8%. Those in part-time work tended to be less confident.

FSI-Income-Apr2015Households whose costs of living rose were up by 1.6% to 37.2%, driven by higher child care costs, garage repair bills, some foods and council rates. 57% of households saw no major change and 4% saw their cost fall, thanks to reductions in fuel costs and some foods. The falling AU$ also had some impact on the results.

FSI-CostsOfLiving-Apr2105Finally, we looked at net worth, 60% of households think their net worth has improved, thanks to higher house prices and paying forward on mortgage repayments, whilst 14% believe their net worth fell. Many of these households live in rented accommodation, and have substantial debts, and relatively few assets. Those not borrowing, but holding substantial savings balances were more likely to see their net worth reduced.

FSI-NetWorthApr2015This data is averaged across the states, though we note some significant differences between WA (overall confidence lower) and NSW (overall confidence higher), thanks mainly to differential movements in house prices and employment prospects.

Note, these results were collated before the last RBA interest rate cut, and the budget speech. We will examine the impact of these factors on households next month.

Latest Edition Of The Property Imperative Released Today

The Property Imperative, Fourth Edition, published April 2015 is available free on request. This report which summarises the key findings for our research into one easy to read publication. We continue to explore some of the factors in play in the Australian residential property market by looking at the activities of different household groups using our recent primary research, customer segmentation and other available data. Specifically we look at the property investment juggernaut and how we are becoming a nation of  property speculators. It contains:

  • results from the DFA Household Survey to end March 2015
  • a focus on first time buyer behaviour and overseas property investors
  • an update of the DFA Household Finance Confidence Index

PropertyImperativeLargeGo here to request a copy.

From the introduction:

This report is published twice each year, drawing data from our ongoing consumer surveys and blog. This edition dates from April 2015.

The Australian Residential Property market is valued at over $5.4 trillion and includes houses, semi-detached dwellings, townhouses, terrace houses, flats, units and apartments. In the past 10 years the total value has more than doubled. It is one of the most significant elements driving the economy, and as a result it is influenced by state and federal policy makers, the Reserve Bank, Banking Competition and Regulation and other factors. Residential Property is therefore in the cross-hairs of many players who wish to influence the economic fiscal and social outcomes of Australia. The Reserve Bank (RBA) has recently highlighted their concerns about potential excesses in the housing market is on their mind, when considering future interest rate cuts.

According to the Reserve Bank (RBA), as at February 2015, total housing loans were a record $1.43 trillion , with investment lending now at a record 34.4%, and representing more than half of all loans made last month. There were more than 5.2 million housing loans outstanding with an average balance of about $241,000. Approximately two-thirds of total loans were for owner-occupied housing, while one-third was for investment purposes. 36.9% of new loans issued were interest-only loans. This report will explore some of the factors in play in the Australian Residential Property market. We will begin by describing the current state of the market by looking at the activities of different household groups leveraging recent primary research and other available data. We also, in this edition, feature recent research into first time buyers and foreign investors; and look at household finance confidence.

DFA Household Finance Confidence Index Falls In March

We have released the latest edition of the DFA Household Finance Confidence Index, the results of are derived from our household surveys, averaged across Australia. We have 26,000 households in our sample at any one time. We include detailed questions covering various aspects of a household’s financial footprint. The index measures how households are feeling about their financial health.

To calculate the index we ask questions which cover a number of different dimensions. We start by asking households how confident they are feeling about their job security, whether their real income has risen or fallen in the past year, their view on their costs of living over the same period, whether they have increased their loans and other outstanding debts including credit cards and whether they are saving more than last year. Finally we ask about their overall change in net worth over the past 12 months – by net worth we mean net assets less outstanding debts.

The overall index fell from 92.1 to 91.97 in March, which continues the overall declining trend since February 2014.

FCIMar2015

Looking at the elements within the index, nearly 60 percent of households are enjoying a growth in their net worth, mainly thanks to further rises in house prices and positive stock market movements. On the other hand, there was a rise of 1.5 percent in those who have seen their net worth fall, these are households who predominately do not own property.

FCINetWorthMar2015

There were small movements in the costs of living data, with school fees and child care being two elements which have hit some households hard, though offset by falls in the costs of fuel. We also see the impact of falling exchange rates on overseas purchases, especially from the US. Finally, rentals are increasing faster than incomes for some households, especially in cities on the east coast.

FCICostsMar2015

Household real incomes are relatively static, though there is little evidence of rising income. Less than 4 percent of households recorded a rise in real terms.

FCIncomeMar2015

Some households are a little more comfortable with their level of debt, this is directly linked to the fall in RBA rates in February. However, there was also a rise in those households who were concerned about the debts they owed, with a rise of 0.57 percent. On average females were more concerned than males, and older households more worried than younger ones.

FCIDebtMar2015

There was a small rise in households who were more comfortable with their savings position, but more are less comfortable, and this is directly linked to the current low interest rates offered for deposits, and the prospect of even lower rates, and the quest for higher yield elsewhere looking ahead. Females were significantly more concerned than males.

FCISavingsMar2015

Finally, looking at job security, there was a significant rise in those households who are concerned, with a drop in those who felt more secure than last year by 1.7 percent and a rise in those who fell less secure. That said, more than 60 percent registered as about the same. We noted some state variations, with those in WA significantly more concerned than those in NSW.

FCIJobsMar2015 Note that the detailed state by state and segmented data is not publicly released. We will update the index again in a months time.


A Deep Dive Into Mortgage Discounts

We have been highlighting the battle for market share, and the varying discounts which are available to some. Today we deep dive into the world of discounts, drawing data from our market model. We conclude that households, on average, get better discounts which using  a broker, discounts for investment loans are more generous, and reconfirm that more affluent households get the best deals. We also see that competition and deep discounts are making many loans unprofitable to the banks who make them (taking fully absorbed costs into account). As such, the current deep discounts are unsustainable.

We start by looking at the average discounts in basis points individual loan providers are offering. Some are significantly more aggressive than others. We have hidden the real names of the lenders concerned. We see that there are more banks offering owner occupied loans than investment loans. The best average discount for an investment loan is from provider 9.

Invetsment-Loans-Discount-By-Provider

Some of the owner occupied providers are quite generous in their discounts, but generally investment loans get bigger discounts at the moment.

OO-Discounts-By-Provider

Looking at channel of origination, and year of inception of the loans, we see that consistently third party (broker) loans get bigger discounts, and that the discounts have been growing in recent years.  In the owner occupied sector, discounts for loans via the branch (first party) are slightly lower in 2015.

OO-Mortgage-Discount-By-Year-and-Channel-APr-2015

In the investment loan sector, we see a trend of growing discounts in recent years, with third party originated loans getting a better deal.

INvestment-Discounts-By-Year-and-Channel

Turning to the DFA property segments, in the investment loan category, we see that portfolio investors are getting the very best discounts, whilst first time buyers are not doing so well, but they are slightly ahead of holders, refinance and trading down households.

Investment-DIscount-By-Pry-Segment-Apr-2015

Looking at our master household segments, we see that the wealthy – professionals and young affluent get the best deals. Those with less bargaining power do not do so well.

Investment-Discounts-By-Segment-Apr-2015

This is true of both investment mortgages (above) and owner occupied mortgages below, though we see that in the latter case, the discounts are slightly less generous.

OO-Discounts-By-Segment-Apr-2015

We also see that interest only loans command a larger discount in some states, especially in ACT. Others are more line ball.

Investment-Discounts-Apr-2015

In comparison interest only owner occupied loans can consistently command a larger discount, than normal repayment loans, but as highlighted already these discounts are on average a little lower than in the investment sector.

OO-Discounts-Apr-2015So what is the profit impact of these discounts? DFA has calculated the relative profit of each loan and using an index we can display the relative profit contribution in cash terms. For owner occupied loans, up until 2013, most years were net profitable to the lenders. We note that this changed in 2014 and 2015 as discounts expanded, and competition increased. Overall in cash terms they are making a slight net loss on some loans written now.  This is partly explained by the one off costs of setting up a new loan, and initial broker commissions. As loans age, they on average become more profitable.

The investment loan profit footprint is very interesting, as here we see a consistent fall in the profit index since 2010, with the largest drops in 2014 and 2015. This is explained partly by the significant growth in volumes, and the deeper discounting. Again, older loans become more valuable. Most banks would calculate an amortised cost of origination, spread over a number of years, but we prefer a true cash view.

We conclude from this that recent loans for many providers (especially those less efficient) will be loosing money initially, and the portfolio will be supported by the older more profitable loans. We also think that discounts are unsustainable at current levels, and will see them come off over the next few months.

Top LVR and LTI Households By Post Code

We have now finished updating the DFA market model, to take account of the latest DFA survey data, and market data. So we can look across specific households, segments and locations. Specifically we have been looking at average loan to income (LTI – income after tax but before interest) and loan to value (LVR – current outstanding loan compared with marked to market property value. The data covers all outstanding loans, not just new loans. The results are fascinating. This analysis is focusing on owner occupied property, though we also have rich data on investment property, and we may come to this later. This should help to answer the question, recently posted to DFA, where are the highest LVR and LTI areas? The DFA model has more then 100 elements, so we are just pulling out a few relevant items for this post.

To start, we look at the state summaries. We see that the highest LVR (orange line) can be found in the ACT, whilst the highest LTI is in NSW. The former is explained by the concentration of low risk salaried public servants in Canberra, and high house prices relative to income in Sydney.

LVR-and-LTI-By-StateUsing the DFA property segmentation, we see that the highest LVRs on average sits with first time buyers and is above 80%, whilst those trading up have an average below 60%. On the other hand, LTIs are on average, more stretched for households other than first time buyers (as we will see later there are wide variations), whilst other segments have higher LTI, reflecting falling incomes and other factors, including loan draw-downs and recent refinancing.

LVR-and-LTI-By-SegmentsIf we then look across all the locations, we see LVR’s above 93% on average in places like Stawell (Horsham (west), VIC; Jarrahdale (Tangney), WA; Merbein (Vic Country (north), VIC; and Badgingarra (Kalgoorlie) WA. The highest LTI ratios are in Ultimo (Sydney) NSW; Barnawartha (Wangaratta (north East)), VIC; and Matraville (Sydney) NSW. The average LTI does vary significantly, from just over two time income to nearly eight times.

All-Australia-Top-LVR-and-LTIIf we then dive more deeply into NSW, the top LVR ratios are found in Ultimo, Edmondson Park, Matraville and Northmead. High LTI ratios are found in Ultimo, Alexandria, Holsworthy and Roselands. So from a potential risk perspective, Ultimo has the highest score attached to it at the moment in the state. There are many new buildings going up there of course, mostly high-rise apartments, coupled with high turnover and competition between owner occupiers and investors.

NSW-Top-LVRs-March-2015Finally, for today, we map the top LVR’s in Sydney. We see significant high LVR mortgages in the eastern suburbs, as well as the inner west, southern, north western and western areas. In this map we cut off data below 78% LVR.

NSW-LVRs-March-2015

Latest DFA Survey – First Time Buyers Motivations and Barriers

We continue our series using data from the latest DFA segmented household surveys. First time buyers are more than ever becoming property speculators. Whilst we have already quantified the number of first time buyers and first time investors in the market,

FTBFootprintMar2015 today we look at their underlying motivations. So, looking at these trends there are some striking observations. We see that the prospect of potential capital gains, is now the highest rated driver at 32%, whilst the desire for somewhere to live is  just 28%. We see the prospect of gaining tax advantage is growing, now up to 10%, whilst the advantage of a First Home Owner Grant (FHOG) is falling away as these grants become less accessible. Fewer buyers now expect to pay less than renting, whilst the prospect of greater security remains about the same.

FTBMotivationsMar2015The biggest barrier to purchase are clearly current prices. This translates into too higher mortgages, or too bigger savings requirements to get into the market. The bank of “Mum and Dad” remains a prime source of funding. Fear of unemployment has diminished, whilst the problem of finding a place to buy has increased (now 22%).  The impact of potential interest rates reduced slightly, in response to the RBA cut, and expectation of lower rates for longer. Many now assume rates will stay low for at least three years, and they plan on this basis.

FTBBarriersMar2015Looking at where they will buy, 20% of potential first time buyers are not sure where to purchase. Across all Australia a suburban home is still the most desired property type, but in Sydney, a unit is much more the expectation now, mostly on the urban fringe, or inner suburbs.

FirstTimeBuyersWhereMar2015If we look at the split between owner occupied and investor first time buyers, we see investors are predominately going after units, either on the edge of the City (inner suburbs – e.g. in Sydney Hurstville, Wolli Creek), or suburban units.

FirstTimeBuyersTypeMar2015So putting this together, we conclude that first time buyers are reacting to the current house price boom in logical ways. They are however being infected by the notion that property is about wealth building, rather than somewhere to live. This notion, which served previous generations quite well (once they were on the property escalator), may be tested if interest rates rise later, or property prices fall from their current illogical stratospheric levels. The overriding result from the survey is the first time buyers are very fearful of missing out, and that delaying potential entry into the market will simply make it less affordable later.  This is why we expect to see a continued rise in the number of first time investor buyers.