The ostensible purpose of the 2015 Intergenerational Report is to ensure Australia’s future prosperity in the face of demographic ageing over the next 40 years. Its real purpose is different.
The Coalition won the 2013 election as the party of economic management, a party that would balance the books after years of Labor profligacy, hence the 2014-15 budget cuts. The report uses the alleged ageing crisis to legitimate these budget cuts, as well as a high rate of immigration-fuelled population growth.
Thus it focuses on the costs of ageing. But our new research shows it makes three claims which are overstated to the point of being deliberately misleading. This is important as the IGR is being used as a basis for far-reaching policy decisions.
First, on page 1, the IGR says labour force participation will fall because the number of people aged 15-64 for every person 65 plus will drop from 4.5 today to just 2.7 in 2055. This fall will reduce per capita economic growth.
Second, the cost of providing health care, pensions and aged care for an older population will balloon.
Third, because migrants tend to be young, Australia must maintain high immigration. The authors project annual net overseas migration (NOM) of 215,000 from 2018-19 to 2054-55. This is a large number; from 1990-91 to 2005-06 the annual average was 95,000.
Together with natural increase, it will inflate the population from 23.8 million today to 39.7 million, an increase of 15.9 million, or 66.8%.
Claim 1: ageing and Australians’ future prosperity
Per capita economic growth is the product of the population, participation and productivity. The report’s calculations of their respective contribution are set out in in Figure 1. The main driver is productivity, projected to contribute 1.5 percentage points each year.
Source: ABS cat. no. 5206.0, 6202.0 and Treasury projections
The chart shows a slight fall in per capita economic growth from declining labour force participation of 0.1 percentage points a year. This is a big surprise. Despite the up-front assertion about ageing’s negative impact on participation, the effect turns out to be minimal.
An even bigger surprise is that the chart shows a 0.1 percentage point annual increase in per capita economic growth from population. This is because the proportion who are children will fall relative to all those aged 15 plus.
This positive effect is astonishing. Treasury’s own modelling shows that the ‘population’ effect cancels out the small labour-force participation effect.
Claim 2: budget costs
The report projects a substantial increase in health expenditure. But most of this is due to rising costs in providing health care for everyone. The online chart data for chart 2.11 makes this clear; only 16% of the projected increase is due to ageing.
Scares about pension costs and aged-care funding are similarly exaggerated. Pension payments currently equal 2.9% of GDP. Depending on policies, this percentage may fall to 2.7 by 2054-55 or rise to 3.6 (p. 69). And government expenditure on aged care may rise from 0.9% of GDP in 2014-15 to just 1.7% in 2054-55 (p. 71).
These two sets of figures are hardly startling. Indeed Australia spends a much lower proportion of GDP on age pensions than most OECD countries; in 2007 the OECD average was 7% of GDP.
Claim 3: the economic gains from high net migration
The report asserts that high migration results in a younger population than would be the case without it (p. 11). To bolster this claim it presents an arresting bar chart.
Source: ABS cat. no. 3101.0 and 3412.0.
But oddly the authors don’t quantify the difference and its long-term effects.
To fill this gap we used two ABS projections (with slightly different assumptions to those of the report) and estimated the difference that a NOM of 200,000 p.a. makes to the median age in 2055. We found that it produces a median age of 41.4. By comparison, no net migration over the next 40 years results in a median age of 46.1.
(The two projection series used here are series 38 (NOM 200,000 p.a, TFR 2.0, high life expectancy) and series 56 (Nom 0, TFR 2.0, high life expectancy). See data published online with Population Projections, Australia, 2012.
This minor “younging” effect is assumed to increase participation (page 20). But our research (p. 6) shows the report’s own data shows that this has a negligible impact on per capita economic growth. For example, an extra 70,000 net migrants per year until 2055 adds four million people but only increases per capita economic growth by 0.06%.
But the report’s goal is an extra 15.9 million, not four million. What about the infrastructure costs? Here it makes the bizarre claim that infrastructure costs “are not linked explicitly to demographic factors” (page 57).
Two hidden agendas
Demographic ageing does not impose heavy costs. Rather, the phony scare campaign has been used to justify the Coalition’s budget cuts, while the high NOM assumptions help justify its current immigration policy.
The government is desperate to find a short-term solution to the problem of lower economic activity post the resources boom. Population growth boosts the housing and city-building industries and this may help, not with per capita economic growth but with aggregate economic growth.
The latter is the key driver of tax revenue and, in the case of business, of growth in sales. The report does not say much about it, except to provide the results of its modelling. Here aggregate GDP is projected to grow by 2.8% per annum to 2054-55. (Page 27.) The IGR’s data shows that, while gains in productivity will make a substantial contribution to this, crude population growth accounts for nearly half.
Why worry?
The IGR does devote a few pages (See page 38) to the environmental implications of its population growth, conceding that careful management will be required. But it finds no serious costs for the Commonwealth as the “level of Commonwealth Government spending on the environment is not directly linked with demographic factors” (page 40).
So Treasury is off the hook. But all Australians will suffer from the impact of massive population growth on the environment and the alienation of agricultural land. (See contributions from Rhondda Dickson, Michael Jeffrey and Gary Jones in Sustainable Futures: Linking population, resources and the environment].
The other pressing concern for voters is jobs and the economy. What are the newly arrived migrants going to do, apart from build houses for each other?
The supposed economic ill-effects of ageing are trivial. They should be easily managed by future generations themselves, provided they are not overwhelmed by the costs of bloated cities and environmental decay.
Authors: Katharine Bett, Adjunct Associate Professor of Sociology at Swinburne University of Technology; Bob Birrel, Researcher, Centre for Population and Urban Research at Monash University
The NZ Reserve Bank today reduced the Official Cash Rate (OCR) by 25 basis points to 3.0 percent.
Global economic growth remains moderate, with only a gradual pickup in activity forecast. Recent developments in China and Europe led to heightened uncertainty and increased financial market volatility. Particular uncertainty remains around the impact of the expected tightening in US monetary policy.
New Zealand’s economy is currently growing at an annual rate of around 2.5 percent, supported by low interest rates, construction activity, and high net immigration. However, the growth outlook is now softer than at the time of the June Statement. Rebuild activity in Canterbury appears to have peaked, and the world price for New Zealand’s dairy exports has fallen sharply.
Headline inflation is currently below the Bank’s 1 to 3 percent target range, due largely to previous strength in the New Zealand dollar and a large decline in world oil prices. Annual CPI inflation is expected to be close to the midpoint of the range in early 2016, due to recent exchange rate depreciation and as the decline in oil prices drops out of the annual figure. A key uncertainty is how quickly the exchange rate pass-through will occur.
House prices in Auckland continue to increase rapidly, but, outside Auckland, house price inflation generally remains low. Increased building activity is underway in the Auckland region, but it will take some time for the imbalances in the housing market to be corrected.
The New Zealand dollar has declined significantly since April and, along with lower interest rates, has led to an easing in monetary conditions. While the currency depreciation will provide support to the export and import competing sectors, further depreciation is necessary given the weakness in export commodity prices.
A reduction in the OCR is warranted by the softening in the economic outlook and low inflation. At this point, some further easing seems likely.
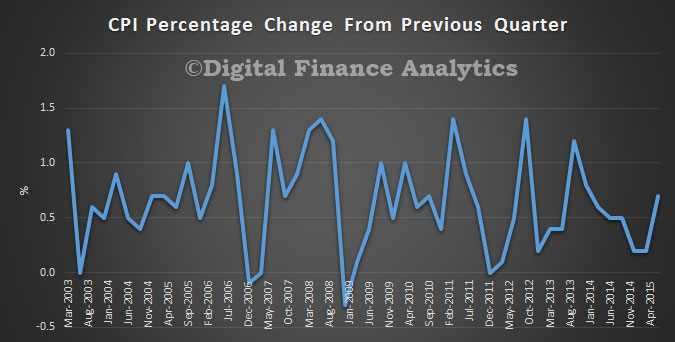
The ABS released the latest CPI data. The Consumer Price Index (CPI) rose 0.7 per cent in the June quarter 2015, following a rise of 0.2 per cent in the March quarter 2015.
This translates to an annual CPI of 1.5 per cent through the year to the June quarter 2015, following a rise of 1.3 per cent through the year to the March quarter 2015.
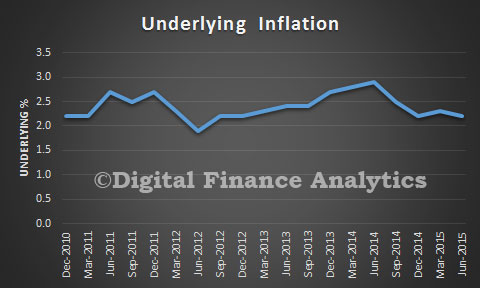
Underlying inflation is still in the 2-3% RBA target range, so there would be no impact of potential cash rate movements.
The most significant price rises this quarter were in automotive fuel (+12.2 per cent), medical and hospital services (+4.5 per cent) and new dwelling purchase by owner–occupiers (+1.5 per cent), These rises were partially offset by falls in domestic holiday travel and accommodation (–5.4 per cent) and pharmaceutical products (–1.8 per cent). The increase in fuel is registered in four of the five fuel types with the quarterly rise the largest since December 1990.
Even before the government’s options paper on tax reform is released later this year, many reforms have been taken off the table, at least before the next election. Here’s the expert view on six.
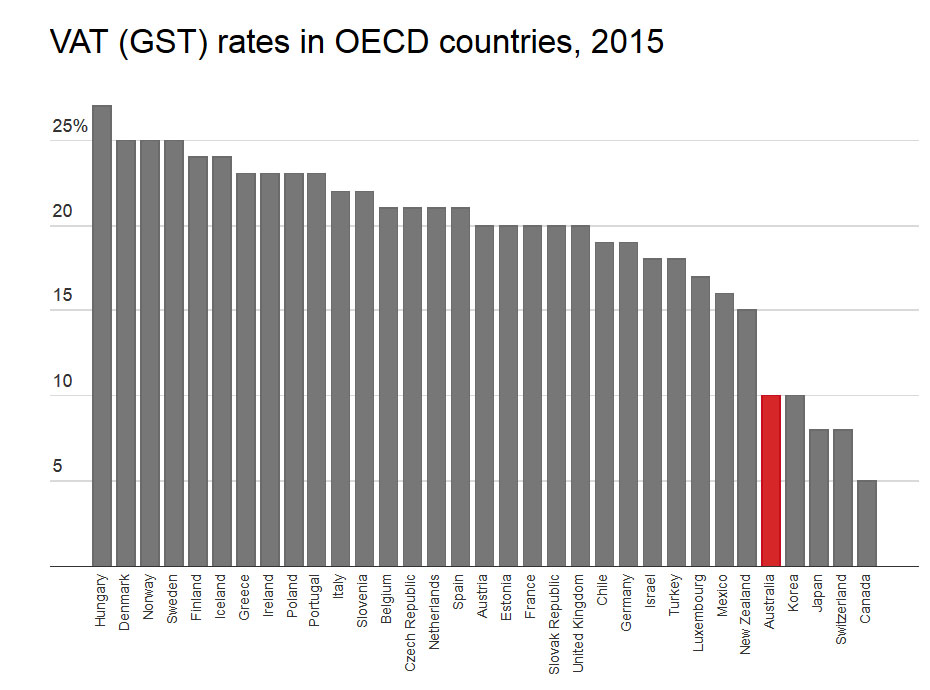
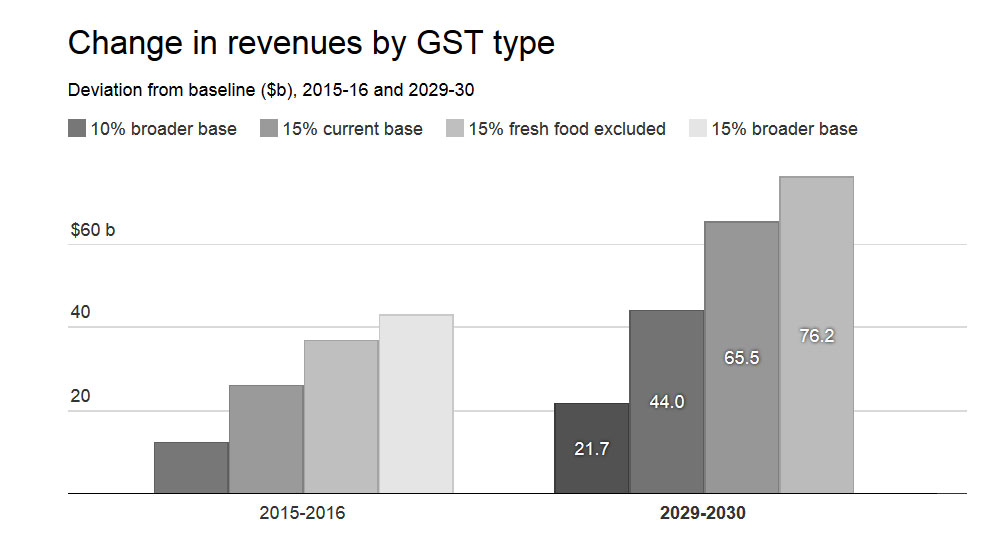
Broadening or increasing the GST
Some experts say expanding the GST, which is a regressive tax, would unfairly hit middle-income earners and women. Others say a broader base, not higher rate, would be the best approach.
If done as part of a package of tax reforms, John Freebairn argues increasing the GST could actually boost our standard of living.
Fixing the asymmetry between negative gearing and capital gains tax
As Helen Hodgson has explained, negative gearing would be less attractive if the capital gain on the sale of an investment was taxed in full.
The Henry Review recommended reducing the benefit of negative gearing by allowing only a 40% capital gains discount, but this was rejected by then Prime Minister Kevin Rudd.
Antony Ting says negative gearing is not a fair tax policy – particularly when considering the way investment properties are treated.
Dale Boccabella says the best solution would be to quarantine negative gearing so that losses on investment properties couldn’t be used as deductions against other income. But he also thinks abolishing it is preferable.
Prime Minister Tony Abbott has ruled out any changes to negative gearing, arguing to do so would be akin to increasing taxes.
Adopting global measures to prevent tax avoidance by multinationals
When Australia hosted the G20 leaders summit in November last year, it agreed to a number of actions to ensure fairness in the international tax system. The OECD is leading global reforms, arguing unilateral action could harm the global agreement that is required to stop multinationals shifting profits to reduce their tax burden.
Since then, Treasurer Joe Hockey has announced new measures specifically designed to target multinationals using complex schemes to escape paying tax. Experts say the measures lack teeth since they only apply to foreign and not Australian multinationals.
The next set of OECD-led measures to address global tax avoidance are due to be released at this year’s G20 summit in Turkey. The OECD recommendations will be finalised by December.
Taxing trusts as if they were companies
In 1999 the Ralph Review of Business Taxation recommended that trusts be taxed as companies, a move that originally got the support of Treasurer Peter Costello. Political pressure soon saw the government back away from this plan, and despite Joe Hockey showing support for the idea back in 2011, it is not one that has the support of the government.
Dale Boccabella says the taxing of trusts is another anomaly in Australia’s tax system that is unfair. Trusts are commonly used by families with a high income to distribute funds to low-earning family members in order to minimise tax.
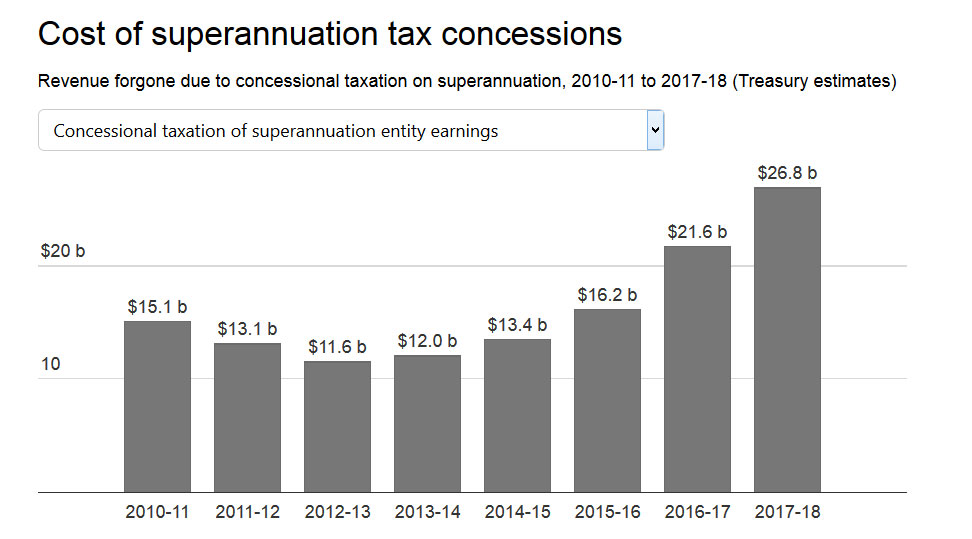
Removing concessions on the taxation of super
Most experts agree superannuation tax concessions are unevenly distributed and are in need of reform.
The Labor Party wants to remove the tax-free concession available to people with annual superannuation incomes from earnings of more than A$75,000, a move it says would raise more than $14 billion over 10 years.
Prime Minister Tony Abbott has ruled out any “adverse changes” to superannuation, including changes to super tax concessions.
Expanding land tax over stamp duty
The Henry tax review argued stamp duties are a highly inefficient tax on land, and that land tax could provide an alternative and more stable source of revenue for the states.
Miranda Stewart says stamp duty is volatile, feeds into house prices (contributing to lack of affordability) and taxes more heavily those people who purchase new housing more often, than those people who don’t.
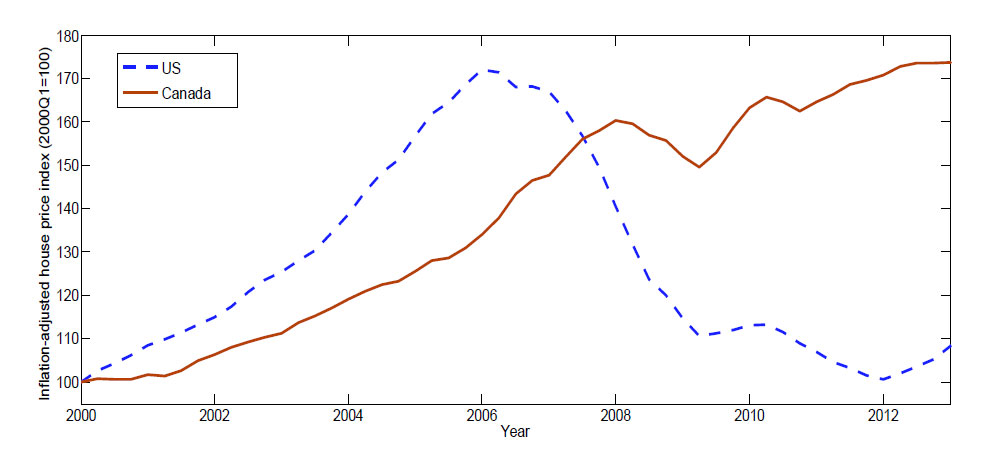
Just released is a Canadian Economic Analysis Department working paper “On the Welfare Cost of Rare Housing Disasters“, which shows that in a significant housing downturn the welfare costs are large and this risk varies considerably across age groups, with a welfare cost as high as 10 percent of annual nonhousing consumption for the old, but near zero for the young. Given the risks to the housing sector in Australia at the moment, this is potentially important and applicable research.
Since the early 2000s, house prices have increased significantly in Canada.This ongoing housing boom has become an important consideration for the conduct of monetary policy and financial regulation, since currently high levels of house prices are potentially increasing the risk of a large housing market correction, which could have an adverse effect on the economy. This paper investigates the likelihood and magnitude of housing market disasters, and the value of limiting this disaster risk for the Canadian economy.
The study will be useful for both economic researchers and policy-makers to better understand the macroeconomic implications of this important market risk. This paper estimates the unconditional probability and the size of housing market disasters using the cross-country housing market experiences of twenty OECD countries.
I find that in a given OECD country, housing market disasters – defined as cumulative peak-to-trough declines in real house prices of 20 percent or more – occur with a probability of 3 percent every year, corresponding to about one disaster occurring every 34 years. A housing disaster on average lasts about 6.4 years, and house price declines range from 25 to 68 percent, with an average decline of 34 percent.
This paper quantifies the welfare impact of the housing disaster risk in an overlapping generations general equilibrium housing model. The analysis yields the following two main findings. First, despite their statistical rarity, the aggregate welfare cost of housing disasters is large, since Canadian households would willingly give up around 5 percent of their non-housing consumption each year to eliminate the housing disaster risk. The sizable welfare cost is due to the large wealth loss during the long-lasting recessions triggered by housing disasters. Second, the welfare evaluation of this risk varies considerably across age groups, with a welfare cost as high as 10 percent of annual nonhousing consumption for the old, but near zero for the young. This asymmetry stems from the fact that, compared to the old, younger households suffer less from house price declines in disaster periods, due to smaller holdings of housing assets, and benefit from being able to buy homes at the resulting lower house prices in normal periods.
The main findings from the model are twofold. First, despite their rarity, the aggregate welfare cost of housing disasters is large, since Canadian households would be willing to give up around 5 percent of their non-housing consumption each year to eliminate the housing disaster risk. Compared to the no-disaster economy, the presence of this disaster risk has two opposite welfare effects on households. On the one hand, due to a wealth effect, a realized housing disaster leads to a long-lasting economic recession. The loss in housing wealth once a disaster occurs reduces the aggregate household savings and thus the capital supply. As a consequence, the interest rate goes up and the fi rm cuts back its investment, leading to declines in wages, output and consumption. On the other hand, due to a substitution effect, a non-trivial disaster probability results in risk-averse householdsresource reallocation from the housing sector to the production sector in normal periods. This lowers both house prices and the interest rate, with declining borrowing costs leading to higher investment, output and consumption. However, due to diminishing marginal utility of consumption, the welfare gain from this resource reallocation in normal periods is dominated by the welfare loss from large recessions triggered by housing disasters, explaining why the society is willing to devote a sizable amount of resources to eliminating this disaster risk.
The second major finding is that the welfare evaluation of the housing disaster risk differs considerably in magnitude across age groups, with a welfare cost as high as 10 percent of annual non-housing consumption for the old, but near zero for the young. This asymmetry is mainly due to the hump-shaped pro le of life-cycle housing consumption, with older households typically holding more housing assets than the young. In disaster periods, declines in house prices favor the young, who purchase houses at depressed prices, but hurt the old, who rely on house sales to finance non-housing consumption. In normal periods, younger households also benefit more than the old from purchasing houses at lower cost, thanks to the resource reallocation from the housing sector to the production sector as discussed above. Therefore, younger households are less averse to the presence of the housing disaster risk than the old.
Note: Bank of Canada working papers are theoretical or empirical works-in-progress on subjects in economics and finance. The views expressed in this paper are those of the author. No responsibility for them should be attributed to the Bank of Canada.
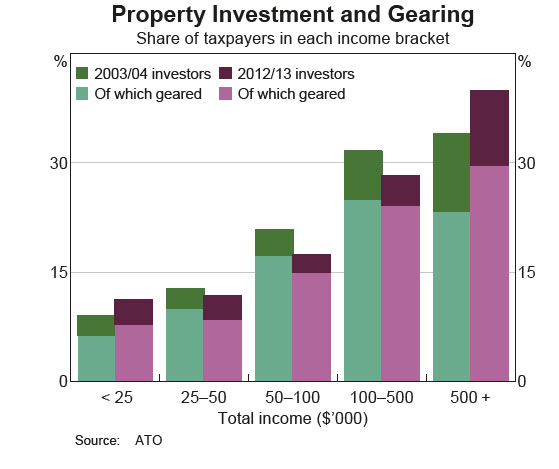
In the RBA’s submission to the Inquiry on Home Ownership, they argue that negative gearing for investment property should be reviewed, because it has the potential to raise risks in the market, lift prices and distort the market.
Housing, particularly owner-‐occupied housing, receives preferential taxation treatment in many countries, and Australia is no exception. Australia’s taxation system is also relatively generous to small investors in buy-‐to-‐let property compared with some other countries, because investors can deduct losses from their investments against wage income as well as other property income, and because capital gains are taxed at concessional rates. However, there are some other countries where the tax preference for investor property is even stronger than in Australia.
Geared investment increases with age and income, though we should be cautious, as the ATO data is of course income for tax purposes, post offsets.
The Bank believes that there is a case for reviewing negative gearing, but not in isolation. Its interaction with other aspects of the tax system should be taken into account. The ability to deduct legitimate expenses incurred in the course of earning income is an important principle in Australia’s taxation system, and interest payments are no exception to this. To the extent that negative gearing induces landlords to accept a lower rental yield than otherwise (at least while continued capital gains are expected), it may be helpful for housing affordability for tenants. It is worth noting, however, that the interaction of negative gearing with other parts of the taxation system may have the effect of encouraging leveraged investment in property.
Interesting given the UK budget announcement last week to reduce negative gearing there, for the same reasons. So, is economic logic and political positioning pulling in two different directions? The evidence that removal of negative gearing would drive rents up is shaky at best, and the weight of argument is definitely for reform.
It is widely accepted that the Greek bailout and austerity package has led to wealth flowing from Greece to its European creditors, benefiting foreign banks at the expense of Greeks, that its debt is unprecedented and unsustainable, that its recession is the unprecedented result of reforms that cannot succeed, and that Greece’s exit from the Eurozone would be calamitous.
Amazingly, none of the statements above are strictly true, leading much of the public discussion of Greece to be unusually detached from the facts.
In this article, I outline my reasons for no longer believing these claims – which I had been led to believe were true when I began to try to understand the Greek debt crisis. This is not meant as a comprehensive guide: I do not presume to make policy recommendations, but do hope that it will help readers better understand some of the issues at stake.
1. The bailouts have extracted resources from Greece
A common belief in discussions of the Greek economy is that the eurozone “has become an extractive project that imposes austerity on poor nations in order to collect debts on behalf of rich ones”. A recent study of capital flows to and from Greece by economists Jeremy Bulow and Kenneth Rogoff debunks this. As the tables below show, capital flows into Greece have not just remained positive, but have increased since the first bailout in 2010. 2014’s flow is slightly negative, partly as the Greek government chose to miss reform targets, preventing release of bailout funds.
2. Bailouts benefit foreign banks more than Greeks
Another misconception is that: “It is not the people of Greece who have benefited from bailout loans … but the European and Greek banks which recklessly lent money to the Greek State.” This was the charge of the Jubilee Debt Campaign, which campaigns for further debt relief for Greece. They report that €252 billion has been lent to Greece by the “Troika” (the EU, the European Central Bank and the IMF) since 2010, which they claim has been used as follows:
€35 billion in “sweeteners” to get the private sector to accept the 2012 debt restructuring
€48 billion to bail out Greek banks following the restructuring
€149 billion on paying the original debts and interest.
These add up to €232 billion, causing Jubilee to conclude that “less than 10% of the money has reached the people of Greece”.
This conclusion incorrectly assumes that none of the recipients of the €232 billion are “people of Greece”. But if the “sweeteners” were for the Greek private sector, they benefited Greeks; bailing out Greek banks directly helps Greeks who have bank deposits, who hold shares in banks (whether directly or via their pensions), and who work for banks.
The best data that I’ve seen suggests that Greek banks may have held just under half the Greek government debt before the 2012 restructuring – twice as much as any other country. Thus, payments to creditors also reached Greeks. Finally, even payments to foreign creditors benefit Greeks by removing obligations from Greeks to pay.
Perhaps the most amazing estimate to come from Bulow and Rogoff’s study is that Greek citizens have “withdrawn over a hundred billion euros from the banking system” since 2010: where has that money gone?
3. A debt-to-GDP ratio of 180% is unsustainable
Japanese prime minister, Shinzo Abe, has said he will work with the G7 and other Asian countries to ensure economic and financial market stability as the eurozone grapples with Greece’s debt crisis. This news is unremarkable and unsurprising: the third-largest economy in the world is standing by to help. Unreported is that Japan has the world’s highest debt-to-GDP ratio, at about 240% – much higher than Greece’s.
Furthermore, Japan does not seem to have any easy measures for quickly reducing this: unemployment is already low, leaving little slack in the labour market. And, as one of the world’s least corrupt countries, its unofficial sector is small, leaving little hope that actual GDP is much higher than official GDP. Japan faces serious economic challenges (including two decades almost without growth), but no one sees it as other than stable.
By contrast, there are many ways that Greece could quickly reduce its debt-to-GDP ratio: its unofficial economy is estimated at 25% of its official economy; while some officially unemployed Greeks may be working unofficially, many are not – so labour market reforms could spur rapid growth.
There’s an open debate on how to interpret debt-to-GDP ratios and higher numbers are certainly worrying. Yet, Japan suggests there is no magic number: how a country can manage its debt depends on the circumstances and choices of that country.
4. Greece’s transition recession is unusually long
The graph below shows real GDP as a percentage of 1989 GDP in post-Soviet transition economies. Produced by economists Nauro Campos and Abrizio Coricelli, it shows that going through a political and economic transition simultaneously, without a coherent reform strategy, can be disastrous for economic growth. After the collapse of the Soviet Union, post-Soviet countries suffered decreases in official output for years, in spite of international support, including help from the European Bank for Reconstruction and Development. Twelve years after 1989, only six of the 25 countries had official GDP figures above their 1989 levels.
Greece’s political transitions between democratically elected governments have been less fundamental than the post-Soviet transitions, but its commitment to reform has been questionable throughout. Its poor performance in privatisating inefficient state-owned enterprises has drawn particular attention: the following graph shows privatisation not only well behind schedule, but falling further behind all the time. This deprives the Greek state of revenues, and the Greek people of more efficient services.
Thus, one of the tragedies of the present situation is that protracted negotiations over the country’s bailout conditions may have just increased the overall cost of the transition process.
5. Greece is too big to fail
The idea that Greece is too big to fail and will have significant knock-on effects for global financial markets has been used in some of the brinkmanship at play in the country’s debt negotiations – including by former finance minister Yanis Varoufakis.
But, while the Greek debt crisis has increased uncertainty and any further default or uncontrolled exit from the euro will pose costs, the markets do not seem terribly roiled by the prospect of its default. This is not surprising: Greece makes up about 2% of Europe’s population and GDP; Europe’s economy is stronger than it was in 2010-2012.
An underappreciated aspect of the “too big to fail” idea is what it does to an economy’s prospects. Indeed, one of the leading explanations of Soviet economic decline is the “soft budget constraint”. Soviet firms tended to be much larger than their Western counterparts, giving each considerable power to renegotiate its production plans – without more resources, it could threaten to harm other sectors in the economy, which had few alternative suppliers to turn to.
This seems to be the concern expressed by many of the other European countries: at the eurozone’s inception, the open question was whether the Bundesbank’s credible, low-inflation, low-interest rate standard would prevail. Or whether the eurozone would end up converging on one of the less credible, high-inflation and high-interest rate standards. If the moving appeals of a country comprising 2% of Europe can successfully soften Europe’s budget constraint, then it can be expected that any larger country will be able to as well, if they can demonstrate a severe enough crisis.
Were Greece to become the first country to leave the eurozone, it would give us invaluable real experience in a fairly controlled context; this would improve eurozone policy when faced with similar situations in the future.
Author: Colin Rowat, Senior Lecturer in Economics at University of Birmingham
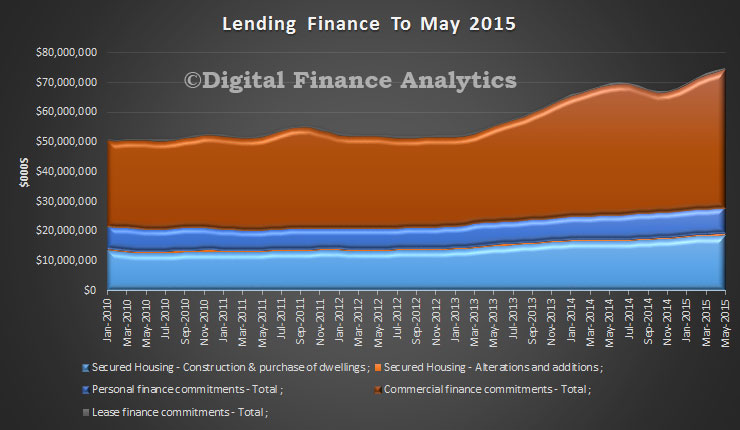
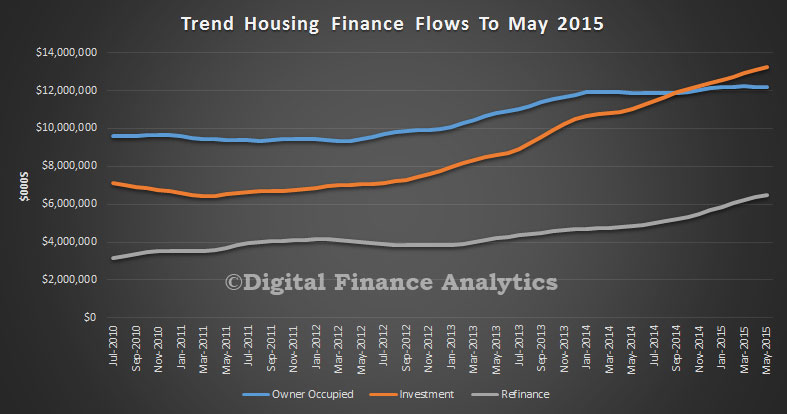
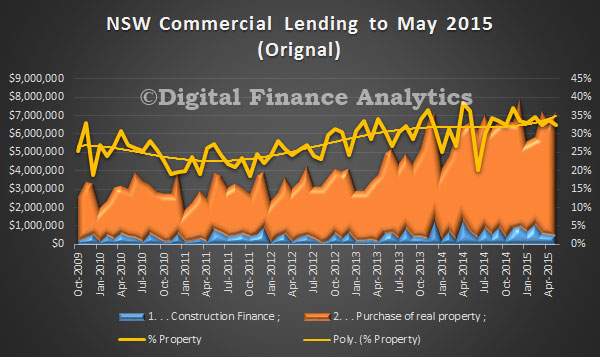
The ABS released their overall lending data for May 2015. It shows the same old story. Significant growth in investment lending, especially driven by NSW. The total value of owner occupied housing commitments excluding alterations and additions rose 0.4% in trend terms. Investment lending was 1.0% up in the month, and refinance up 1.6%. The trend series for the value of total personal finance commitments rose 0.8%. Fixed lending commitments rose 1.7%, while revolving credit commitments fell 0.3%. The trend series for the value of total commercial finance commitments rose 1.5%. Fixed lending commitments rose 1.9% and revolving credit commitments rose 0.3%. The trend series for the value of total lease finance commitments rose 1.1% in May 2015 and the seasonally adjusted series rose 0.7%, after a fall of 1.5% in April 2015.
The housing data shows that investment lending is still hot. Refinancing is also on the up.
The state data shows that NSW investment lending set a new record on both volume and value.
The Chinese stock markets have experienced significant turmoil in recent weeks, with the Shanghai Composite Index – the country’s major reference – falling by 32% since June 12. But this fall was preceded by an equally sharp rise of 150% over the previous nine months. In the 20 years since I have been working in finance, I’ve never seen anything like this. So what is going on with the Chinese stock market?
There are several reasons for this unusual behaviour: firstly, when I teach stock market investment to my Chinese students, I always remind them that the Shanghai stock exchange should be thought of more as a casino, rather than as a proper stock market. In normal stock markets, share prices are – or, at least, should be – linked to the economic performance of the underlying companies. Not so in China, where the popularity of the stock market directly correlated with the fall in casino popularity.
Stocks and casinos
In China, given the low credibility of the financial statements published by listed companies, investors need to rely on other tools to predict share price performance. These tools include a heavy reliance on technical analysis and charts – a method that tends to predict future share price based purely on the company’s past performance, with no regards to its fundamentals. Even the name of the company is often neglected; all that matters is the historic price performance.
While this technique is also used in Western markets, my experience in China is that it is the predominant method for investment. Hence the disconnect between a share’s price movements and economic fundamentals.
There has been, however, a strong correlation between the stock market’s performance and the revenues of the casinos in Macau. While gambling revenues were growing at a fast pace in Macau, people largely ignored the stock market – whose performance was, largely, uninteresting for a number of years. But since China’s president, Xi Jinping, launched a campaign against corruption, gambling activity has started to decline. This was when the stock market started to move up. Coincidence?
Real estate
The other reason why the stock market experienced a sharp increase between September 2014 and June 2015 relates to the Chinese real estate market. In recent years, investment in real estate has been the only way for ordinary citizens to get returns higher than the paltry 3% offered by bank deposits (yes, 3% is paltry in an economy that grows at more than 10% a year in nominal terms). But high capital requirements and growing regulations on the purchase of real estate has meant that benefiting from this growing market has been increasingly difficult for ordinary citizens.
Macau: the traditional home of Chinese gambling.Shutterstock
Commercial banks therefore – in an effort to mimic real-estate returns – started to offer so-called “wealth management products”, which are basically funds that invest in the real estate market. These funds were then repackaged and resold in the retail market. Chinese individuals would take their savings out of current accounts and placed them into these wealth management products and achieve returns similar to those available to buyers of real estate.
This was the modus operandi until the beginning of 2014, at which point the economy and the real estate markets started to show signs of weakness. The once-easy money coming from the property market started to disappear and people with wealth management products started to get into financial trouble and some of them even defaulted on their payments (the government bailed them out, so no individual was at a loss).
Monetary policy
From November 2014 the Chinese central bank, worried about the slowing economy, decided to institute an aggressive monetary policy to rapidly lower interest rates with the aim of stimulating the economy, which also caused current account rates to decline. This created a perverse scenario where individuals who were already seeking returns higher than those offered by current accounts were then denied the opportunity to get them through real estate because of the falling market. As a result, deposit rates were cut further and the return on current accounts became even more dissatisfying. Commercial banks found themselves in a quandary.
The Shanghai Composite Index’s growth and decline in recent months.Yahoo finance
With the casino route closed and real estate off the table, what was left? The Shanghai and Shenzhen stock markets: the two main stock markets that had remained dormant for years.
Banks then turned the old real estate wealth management products into investment vehicles to purchase shares directly on the stock markets. A large portion of customer deposits were then directly invested in the stock market, which then surged on the back of that demand.
An empty bubble?
Meanwhile, however, nothing happened to the earnings forecasts of the underlying companies. In fact, if anything, they should have been revised down because of the deteriorating macroeconomic condition of the Chinese domestic economy. But of course, as we said before, no one really looks at earnings and price ratios.
Due to the desire to maximise returns, many individuals then used leverage so that the inflow of money in the stock market was even higher. For example, if someone wishes to purchase shares for a total value of 100RMB, but only has available cash in his deposit account of, say, 60RMB, he could borrow the remaining 40RMB from the brokerage house. By doing this, the original source of 60RMB was turned into an upward push of the stock price equivalent to the full 100RMB. This drove strong share price growth between September 2014 and June 12 2015.
What happened on June 12 2015? Nothing. Just some smarter investors (generally large institutional investors, which represent 20% of all market volumes) started to sell and the rest of the market followed suit. Fear got hold of small investors (who represent 80% of the market) and selling accelerated, with margin calls making those selling do so even faster, and here we are today – a 32% drop and counting since the peak of mid-June.
In the past few days, the Chinese government has adopted a number of measures to try to mitigate this crash. The market finally reacted positively to a relaxation of restrictions on margin requirements. But this measure simply transfers the risks from investors to brokerage houses – it does not change the fact that the market has increased by 70% over the last year. The bubble, if it is a bubble, still has a long way to go.
Author: Michele Geraci, Head of China Economic Policy Programme, Assistant Professor in Finance at University of Nottingham
The latest IMF World Economic Update just released, highlights slower growth in Emerging Markets, but a gradual pickup in Advanced Economies.
Global growth is projected at 3.3 percent in 2015, marginally lower than in 2014, with a gradual pickup in advanced economies and a slowdown in emerging market and developing economies. In 2016, growth is expected to strengthen to 3.8 percent.
A setback to activity in the first quarter of 2015, mostly in North America, has resulted in a small downward revision to global growth for 2015 relative to the April 2015 World Economic Outlook (WEO). Nevertheless, the underlying drivers for a gradual acceleration in economic activity in advanced economies—easy financial conditions, more neutral fiscal policy in the euro area, lower fuel prices, and improving confidence and labor market conditions—remain intact.
In emerging market economies, the continued growth slowdown reflects several factors, including lower commodity prices and tighter external financial conditions, structural bottlenecks, rebalancing in China, and economic distress related to geopolitical factors. A rebound in activity in a number of distressed economies is expected to result in a pickup in growth in 2016.
The distribution of risks to global economic activity is still tilted to the downside. Near-term risks include increased financial market volatility and disruptive asset price shifts, while lower potential output growth remains an important medium-term risk in both advanced and emerging market economies. Lower commodity prices also pose risks to the outlook in low-income developing economies after many years of strong growth.
Risks to the Forecast
The distribution of risks to the near-term outlook for global growth is broadly unchanged from that in the April 2015 WEO and is slightly tilted to the downside. The main risks highlighted in April remain relevant. In view of the muted consumption response so far, a greater boost from lower oil prices is still an upside risk, especially in advanced economies.
Disruptive asset price shifts and a further increase in financial market volatility remain an important downside risk. Term and risk premiums on longer-term bonds are still very low, and there is a possibility of markets reacting strongly to surprises in this context. Such asset price shifts also bear risks of capital flow reversals in emerging market economies. Developments in Greece have, so far, not resulted in any significant contagion. Timely policy action should help to manage such risks if they were to materialize. Nevertheless, recent increases in sovereign bond yields in some euro area economies reduce upside risks to activity in these economies, and some risks of a reemergence of financial stress remain. Further U.S. dollar appreciation poses risks of balance sheet and funding risks for dollar debtors, especially in some emerging market economies. Other risks include low medium-term growth or a slow return to full employment amid very low inflation and crisis legacies in advanced economies, greater difficulties in China’s transition to a new growth model, as illustrated by the recent financial market turbulence, and spillovers to economic activity from increased geopolitical tensions in Ukraine, the Middle East, or parts of Africa.