Why the Small Business Tax Break Could Pay for Itself

The immediate tax deduction for small business announced in the Federal Budget has been broadly welcomed, but what may have been missed is the fact that what the Government doesn’t collect now, it will collect later, according to The Conversation.

As part of the $5.5 billion small business package at the centre of its latest Budget, the Federal Government announced it would allow businesses with turnover less than $2 million to immediately deduct the cost of any individual asset purchased up to the value of $20,000, from Budget night through to the end of June 2017. The estimated cost of this accelerated depreciation measure to revenue is estimated at $1.75 billion over the four years of forward estimates.

But what should be noted about this measure is that it doesn’t change the eligibility for tax deductions of these assets; it simply changes how quickly a small business is able to receive the tax deduction.

Under the existing simplified depreciation rules for small business, an asset costing over $1000 would be depreciated at 15% for the first year, and 30% thereafter, until the taxable value of the asset pool is $1000 or less, at which point the full amount can be written off.

For a $20,000 asset, this would mean a $3,000 deduction would be allowable in the first year, and it would take around 10 years to fully depreciate it for tax purposes. This compares to a $20,000 deduction in the first year under the proposed measure.

Bear in mind, too, that small businesses fall into two general categories: those that are incorporated (companies), and those that aren’t (sole traders and partnerships). The taxable profits of small companies are taxed at a flat rate, which – assuming the announced 1.5% tax cut passes – will be 28.5%.

Unincorporated small businesses don’t get the 1.5% tax cut, as their income is included in the assessable income of the owners and taxed at their marginal rate of tax. Instead they’ll get a tax discount of 5% of business income up to $1000 a year.

Here, we’ll focus on small companies, where the flat rate of tax makes analysis easier.

For a small, incorporated business, and assuming the 28.5% tax rate, its tax bill would be reduced by $5,700 in the first year, as compared to only $855 under the existing regime. This is a total upfront benefit of $4,845, and supports the government’s argument that the change will improve cash flow for small business as compared to existing arrangements.

But the timing aspect also has a benefit for the Government, and there is evidence of this in the Budget Papers. Over the first three years of the forward estimates, the expected cost to revenue totals $1.9 billion. However, in the final year of the forward estimates (2018-19), this cost begins to reverse, and the Government expects to bring in an extra $150 million in revenue.

The reason for this reversal can be explained with respect to a hypothetical $20,000 asset purchased on July 1, 2015, by a small incorporated entity. Under the proposed rules, the company would have reduced its tax payable by $5,700 in the first year, as compared to only $855 under the existing rules.

This means the Government would collect $4,845 less tax from this company in respect of the 2015-16 tax year. However from the 2016-17 tax year onwards the Government will collect more, under the proposed measure, as this company has no further depreciation tax deductions available to it in respect to that asset.

This means that while over the forward estimates period, allowing this company to immediately deduct the cost of the asset in 2015-16 will cost the Government $1,662, it will subsequently collect $1,662 more in tax in the period beyond the forward estimates.

Mechanically, the total deduction for the asset under either the original simplified depreciation rules for small business or the proposed immediate write-off, will still be $20,000. In other words, whatever the Government doesn’t collect now it will collect later.

For the Government this is a good outcome politically for three reasons.

First, it allows it to say it is supporting small businesses to “have a go”, as Treasurer Joe Hockey puts it.

Second, even though there is a cost to revenue in the forward estimates period, over the following years this measure will have a positive impact on revenue. However, because this increase in revenue is primarily outside the forward estimates it is not visible in the Budget Papers.

This increase in revenue has to be equal to the cost – so the $1.75 billion net cost in the next four years will lead to an increase in revenue of $1.75 billion beyond the forward estimates.

Third, the Budget Papers contain only information on government decisions that involve changes since the previous Mid-Year Economic and Fiscal Outlook. So while this measure will mean the Government will collect more revenue over the years 2019-20 and onwards, this increase won’t register as a change in next year’s Budget and therefore this increase won’t be quantified there as such.

Re-balancing Unbalanced

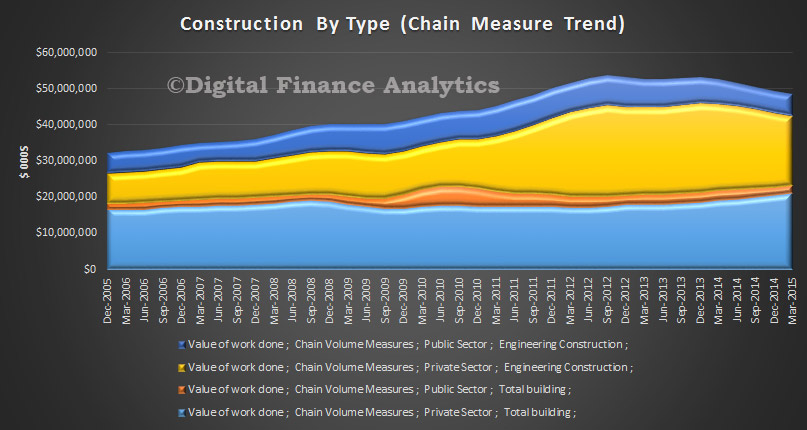
Data from the ABS yesterday and today together sum up the problem with the Australian economy. Yesterday we got the latest construction data showing that mining was dropping, and construction, especially residential construction, was up, but not enough to compensate, so the overall trend is a fall in activity. The trend estimate for total construction work done fell 1.8% in the March quarter 2015. The trend estimate for non-residential building work done rose 0.2%, while residential building work rose 3.1%. The trend estimate for engineering work done fell 4.7% in the March quarter.

ConstructionMarch2015Today we got data on private sector capex. The trend volume estimate for total new capital expenditure fell 2.3% in the March quarter 2015, the trend volume estimate for buildings and structures fell 3.7% in the March quarter 2015 and the trend volume estimate for equipment, plant and machinery rose 0.7% in the March quarter 2015. Forward looking capital expenditure (a dodgy data set by definition) shows the same trend, mining falling away quicker then other part of the economy, including construction and manufacturing not filling the gap, so net trend is down.

ExpenditeMarch2015 The painful process of re balancing away from mining is unbalanced, and we do not think the gap will be closed by a combination of residential construction, and household spending. Further rate cuts won’t do much more to assist either. It is time for a concerted look at how to drive business harder, to make productive investments in future growth. This should be a time to drive public sector construction programmes harder. Otherwise, GDP will be weaker into 2017 than the budget base case suggests.

RBNZ Still Looking For Low Inflation Key

A paper from the Reserve Bank of NZ entitled “Can global economic conditions explain low New Zealand inflation?” by Adam Richardson, was published today.

While international economic factors help explain the vast majority of why inflation in New Zealand is currently low, they do not shed additional light on the small portion of low inflation that is difficult to explain. Instead, domestic specific factors likely help account for the unexplained component of CPI inflation and this is a current focus of internal research at the Bank.

Inflationary pressure in New Zealand has been persistently low since the onset of the global financial crisis. This can be seen in the New Zealand economy in two major ways. First of all, the Official Cash Rate has remained low in New Zealand for a number of years, currently sitting at 3.50 percent. Interest rates have remained low in order to support growth and keep the outlook for future inflation consistent with the target mid-point.

Second, the weak inflationary environment can be seen in inflation itself. Since 2012, core consumers’ price index (CPI) inflation has averaged 1.4 percent – within the Bank’s target range, but below the 2 percent mid-point.

Even when accounting for developments in the international economic environment and New Zealand’s own economic conditions, inflation in New Zealand is a little weaker than the Bank’s usual modelling frameworks would suggest. That is, with the benefit of hindsight, there remains a portion of current low inflation outturns that is difficult to account for.

Overall, this unexplained portion of current low inflation is modest, in comparison to the usual level of uncertainty and the contribution international economic factors have made to current low inflation. However, it is important for the Bank to investigate potential explanations, so we can make fully informed policy decisions.

Note: The Analytical Note series encompasses a range of types of background papers prepared by Reserve Bank staff. Unless otherwise stated, views expressed are those of the authors, and do not necessarily represent the views of the Reserve Bank.


China’s Growth: Can Goldilocks Outgrow Bears? – IMF Paper

The latest IMF working paper analyses the recent growth dynamics in China, evaluating both cyclical positions and long-term growth prospects. The analysis shows that financial cycles play a more important role than traditional inflation-based cycles in shaping the dynamics of growth.

China’s impressive growth record speaks for itself, and the country’s policymakers have won additional accolades for the timely response to the Global Financial Crisis. The Chinese GDP has been growing at the average rate of nearly 10 percent per year in the past four decades. The well-timed policy relaxation supported growth in the immediate aftermath of the crisis. Several analysts pronounced the arrival of a goldilocks economy in China—not too hot to fuel inflation and not too cold to slip into recession —and some see a continuation of the stable economic growth as the most likely scenario for China.

A key question is how much of China’s slowdown is temporary (cyclical) versus long lasting (structural). Growth fluctuations in developing and emerging markets often follow a pattern of spans of impressive growth followed by long periods of stagnation. The concern is therefore not only about a cyclical growth slowdown typically experienced by mature economies, but a prolonged slump so often experienced in emerging markets. These fears are also fed by the observation that structural ‘imbalances’ in the Chinese economy—exceptionally high investment rates associated by some with ‘forced savings’ —have further grown since the GFC, reducing investment efficiency and total factor productivity (TFP) growth.

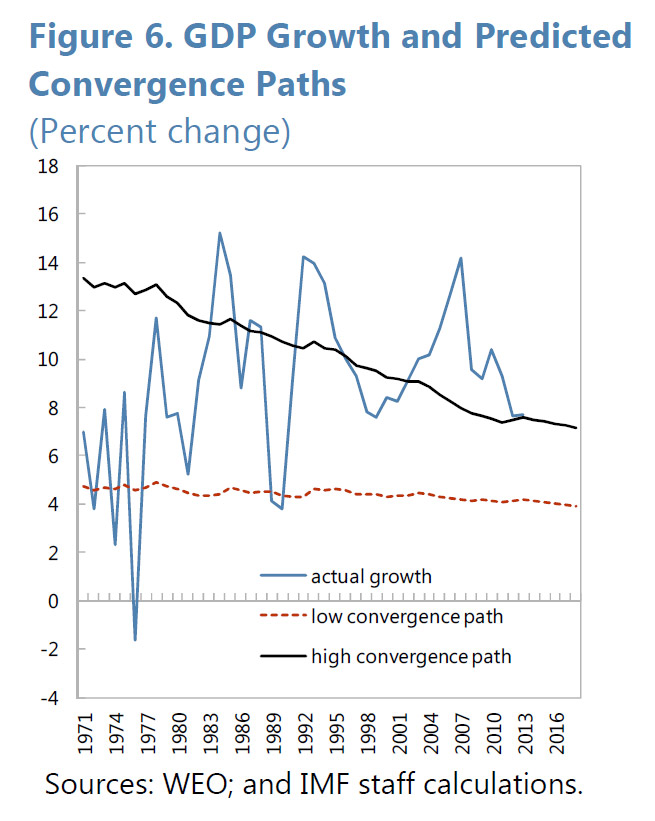
Headline growth in China has slowed from the pre-GFC peak of 14 percent to less than 8 percent in 2013. China benefitted from the pre-crisis global expansion, but its export-based model suffered a blow when global demand collapsed. At the same time, the authorities embarked on a massive credit-cum-investment stimulus, which cushioned the impact of the global slowdown.

China-GrowthThe paper simulates theoretical convergence growth paths by substituting China’s data to two versions of the estimated model. The actual growth path for China is significantly above the convergence path simulated from the full model (‘low convergence path’) and is oscillating around the Asian Tigers’ path (‘high-convergence path’) since the dismantling of the strict central-planning system in 1979.

In summary, the paper contributes to the ongoing growth debate by identifying the cyclical position and assessing the degree of potential output slowdown in China. The main results are:

  1. Expect growth to slow down in the near-term. Financial cycles in China play a significant role in shaping growth dynamics, and the economy is now likely near the peak of a powerful cycle propelling the economy since the GFC. An adjustment is therefore both likely and needed to bring the economy closer to equilibrium.
  2. Potential growth is slowing. This is expected as China makes progress on the long journey of converging to advanced economy income levels. As it moves closer to this technology frontier, growth will continue to slow. However, the pace of convergence, and thus China’s medium-term growth rate, will depend on structural reforms. With success in implementing reforms, China can follow the historical experience of other fast-growing Asian economies.

Currently, the ‘finance-neutral’ gap—a measure of the financial cycle—is large and positive, reflecting imbalances accumulated in the economy since the Global Financial Crisis. A period of slower growth is therefore both likely and needed in the near term to restore the economy to equilibrium. In the medium term, growth will slow as China moves closer to the technology frontier, but a steadfast implementation of reforms can ensure that China follows the path of the “Asia Tigers” and achieves successful convergence to high-income status.

Note The views expressed in this Working Paper are those of the author(s) and do not necessarily represent those of the IMF or IMF policy. Working Papers describe research in progress by the author(s) and are published to elicit comments and to further debate.

Effects of Income, Fiscal Policy, and Wealth on Private Consumption

An IMF working paper discusses an important issue, relating to what should have been the appropriate fiscal policy in the aftermath of the global financial crisis is very much open. There is considerable controversy over the impact of fiscal consolidation on economic activity and on why sluggish economic growth persists across many advanced economies several years after the onset of the financial crisis.

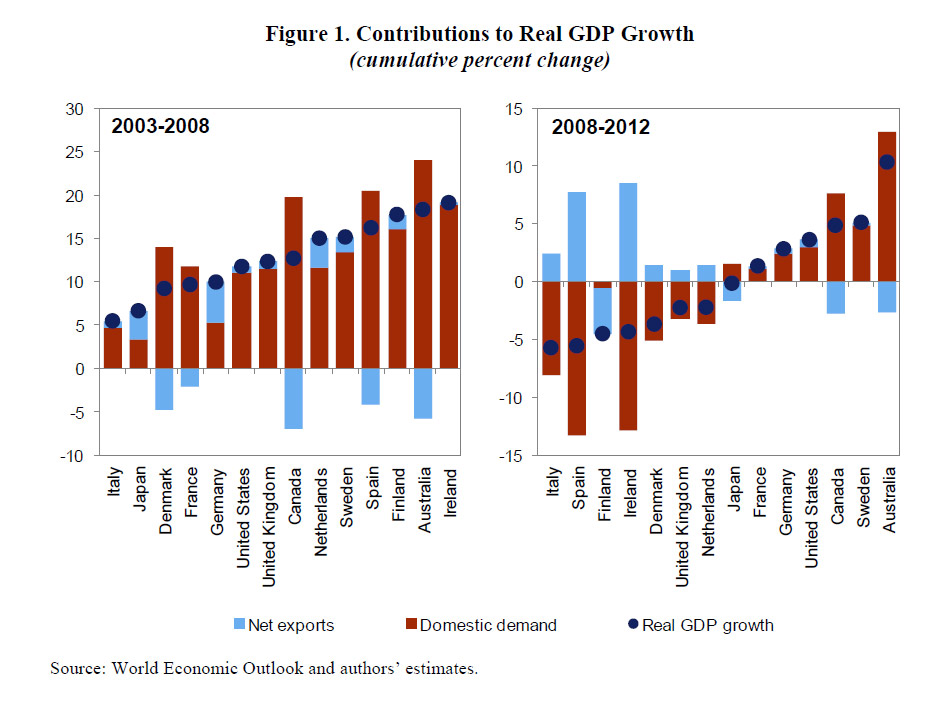
This paper looks at private consumption because, on average across countries, it is the component of GDP that accounts for the largest proportion of the overall changes to real GDP. Using econometric modelling the paper looks at the possible effects of fiscal policy on private consumption, but also explore the negative wealth effects stemming from the collapse of housing and financial assets in the context of high household debt. They argue that wealth effects played an important role weighing down consumption growth, suggesting that the effect of fiscal policy on economic activity may be overestimated if such factors are overlooked.

Two interesting data sets relating to the relative position of Australia and other countries in the analysis which shows the relative significance of private consumption in Australia since 2003. In the context of slowing income growth and very high household debt levels today, we cannot expect households to create significant GDP momentum in the next few years. Yet we have been very reliant on this for some time. In essence we have a structural economic problem.

IMF-Consumption-2 IMF-Consumption-1More generally they find that consumption is impacted by wealth effects, in addition to fiscal policy. They find a significant long-term relation between consumption and the different components of income and wealth. Labor income remains the main driver of consumption. Personal income taxes and social security contributions are found to have a negative impact on consumption, while social benefits are found to have a larger positive impact. Financial assets and housing assets are found to have a positive coefficient, while household debt is found to have a negative coefficient. Furthermore, the results suggest that the contribution to consumption from an increase in financial or housing assets would be more than offset if financed fully through in increase in household debt.

Note that IMF Working Papers describe research in progress by the author(s) and are published to elicit comments and to encourage debate. The views expressed in IMF Working Papers are those of the author(s) and do not necessarily represent the views of the IMF, its Executive Board, or IMF management.

China Policy Shift Prioritises Growth Over Debt Problem – Fitch

Fitch Ratings says the Chinese government directives last week concerning local government debt signal a potentially significant policy shift to prioritise growth over managing the country’s debt problem. Uncertainty over the scale and strategy to resolve high local government debt remains a key issue for China’s sovereign credit profile, and the latest directives could reflect a continuation of an “extend and pretend” approach to the issue. The directives should be credit positive for local governments, while broadly neutral for banks.

A joint directive from the Chinese finance ministry, central bank and financial regulator on 15 May, instructed the banks to continue extending loans to local government financing vehicles (LGFV)s for existing projects that had commenced prior to end-2014, and to renegotiate debt where necessary to ensure project completion. This is an explicit form of regulatory forbearance, and serves to delay plans to wind down the role of LGFVs. More broadly, it also suggests that propping up growth in the short term has temporarily taken priority over efforts to resolve solvency problems at the local government level.

Fitch estimates local government debt to have reached 32% of GDP at end-2014, up from 18% at end-2008. The CNY14.9trn increase accounts for 18% of the rise in total debt.

The authorities’ efforts to rein in indebtedness have led to a squeeze on monetary conditions and credit that has dampened growth. GDP expanded 1.3% qoq in 1Q15, and April activity data indicated the slowdown has persisted into the second quarter with weak demand across the board. Fixed-asset investment growth slowed to 12% yoy for the first four months of 2015, a 14-year low. Property investment growth fell to 6% from 8.5% in March as China’s 2009-2014 real estate boom continues to unwind.. This poses downside risk to Fitch’s projection of 6.8% growth for 2015.

Earlier, on 13 May, the central government also announced a USD160bn debt swap plan by which local governments would be allowed to convert LGFV debt for municipal bonds and where the bond yields would be capped.

For local governments, the swap will ease the interest burden at a time when a slowing economy and a significant reduction in land sales are weighing on revenue growth. Local government debt often carries interest rates in excess of 7%, whereas the local bonds that will be converted from debt under this programme will be restricted to yields not in excess of 30% above central government bonds with similar tenors.

Fitch views the development of a local bond market as credit positive in itself for local governments. They will benefit from an extended maturity profile on the bonds compared with LGFV instruments. This will significantly reduce liquidity risks, and ensure a better asset/liability match. It also widens local governments’ funding channels and builds a more transparent fiscal reporting system.

More broadly, Fitch expects the resolution of China’s debt problem will ultimately involve sovereign resources, and that debt will migrate on to the sovereign balance sheet. The agency views the debt-swap plan as part of this process, even though the new local government debt is not expected to carry an explicit sovereign guarantee – as the debt is likely to be perceived as having a strong implicit guarantee. Nonetheless, the expectation of substantial contingent liabilities is factored into China’s ‘A+’/Stable sovereign IDR, affirmed in April 2015.

For Chinese banks, the shift from debt to bonds will affect profitability, especially as the rates on the swapped bonds are being capped. Banks will receive lower yields on the same exposure at a time when net interest margins are coming under pressure owing to the macroeconomic slowdown. Furthermore, the government directive to continue extending loans to LGFVs on certain projects will have a negative effect on banks’ liquidity and leverage. More broadly, the directive highlights that banks remain subject to direct influence from the authorities, which could have an impact on management governance and standards.

However, it also reinforces the role that state banks play in economic stability, and therefore the high likelihood that they will benefit from state support. Furthermore, the impact on liquidity will be offset somewhat by the fact that banks will be able to use municipal and provincial bonds as collateral to access key lending facilities. This will enable them to boost lending to higher-margin business. Notably, too, the conversions should have some positive impact on banks’ reported capital ratios as municipal bonds have lower risk weights than local government loans.

ASEAN Financial Integration – SME Funding Needs

Interesting speech from Mr Muhammad bin Ibrahim, Deputy Governor of the Central Bank of Malaysia (Bank Negara Malaysia), at the ASEAN Risk Conference. The 10 countries which together are defined as ASEAN, make up a large and fast developing economic area with 600m people, and it could be the fourth largest trading bloc by 2050. But the credit gap for SMEs in East Asia is estimated to be more than USD250 billion, due to under-developed financial systems. Cross regional financial services players could have a critical role to play in future growth and development.

The vision for an economically and financially integrated ASEAN represents the aspiration of many policy makers, old and new. A recent take on this can be found in a document titled “The Road to ASEAN Financial Integration”, a study on the financial landscape and formulating milestones on ASEAN monetary and financial integration. This document endorsed by the ASEAN Central Bank Governors and approved by the Finance Ministers presents a clear, ambitious and committed statement by the region to collectively embark on this journey. In this respect, ASEAN has made meaningful progress in the identification, articulation and implementation of principles to advance financial and economic integration among its members.

ASEAN is home to more than 600 million people and if considered as a single entity, would represent the sixth largest economy in the world with a combined GDP of USD2.5 trillion. According to the OECD, the region is projected to sustain an average annual growth of 5.6% over the next four years and is expected to be the fourth largest trading bloc by 2050. Concurrently, the standards of living among the general populace will continue to improve. Household purchasing power has risen significantly over the last decade, transforming the region into a thriving hub of consumer demand. The size of ASEAN’s consuming class is expected to double from 81 million to 163 million by 2030. By 2020, Asia is estimated to account for more than half of the total global middle class population, with ASEAN representing more than USD2 trillion of additional consumption within the region.

Also, as the sources of economic growth become increasingly domestic-based, this enables many economies to diversify their sources of growth. An important development is the significant increase in intra-regional trade. These developments augur well for the region and would expand domestic demand and further fuel greater intra-regional trade among ASEAN member countries.

The promise of higher living standards and employment is also drawing large numbers of people from the countryside to cities. Today, just over a third of ASEAN’s population are living in urban areas. This is expected to rise to 45% by 2030.

Integrating national financial systems within the region is key to unlocking ASEAN’s enormous economic growth potential. As a critical component of the AEC, financial integration will significantly enhance the efficiency and effectiveness of intermediation and allocation of resources. This is crucial as the region pursues greater economic prosperity that is both inclusive and sustainable. By allowing the region’s financial resources to move more freely across borders, financial integration will open up new opportunities for businesses and trade, enhancing further financial linkages within the region.

A more integrated regional financial system would also allow a larger share of the region’s surplus savings to be deployed within the region towards productive ends, such as in physical infrastructure projects. According to the Asian Development Bank, ASEAN will require approximately USD1 trillion 1  over the next 10 years in infrastructure investments across the region. This includes for the provision of sufficient housing, efficient public transportation and access to clean water and electricity. While the numbers seem staggering, the ability to recycle the huge savings within ASEAN will substantially enhance the region’s prospects to fund and sustain such investments.

With one of the highest savings rate in the world, at approximately 30% of GDP which currently amounts to USD750 billion, a well-integrated regional financial system would provide a more comprehensive eco-system for an efficient and competitive intermediation and investment.

An important component of ASEAN growth is the critical role of SMEs in all economies. The AEC recognise this and calls for SMEs to play a greater role in contributing to the overall economic growth and development of ASEAN as a region. Access to financing, however, remains a key challenge for many businesses. Despite various national level efforts, more needs to be done for SMEs to obtain access to financing, including the funding required to grow their business beyond national borders. The credit gap for SMEs in East Asia is estimated to be more than USD250 billion.  The difficulties in access to financing are compounded by underdeveloped financial systems, the need to manage multiple banking relationships across different markets, and a lack of coordinated financial advisory support to help businesses navigate the regulatory and business environment in different jurisdictions. A larger presence of regional financial institutions can significantly reduce these challenges. Banks with wide regional networks would possess the intimate knowledge of each economy and understands the unique requirements of SMEs. Such banks are well placed to serve and harness SMEs’ capability to participate more meaningfully in the region’s production networks.

For ASEAN financial institutions, the prospect of regional financial integration will also serve to raise industry standards across the region. This includes enhancing the breadth and quality of financial products and services as a result of more efficient markets and the transfer of knowledge and technology. Financial institutions will also need to meet higher standards in how they manage risk and govern their operations. To some extent, this will be driven by regulatory efforts to elevate prudential and business conduct standards. But aside from regulation, greater economies of scale and scope will also make it more feasible for financial institutions to invest in talent and more advanced technology and systems, to support business development and risk management.

Chair Yellen Says US Rates Will Rise, Slowly

 In a speech by Fed Chair Janet L. Yellen at the Providence Chamber of Commerce, Providence, Rhode Island, she outlined the state of play of the US economy. Whilst there are mixed signals, she affirmed that rates will begin to rise later this year.

Implications for Monetary Policy
Given this economic outlook and the attendant uncertainty, how is monetary policy likely to evolve over the next few years? Because of the substantial lags in the effects of monetary policy on the economy, we must make policy in a forward-looking manner. Delaying action to tighten monetary policy until employment and inflation are already back to our objectives would risk overheating the economy.

For this reason, if the economy continues to improve as I expect, I think it will be appropriate at some point this year to take the initial step to raise the federal funds rate target and begin the process of normalizing monetary policy. To support taking this step, however, I will need to see continued improvement in labor market conditions, and I will need to be reasonably confident that inflation will move back to 2 percent over the medium term.

After we begin raising the federal funds rate, I anticipate that the pace of normalization is likely to be gradual. The various headwinds that are still restraining the economy, as I said, will likely take some time to fully abate, and the pace of that improvement is highly uncertain. If conditions develop as my colleagues and I expect, then the FOMC’s objectives of maximum employment and price stability would best be achieved by proceeding cautiously, which I expect would mean that it will be several years before the federal funds rate would be back to its normal, longer-run level.

Having said that, I should stress that the actual course of policy will be determined by incoming data and what that reveals about the economy. We have no intention of embarking on a preset course of increases in the federal funds rate after the initial increase. Rather, we will adjust monetary policy in response to developments in economic activity and inflation as they occur. If conditions improve more rapidly than expected, it may be appropriate to raise interest rates more quickly; conversely, the pace of normalization may be slower if conditions turn out to be less favorable.

Oil Prices And Their Economic Impact

How will lower oil prices flow through into inflation, growth and economic activity? Will monetary policy need to adjust to take account of oil price movements, or should these short term movements be isolated from inflation targetting? All important questions.

In a speech given today to the AIECE Conference in London, Martin Weale, External member of the Monetary Policy Committee, discusses two key issues for the inflation outlook in the UK: the impact of oil price moves on the UK inflation forecast, and the degree to which international prices feed through into the outlook in this country.

Weale’s arguments derive from models he believes offer a more realistic sense of the probability of relatively extreme movements in prices occurring than implied by more popular methods in economics – a lesson economists should have learned from the financial crisis. He states: “It might seem like a technical point, [but] it is in fact fundamental: if you seriously underplay the chance of relatively extreme events happening, then not only will you be more surprised when they do happen, but you may be tempted to read too much into them.”

Weale’s model for the impact of oil prices on the macroeconomy – drawing on long run data beginning in 1970 – indicates there is a risk that the impact of the oil price fall we have witnessed will be somewhat stronger in the near term than the MPC has predicted. The result, he concludes, would be that growth for 2015 would prove a little stronger, and inflation a little weaker, than expected.

However, Weale states that the risk of a slightly weaker profile for inflation has little impact on his outlook for policy, as the effect will have dissipated within two years – the relevant point for policymaking.

Turning to the international context, Weale investigates how far inflation in the UK is determined independently of what happens in other advanced economies.

Weale notes that the correlation between inflation in the UK and other OECD countries has been relatively high since 2008 – and more so over the past eighteen months.

However, he finds that there is relatively limited statistical evidence that the correlation is strong over the longer-run. Using data from 1993 to the present, he notes that the variability of core inflation in other rich countries can account for only about a seventh of the variability of UK core inflation.

Summing up, Weale states that the MPC must weigh the need to respond to these international factors, against the desire to provide some stability in the level of interest rates and output.

He adds: “I think the Committee is quite right to let the short-term effects of external shocks feed into inflation, even if this pushes it far from target, whether on the downside as now, or on the upside as in the crisis. To do otherwise, and tighten or loosen aggressively, would do little to help inflation in the short term, but would risk a lot with unwanted gyrations in output.”


Federal Reserve Minutes From April Suggest Rates US Rates Will Be Lower For Longer

From the Fed: Information received since the Federal Open Market Committee met in March suggests that economic growth slowed during the winter months, in part reflecting transitory factors. The pace of job gains moderated, and the unemployment rate remained steady. A range of labor market indicators suggests that underutilization of labor resources was little changed. Growth in household spending declined; households’ real incomes rose strongly, partly reflecting earlier declines in energy prices, and consumer sentiment re-mains high. Business fixed investment softened, the recovery in the housing sector remained slow, and exports declined. Inflation continued to run below the Committee’s longer-run objective, partly reflecting earlier declines in energy prices and decreasing prices of non-energy imports. Market-based measures of inflation compensation remain low; survey-based measures of longer-term inflation expectations have remained stable.

Consistent with its statutory mandate, the Committee seeks to foster maximum employment and price stability. Although growth in output and employment slowed during the first quarter, the Committee continues to expect that, with appropriate policy accommo-dation, economic activity will expand at a moderate pace, with labor market indicators continuing to move toward levels the Committee judges consistent with its dual man-date. The Committee continues to see the risks to the outlook for economic activity and the labor market as nearly balanced. Inflation is anticipated to remain near its recent low level in the near term, but the Committee expects inflation to rise gradually toward 2 per-cent over the medium term as the labor market improves further and the transitory effects of declines in energy and import prices dissi-pate. The Committee continues to monitor inflation developments closely.

To support continued progress toward maxi-mum employment and price stability, the Committee today reaffirmed its view that the current 0 to ¼ percent target range for the federal funds rate remains appropriate. In de-termining how long to maintain this target range, the Committee will assess progress—both realized and expected—toward its objectives of maximum employment and 2 percent inflation. This assessment will take into ac-count a wide range of information, including measures of labor market conditions, indica-tors of inflation pressures and inflation expec-tations, and readings on financial and interna-tional developments. The Committee antici-pates that it will be appropriate to raise the  target range for the federal funds rate when it has seen further improvement in the labor market and is reasonably confident that infla-tion will move back to its 2 percent objective over the medium term.

The Committee is maintaining its existing pol-icy of reinvesting principal payments from its holdings of agency debt and agency mortgage-backed securities in agency mortgage-backed securities and of rolling over maturing Treasury securities at auction. This policy, by keeping the Committee’s holdings of longer-term securities at sizable levels, should help maintain accommodative financial conditions. When the Committee decides to begin to re-move policy accommodation, it will take a balanced approach consistent with its longer-run goals of maximum employment and inflation of 2 percent. The Committee currently anticipates that, even after employment and inflation are near mandate-consistent levels, economic conditions may, for some time, warrant keeping the target federal funds rate below levels the Committee views as normal in the longer run