When, Why, and What’s Next for Low Inflation?

A significant speech from the Bank of England by External MPC member Kristin Forbes “When, why, and what’s next for low inflation?: No magic slippers needed“.

Kristin Forbes explained why she is confident that inflation is currently “on track to rebound toward target” by early 2016. And unlike the solution to deflation proposed in the Wizard of Oz, the UK’s rebound will not require “assistance from wizards or magic slippers”.

Kristin opens by noting the “remarkable shift” in most developed countries; from inflation “too high” in the 1970s, to “just right” in the 1990s to mid-2000s, to falling to levels that raise concerns about being “too low” over the last few months.
Kristin then considers several concerns that have been raised about current low inflation and finds some “overhyped” and others worthy of close attention. The first of these is the claims that consumers and businesses could delay purchases and investment if they expect items to be cheaper in the future. Kristin finds this argument “unconvincing for the UK today”. Instead the evidence suggests that “consumers tend to spend more – not less – on items whose prices fall”.

Likewise the claim that low inflation will make it harder for individuals, businesses and governments to repay debt “have some merit” but are not applicable today; “interest rates are near historically low levels, credit is readily available for most credit-worthy borrowers, debt-servicing ratios are relatively low, and low inflation is expected to be short lived.”

A more significant concern is that the current low level of inflation will have persistent second-round effects by lowering inflation expectations which could in turn supress wage growth. This is something for the MPC to watch closely but “there is not yet any evidence that low inflation has significantly held back wage growth. Instead, wage growth has picked up over the period that inflation has fallen.” In fact, “the rapid normalization of the labour market should continue to support wage increases – even in an environment with low headline inflation”.

Kristin dedicates most of her analysis to the final concern; that “low rates of global inflation, or just low inflation in individual countries with strong links to the UK, could create additional spillover effects that drag on UK prices”. An unusually large number of countries are currently experiencing deflation or low inflation, and there is a risk that the UK could be exposed to weak prices abroad through its significant export and import markets or even “latent competitive effects”.

The recent downward movement in core inflation, however, seems to be driven more by sterling’s 18% appreciation than by any spillover effects from low inflation in other countries. Kristin confirms this by introducing an expanded set of measures of domestically-generated inflation, which show remarkable stability in domestic inflation over the last year, after removing the effects of exchange rate movements – and even upward movement in wages and unit labour costs. A detailed analysis of the effects of inflation in other countries finds that “inflation in some of the UK’s more important trading partners (such as Germany) may have some small additional effects on UK inflation rates. But inflation in many economies with strong ties to the UK – whether through location, colonial linkages, language, or other variables – does not exert any significant effect on UK inflation. Even key trading partners’ inflation rates do not seem to generate any consistent and significant spill-overs to UK core inflation rates.” Therefore, low inflation elsewhere seems unlikely to cause low-inflation to persist for longer than currently expected.

All of which leads Kristin to conclude that “inflation is currently on track to rebound toward target without any need for assistance from wizards or magic slippers.”

Wage Growth Decline

The RBA published a paper on The Decline in Wage Growth. In real terms wages are static or falling for many, and we note from our own surveys that as a result, households are under increasing stress, because costs of living continue to rise. In fact the recent cuts in the mortgage rate as the cash rate has fallen, as effectively got people off the hook. This would reverse quickly if rates started to rise, because the average mortgage is bigger now, and held for longer. But whats behind the decline? We summarise the discussions.


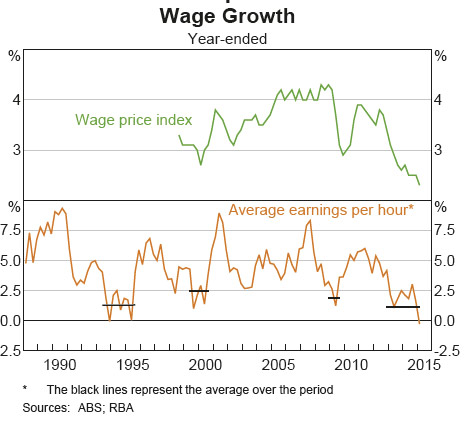
The rate of wage growth has important implications for the macroeconomy. Wages are the largest source of household income and the largest component of business costs, and so have significant implications for consumer price inflation. Wage growth has declined markedly in recent years to the lowest pace since at least the late 1990s, according to the wage price index.

Wage-Price-Trend-2015Wage measures with a longer history suggest that this has been the longest period of low wage growth since the early 1990s recession. Across these measures, the rate of annual wage growth has declined to around the pace of inflation, about 2–3 per cent. The slowing in wage growth has occurred alongside faster growth in labour productivity. This has also helped to moderate growth in labour costs for firms, beyond the impact of lower wage growth. Accordingly, growth in the labour cost of producing a unit of output (unit labour costs, or ULCs) has also declined markedly since 2012. Indeed, the level of ULCs has been little changed for more than three years – the longest such period since the early 1990s.

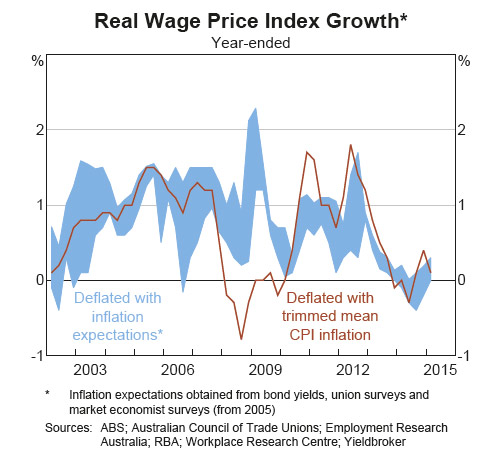
Even accounting for temporarily lower inflation expectations, real wage growth from the perspective of consumers has declined markedly, to around zero.

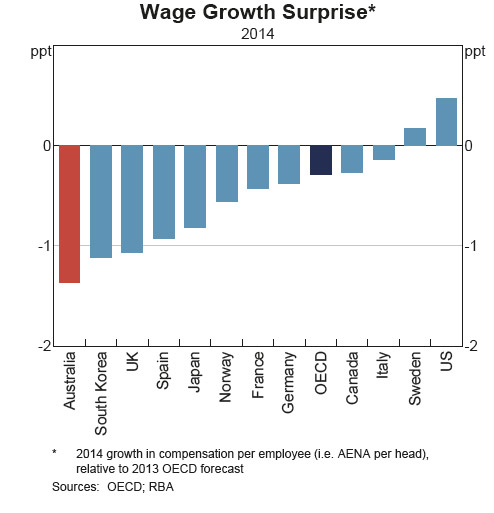
Real-Wage-Growth-2015The recent low wage growth has not been unique to Australia. Internationally, wage growth has been lower than forecast for several developed economies in recent years, including some where labour markets have tightened considerably. Various factors have been proposed to explain this weakness, including secular trends that have been in place for some time and have also resulted in a general decline in the labour share of income. However, the decline in wage growth in Australia stands out, with the extent of the forecast surprise for Australia particularly large in the context of OECD countries in recent years

Wage-Growth-OECD-2015Several factors appear to explain much of the decline in Australian wage growth. There has been an increase in spare capacity in the labour market, and expectations of future consumer price inflation have declined to be a bit below average. Inflation in output prices in recent years has been particularly subdued, in large part owing to the lower terms of trade. More generally, the decline in the terms of trade and fall in mining investment in recent years mean that the economy requires a lower ‘real’ exchange rate, which has been in part delivered by low wage growth. A statistical model indicates that these factors do not fully explain the extent of decline in wage growth, suggesting that other factors, such as an increase in the flexibility of wages to market conditions, may also have contributed.


A range of related factors appear to explain much of the decline in wage growth in Australia in recent years. Below-average growth in economic activity has translated into subdued growth in labour demand, which has resulted in an increase in spare capacity in the labour market. At the same time, expectations for consumer price inflation have moderated to be below average. The decline in the terms of trade and falls in mining investment appear to have played a particularly important role, weighing on economic activity and placing pressure on firms to contain costs. This has partly unwound the relatively strong inflation in Australian unit labour costs over the period of the mining boom, which was part of the economy’s adjustment to the domestic income boost from the higher terms of trade. Altogether, the result has been an adjustment in Australia’s relative labour costs, improving cost competitiveness against other advanced economies. In effect, this has assisted in bringing about some adjustment of the real exchange rate. Statistical estimates suggest that these factors explain much, but not all, of the episode, meaning there may also have been some other forces at play including an improvement in the flexibility of wages.

While a large wage adjustment has taken place, wage growth is widely expected to remain low. Evidence from the Bank’s liaison with businesses, alongside surveys of firms and union officials, suggest that the general pace of wage growth is not expected to pick up over the year ahead. One further factor that may continue to weigh on wage growth is a ‘pent-up’ adjustment. Reports through the Bank’s business liaison in recent years have indicated that many firms and employees have been reluctant to bargain for wage growth below expected inflation of 2–3 per cent. Accordingly, wage outcomes of 2–3 per cent have been relatively common over the past couple of years among liaison contacts. Outcomes lower than this, which would imply a fall in real consumer wages, are generally seen to have a negative effect on worker morale and productivity, as well as on the retention of quality staff. So while the decline in wage growth has been large, it might have been larger still if not for this element of rigidity in real wage growth. Accordingly, a degree of ‘pent-up’ downward pressure on wage growth might remain for a time, even if labour market conditions more generally were to improve.

The facts on Australian coal production

From The Conversation. Talk of the demise of Australian coal production is largely political, not economic.

The problem for the countries that presently mine and burn coal is that there are currently few low cost alternatives. Most countries in the world today are focused on trying to ensure their citizens have access to electrical power. This is difficult without low cost base load electricity production and at present, coal provides an affordable solution.

As at the end of 2012 there were 75 countries producing coal. These countries ranged from Nepal with production of 17,640 short tons in 2012, through to China with production of 4.017 billion tonnes in the same year.

It’s worth noting that Australia was ranked 5th (after China, the United States, India and Indonesia) with coal production of 463 million tonnes in 2012. While these rankings move around a little over time there is no doubt Australia is still a major player in the market for coal.

Regional coal production

U.S. Energy Information Administration (EIA) U.S. Energy Information Administration (EIA)

If you focus on regional coal production since 1980 (see chart above), it is clear production in most regions is levelling out or falling except for Asia and Oceania. When you break this group down there are four major producers involved: China, India, Indonesia and Australia, with a large number of other countries producing considerably less. This is evident in the chart below. Coal production has increased in each of these countries since 1980 though the rate of increase since 2000 is greatest for China.

Coal production by China, India, Indonesia and Australia

U.S. Energy Information Administration (EIA)

While Australia’s coal production is important, it is not the largest coal producer. There are a number other countries in the world that produce very large amounts of coal. If Australia were to cease production of its coal there would be an initial increase in world prices. Nevertheless, it is expected that other producers would fill the gap, particularly given the more recent falls in demand for coal.

If the demise of coal was close, you would expect to see it in the share prices of coal producers, as investor expectations shifted on the future of the firms and their ability to produce cash in the future.

The figure below provides standardised total returns for two portfolios of coal companies listed on the Australian Securities Exchange. The figure also includes the S&P/ASX 200 share market index standardised portfolio value for the same period and the AUD price of Australian thermal coal. There were four miners (including BHP Billiton) included in the portfolio early in the 2000s though this quickly expanded to 10 by 2005 through to 21 from 2011.

The portfolio values and the share market index are standardised to a value of A$1.00 at the end of December 1999 and the total returns are compounded over the period to provide an indication of how the value of the coal mining firm portfolios and the share market have changed over the period.

There is a fair spread of different sized coal producers in the portfolio including BHP. Portfolios are graphed both with and without BHP Billiton, though inclusion of BHP Billiton has little impact. Private non-listed companies are not included in the portfolios.

Coal equally weighted portfolios of ASX listed coal producers

Datastream for share prices and share price index and Index Mundi for the Coal price. Index Mundi

Coal company values have been volatile, relative to the Australian share market (S&P/ASX200 index) over the last 15 years, particularly since 2006. Yet, there is also evidence of some stability over the last couple of years, particularly since 2012.

Coal mining company values have fallen since 2011 though they appear to have stabilised by 2013. The overlaid AUD coal price per tonne tells a different story with its highest price recorded late in 2008 followed by price falls for the remainder of the period. These results are not consistent with the collapse of the coal industry. Indeed, the recent stabilisation of coal mining company prices, after the collapse of 2011 suggest a quite different story.

The anti-coal movement is gaining momentum in Australia. AAP

Given these results it seems odd that superannuation funds and large investors might be considering divesting their investments in coal. There is no question that coal mining company share prices have fallen dramatically from the highs of 2011 but it is not altogether clear that that these companies will disappear in the near term given current share prices. And it would be a brave investor that chose to divest its investment in BHP Billiton or Rio Rinto Limited because part of their business involved the extraction of coal.

It would appear that carbon capture and storage has failed to provide the solution to the CO2 emissions generated from burning coal, yet alternative sources of energy are relatively expensive at present. Governments can change the relative cost of coal through carbon markets, carbon taxes or direct legislation. Yet the global reality for coal appears to be reflected in coal mining share prices. The economics suggest it is here to stay for some time yet.

Author – Richard Heaney, Professor at University of Western Australia

RBA Minutes For June Meeting Released

The latest minutes tells us little about future prospects for rate changes, the RBA is waiting to see what happens but with overall growth expectation weak. They recognise risks in the housing sector in some centres, but also see slow business investment and spare capacity in the system. Between a rock and a hard place!

International Economic Conditions

Members noted that data released over the past month confirmed that growth of Australia’s major trading partners had eased a little in the March quarter and were consistent with around-average growth in the period ahead. Measures of global headline and core inflation rates had remained subdued in April.

Following a moderation in growth in the March quarter, some of the recent Chinese data had been more positive. Growth of industrial production and retail sales had picked up a little and conditions in the property market had improved somewhat, particularly in the larger cities. However, growth of fixed asset investment, particularly in the real estate sector, had eased further. While the production of steel had increased over recent months, its rate of growth remained significantly lower than earlier trends. The Chinese trade data had indicated weakness in both exports and imports in recent months, although imports of Australian iron ore had continued to rise. Members noted that the Chinese authorities had eased a number of policies and announced initiatives intended to support growth.

In Japan, national accounts data for the March quarter showed that economic activity had grown at a moderate pace. Wage growth had increased over the past year and the unemployment rate had declined to its lowest level in almost 20 years. For the remainder of east Asia, GDP had grown slightly below its average pace of recent years in the March quarter and both headline and core inflation had eased. In India, economic conditions had improved over the past year or so.

In the United States, indicators of activity had been mixed, though more positive than suggested by the weak March quarter GDP data, which had largely reflected temporary factors. Labour market conditions had continued to improve and consumption growth had remained relatively strong. Business activity indicators had generally remained positive, though they were a little weaker than late in the preceding year.

Economic conditions in the euro area had continued to improve, but the recovery remained modest and inflation continued to be well below the European Central Bank’s target.

Overall, commodity prices had been little changed since the previous meeting. The prices of coal and base metals had fallen, while the price of iron ore had increased.

Domestic Economic Conditions

Members noted that the March quarter national accounts would be released the day after the meeting. The data available prior to the meeting suggested that GDP growth had been close to average in the quarter, although below average on a year-ended basis. Growth in household consumption for the March quarter was expected to have been around average, while both dwelling investment and resource exports appeared to have been growing strongly. In contrast, business investment was likely to have contracted. There continued to be spare capacity in product and labour markets, despite some improvement in labour market conditions over the past six months or so.

Members observed that the Australian Government Budget for 2015/16 had outlined a number of years of slightly larger deficits than had been forecast in the Mid-Year Economic and Fiscal Outlook update in December 2014. This mainly reflected lower commodity prices and weaker-than-expected growth of incomes. Members were informed that the budget policies were little different from what had been assumed for the forecasts presented in the May Statement on Monetary Policy. Members discussed the importance of including the fiscal positions of the states and territories in any assessment of the effect of fiscal consolidation on the aggregate economy.

Growth of retail sales volumes had been around average in the March quarter. Measures of consumer sentiment had picked up noticeably in May to be a bit above average. Much of this had been attributed to the Australian Government Budget and, in particular, the announcement of tax concessions for small businesses. Liaison suggested that there had been little change in the year-ended growth of the value of retail sales in April and May.

Dwelling investment looked to have grown strongly in the March quarter and forward-looking indicators of construction activity pointed to a further pick-up. Members noted that conditions in the established housing market had continued to vary across the country. Although housing price inflation had remained high in Sydney and, to a lesser extent, in Melbourne over recent months, there had been some divergence in price developments for different segments of these markets; price inflation of detached houses had increased, whereas price inflation for units had eased in both cities. Noting that housing price growth in other cities and regional areas had declined over recent months, members discussed the strength and composition of underlying supply and demand conditions in different parts of the housing market. They also observed that there was a relatively low stock of dwellings for sale in Sydney and Melbourne and that dwellings took only a short time to sell.

Members noted that housing credit growth overall had been broadly steady at around 7 per cent (on a six-month-ended annualised basis), though the latest data on loan approvals had showed a pick-up. Over the past six months or so, growth in investor credit had eased back to be running at an annualised pace of a bit above 10 per cent. However, over more recent months there had been solid increases in housing loan approvals to both owner-occupiers and investors, particularly in New South Wales, following earlier declines.

The available data suggested that private business investment had declined further in the March quarter, consistent with the forecast presented in the May Statement on Monetary Policy. Mining investment appeared to have fallen further, while non-mining investment looked to have been little changed over recent quarters. Members observed that there were diverging trends within the non-mining sector. Investment in some sectors, such as real estate and retail trade, had picked up in response to stronger growth in domestic demand, but investment had continued to fall in other sectors, such as manufacturing, where the rate of investment had been lower than the rate of depreciation in recent years. Members noted that a lower exchange rate would have an immediate beneficial effect on some sectors, such as tourism, but that it would need to be lower for a sustained period to have a significant effect on large investment decisions in other trade-exposed sectors.

Surveys of business conditions remained a bit above their long-run averages in April. In contrast, an economy-wide measure of business confidence had remained below its long-run average level, along with various measures of capacity utilisation. Also, the second reading from the ABS capital expenditure survey of businesses’ investment intentions for 2015/16 implied a fall in non-mining investment.

Trade data suggested that export volumes had increased strongly in the March quarter across most categories, including bulk commodities. Import volumes also appeared to have increased strongly, though capital imports had remained lower than their peak in 2012.

The labour force data continued to suggest that growth in employment and hours worked had been stronger over the past six months or so than the preceding period and the unemployment rate had been relatively stable at around 6¼ per cent. In April, employment had been little changed, the participation rate had ticked down and the unemployment rate had increased slightly to 6.2 per cent. Forward-looking indicators suggested that employment growth would be only modest in the coming months and most measures of job advertisements and vacancies were little changed since mid to late 2014.

Wage growth had declined a little further in the March quarter and remained lower than suggested by the historical relationship between wage growth and the unemployment rate. The rise in the private sector component of the wage price index had been the lowest outcome for many years (with the exception of the September quarter 2009) and wage growth over the year to March was below its decade average in all industries. Wage growth in the public sector had also remained low, in part because of delayed negotiations over enterprise bargaining agreements. Members considered several possible explanations for the slow growth of wages, including a more flexible labour market, the relatively long period of gradually rising unemployment over recent years and below-average levels of inflation expectations generally.

Financial Markets

Financial markets continued to focus on the current negotiations between Greece and its official sector creditors and the likely timing of interest rate rises in the United States. A sharp rise in 10-year bond yields was the main development across the major financial markets over the past month.

Members noted that the global rise in sovereign bond yields had been led by longer-maturity German Bunds, with those yields rising by as much as 65 basis points after reaching a historic low in mid April. The rise in yields was viewed primarily as a correction from unduly low levels, rather than a reaction to economic developments, and the sell-off only returned yields to their still low levels of late last year.

Longer-term sovereign yields in most other developed countries, including Australia, also rose significantly, while increases in yields on emerging market sovereign debt were generally smaller. Following the release of the Australian Government Budget, the Australian Office of Financial Management announced updated financing requirements for 2015/16, with net issuance of Australian Government Securities expected to be around $40 billion and net debt peaking at around 18 per cent of GDP in 2016/17.

In relation to the continuing negotiations between Greece and its official sector creditors, members observed that sizeable differences remained regarding the most substantive issues, including pensions and labour market reforms. Greece had been able to meet its scheduled payments to the International Monetary Fund (IMF) in May, but Greek officials had cautioned that payments due to the IMF in June would be difficult to make without an agreement being reached with the official sector creditors. Members also noted that, consistent with reports of deposit outflows, Greek banks’ use of emergency liquidity assistance had increased further during April and May.

In the United States, expectations about the timing of the first increase in the federal funds rate had changed little over the past month, with market pricing suggesting it would happen around the end of 2015, even though comments from the Federal Reserve suggested that the first increase would occur a little sooner than that. The People’s Bank of China had moved to ease monetary policy further in May when it announced another reduction in both benchmark lending and deposit rates in response to low inflation and slower growth in economic activity.

Turning to foreign exchange markets, members noted that the US dollar had reversed its recent modest depreciation against most currencies, reaching its highest level against the yen since December 2002. The Chinese renminbi was little changed against the US dollar over the past month, although it had appreciated further on a trade-weighted basis and had been assessed by the IMF as being no longer undervalued. The Australian dollar had depreciated over May to be a little above its trough in early April on a trade-weighted basis.

Equity prices in the major markets had shown little net change since the previous meeting. The broad index for Chinese equities had increased by 2 per cent over the past month, although the index had been volatile. Members also noted the high-profile collapses in the prices of two Hong Kong-listed Chinese companies in mid May. Australian equity prices had underperformed the major markets over May.

Pass-through of the reduction in the Australian cash rate target in May to lending and deposit rates had varied across domestic financial institutions and products. At the same time, a number of banks were reported to have tightened conditions on new loans to property investors and imposed restrictions on the extent of interest rate discounts. Members noted that it would take some time for the full effects of such changes to be evident in the housing loan approvals and credit data.

Market pricing indicated that the cash rate target was expected to remain unchanged at the present meeting.

Considerations for Monetary Policy

Members noted that information becoming available over the past month had not led to any material change to the global outlook, which was for growth of Australia’s major trading partners to be around average over the period ahead. After somewhat weaker-than-expected economic conditions in China earlier in the year, the authorities had eased a range of policies and announced initiatives to support growth, and some of the recent data had been slightly more positive. The Federal Reserve was expected to begin the process of raising its policy interest rate later this year, but some other major central banks were continuing to ease policy. Commodity prices had been mixed over the month and little changed overall, and were significantly lower than a year earlier.

Domestically, the available data suggested that output growth had continued at a below-trend pace over the past year and would remain a little below trend in the period ahead before picking up to around trend in the latter part of 2016. The national accounts data for the March quarter were expected to show that the key forces operating on the economy were much as they had been for some time. After picking up late last year, growth of household expenditure was expected to have remained strong, supported by low interest rates and strong population growth. Conditions in the housing market in Sydney and parts of Melbourne had remained very strong, though trends were more mixed in other cities. Survey-based measures of business conditions had remained around average levels. There continued to be spare capacity in labour and product markets, although there had been some improvement in labour market conditions over the past six months or so. Inflationary pressures remained well contained and were likely to remain so in the period ahead.

The exchange rate was close to the lowest levels seen earlier in the year, but members noted that the current level of the exchange rate, particularly on a trade-weighted basis, continued to offer less assistance than would normally be expected in achieving balanced growth in the economy. A further depreciation therefore seemed both likely and necessary, particularly given the significant declines in commodity prices over the past year.

Overall, in assessing domestic conditions and the international environment, the Board’s assessment was that the stance of monetary policy should be accommodative. Having eased policy at the previous meeting, members judged that it was appropriate to leave the cash rate unchanged and to assess information on economic and financial conditions as it became available. These data would inform the Board’s assessment of the state of the economy and the outlook and hence whether the current stance of policy would most effectively foster sustainable growth and inflation consistent with the target.

The Decision

The Board decided to leave the cash rate unchanged at 2.0 per cent.

US Industrial Production Wobbles

According to the FED, industrial production decreased 0.2 percent in May after falling 0.5 percent in April. The decline in April was larger than previously reported, but the rates of change for previous months were generally revised higher, leaving the level of the index in April slightly above its initial estimate. Manufacturing output decreased 0.2 percent in May and was little changed, on net, from its level in January. In May, the index for mining moved down 0.3 percent after declining more than 1 percent per month, on average, in the previous four months. The slower rate of decrease for mining output last month was due in part to a reduced pace of decline in the index for oil and gas well drilling and servicing. The output of utilities increased 0.2 percent in May. At 105.1 percent of its 2007 average, total industrial production in May was 1.4 percent above its year-earlier level. Capacity utilization for the industrial sector decreased 0.2 percentage point in May to 78.1 percent, a rate that is 2.0 percentage points below its long-run (1972–2014) average.

Probably not enough negative news to hold off on interest rates rises in the US later in the year, but was enough to drive the markets lower overnight.

Real Wages Show US Economy is Stronger Than You Think

From The Conversation. Last month’s US employment report, released on Friday, contained a lot of good news.

First, monthly jobs growth exceeded expectations, as employers hired 280,000 people. Second, the labor force participation rate ticked up, indicating that people who had stopped looking for work were becoming more optimistic about finding a job and thus had resumed their search for one.

Finally, average hourly earnings for all production and non-supervisory workers in the private sector grew by 2%, compared with May 2014.

Some people may question why wage growth of 2% would be considered good news. The reason is there was no rise in prices over that period, so the average real wage also grew by about 2%. And it is the real wage, rather than nominal pay without accounting for inflation, that ultimately determines the living standards of the American worker.

While the first two highlights from the jobs report are indeed good news, this last one might be its most important takeaway – though it’s been true for a few months now. We’ve been reading articles for years about how stagnant wages have been without focusing on the impact of the lack of inflation. In other words, while we’re not making a lot more money, it should feel like more because consumer prices have barely budged since the financial crisis – by that measure, wages for most workers are the highest they’ve been in decades.

This matters because it suggests the economy is in better shape than we think and may be what the Federal Reserve has in mind as it considers raising rates this year, with many (including the International Monetary Fund) urging the central bank to wait until 2016.

One of the biggest risks, however, concerns productivity, which is truly stagnant. That and take-home pay are highly correlated, so if productivity doesn’t pick up, the rise in real wages may well evaporate.

The real wage story

The consumer price inflation data for May will not be released until later this month, so the balance of this essay will focus on the real wage rate in the private sector through April – although I would not expect the story to change once we can evaluate the latest data. (Hourly wage data for government workers are not available.)

I would also like to focus on the economic prospects of middle- and lower-income workers, so I will be looking at the earnings of those in production and non-supervisory roles. This group accounts for 82% of all private sector workers, who on average earned US$20.91 an hour in April.

The average hourly real wage for this group since 2007 is shown below (converted to April 2015 dollars). The shape of this graph undoubtedly will surprise many readers given the widely held believe that the middle class has been falling behind economically.

Real wages are now the highest since 1979. Bureau of Labor Statistics

The average hourly real wage did decline during the “Great Recession” and again in 2011 and 2012, but since falling to its recent low of $20.17 in October 2012 it has increased, first at a modest pace and then more rapidly since September as price inflation disappeared.

Perhaps even more surprising for most people is that the average real wage for these employees is now at the highest level since March 1979, although it is still 8.2% below the all-time peak ($22.27) reached in January 1973.

The average real wage for middle-class workers declined during the second half of the 1970s, the 1980s and the first half of the 1990s, reaching a low of $17.97 in April 1995 (data go back to 1964). Since then, wages have tended to slowly increase, with the largest gains when price inflation disappears and the greatest losses occurring when it spikes upward.

Widespread gains

That brings us back to the most recent figures. During the 12 months through April, average hourly real earnings for production and non-supervisory workers increased by 2%. These wage gains are fairly widespread among industries, as is shown in this table.

Real wages are up across the board over the past year through April. Bureau of Labor Statistics

Moreover, the greatest wage gains occurred in some of the lowest-wage industries: in retail trade (up 2.3%), accommodations (4.6%), full-service restaurants (4.7%) and fast food restaurants (3.7%). Clearly some of the lowest-paid workers in America have enjoyed some very substantial real wage gains during the past year.

Real wage gains have also far outstripped productivity gains. From the first quarter of 2014 to the first quarter of this year (most recent data), labor productivity in the non-farm business sector increased by only 0.3%, compared with real wage growth of 1.9% for private sector production and non-supervisory workers over the same period.

The poor rate of productivity growth has been a feature of the current economic recovery. Over the past five years, from the first quarter of 2010 to the first quarter of 2015, output per labor hour has increased by only 2.8%, or 0.6% per year. Over the long run, productivity growth puts a cap on the maximum rate of growth in the real hourly wage rate – meaning if productivity doesn’t start rising, neither will wages.

Why real wage growth is poorly understood

So why are people so convinced that middle- and low-wage workers have been losing ground?

Many people point to the fact that the real hourly wage is less than it was in 1973, but that reflects the decline that occurred between 1973 and 1995. Since then, the average hourly wages have been on a slow upward trend, averaging 0.76% per year – not much, but positive all the same. And as I’ve shown, those gains accelerated in the past year year, with even larger ones in lower-wage industries.

Perhaps the recent wage gains have yet to sink into people’s consciousness, and thus their assessment of the economy will shortly improve. Also, millions of people are still unemployed or have dropped out of the labor force, and their income has not benefited from the increase in average wages.

Or perhaps people are unhappy because they are comparing their financial situation with higher-income households, who have done even better, although income inequality is only slightly worse than it was in 2000, when the middle class seemed much happier (see the excellent work of Berkeley’s Emmanuel Saez).

Or maybe it’s something as simple as our spending desires outpacing the growth in the real wage rate. People clearly were spending a lot of borrowed money through 2007, when the financial crisis sharply curtailed many people’s ability to borrow and spend.

What I do know, however, is that unless productivity growth improves, the real wage gains that the data show will prove fleeting. And then we really will be in a world of hurt.

Author – Donald R Grimes, Senior Research Associate, Institute for Research on Labor, Employment and the Economy at University of Michigan

Greece Must Accept Reform Proposals Before Time Runs Out

From The Conversation. The Greek government and its international creditors remain at an impasse over the reforms Greece must accept to receive the bail-out it needs to sustain itself in the coming months. The decision to postpone its June 5 IMF debt repayment and reject a set of reforms put forward by the EU Commission president, Jean-Claude Juncker has sparked debate about Greece’s ability to honour its commitments to international creditors.

The back-and-forth exchange of proposals continues, with the Greek prime minister, Alexis Tsipras – now a regular fixture in Brussels – meeting his French and German counterparts today. The need to agree becomes increasingly important for both Greece and the eurozone as the days pass. The current bail-out deal runs out at the end of June and without the further €7.2 billion from the EU and IMF, the Greek government runs the risk of not being able to sustain itself.

Though time is running out, I believe they will eventually strike an agreement. What it will look like, however, is rather opaque. In light of Syriza’s tactics so far and the weakness of Greece’s position, the need to accept what its creditors are offering is increasingly the only solution.

Punching above its weight

When Syriza came to power last January, it promised to deviate from the path of austerity and renegotiate the bail-out programme. It was truly punching above its weight. But in the context of the Greek population having suffered prolonged periods of austerity with no real signs of recovery, it rode the spirit of populism and promised that it could deliver an alternative programme.

A proposition that scrapped austerity, however, has not come to fruition. In fact, the Greek government has not been able to implement large sections of its electoral agenda – mainly due to a lack of funds, but also because the new government needed breathing space as new and inexperienced political actors came to the forefront.

Ultimately, amateur handling of domestic policies and international negotiations by prominent government ministers, such as the finance minister, Yanis Varoufakis, and the foreign minister, Nikolaos Kotzias, internal disagreement over where to focus their precious few resources and an over-reliance on the perceived charisma of Alexis Tsipras have left the government with little to show for its efforts so far.

Charisma can only get you so far. EPA/Yannis Kolesidis

Negotiations with creditors have not managed to turn European partners in favour of the Greek government’s positions. Instead the episode has demonstrated a further demise of the country’s already tarnished image as an unreliable and stubborn partner. Recent statements by high-level EU officials demonstrate well the frustration over the inability of the Greek government to deliver concrete and realistic solutions.

Political game playing

So where does this state of play leave the Greek government? As time is running out and the country’s economic position deteriorates, it is expected that the range of available alternative measures will diminish. Some of the reforms Syriza is proposing on pensions and privatisation require significant time to implement and yield the necessary economic results. Greece does not have that luxury.

There is a strong game of political communication taking place in front of the general public. Not only is Syriza trying to hold together its political mandate and appease a Greek electorate which vested its hopes in the party, but it is also up against internal opposition within the Greek parliament. This has become progressively louder and more visible – arguing for example in favour of a referendum of the proposed agreement with the EU.

Greeks are hoping for a speedy resolution. EPA/Orestis Panagiotou

Nevertheless, the Greek government under Syriza has not received a mandate from its electorate to take the country out of the eurozone. Thus, Syriza is not expected to go head to head with the EU on a full rupture of relations, something it will become extremely difficult to justify domestically.

Meanwhile Europe is trying to hold firm and press Greece to meet its bail-out obligations – to maintain the cohesion of the eurozone and protect the rest of the EU. At the same time, leaders (including Angela Merkel and Francois Hollande) also need to justify their decisions to their own domestic electorates, who are becoming increasingly uneasy.

For all the anxiety, the solution is crystal clear. In order for Greece to move forward, the Greek government needs to take up the opportunity being offered it, accept the political cost domestically and help return the international dignity and standing of the country.

Author Theofanis Exadaktylos Lecturer in European Politics at University of Surrey


Unemployment Rate Falls to 6%

According to the ABS data, released today, Australia’s estimated seasonally adjusted unemployment rate for May 2015 was 6.0 per cent, a decrease of 0.2 percentage points (based on unrounded estimates) from a revised 6.1 per cent for April 2015. In trend terms, the unemployment rate decreased less than 0.1 percentage points to 6.0 per cent.

The seasonally adjusted labour force participation rate was unchanged at 64.7 per cent in May 2015 from a revised April estimate.

The ABS reported the number of people employed increased by 42,000 to 11,759,600 in May 2015 (seasonally adjusted). The increase in employment was driven by increases in part-time employment for females (up 29,800) and full-time employment for males (up 15,900).

The ABS seasonally adjusted aggregate monthly hours worked series increased in May 2015, up 2.2 million hours (0.1 per cent) to 1,631.8 million hours.

The seasonally adjusted number of people unemployed decreased by 22,000 to 745,200 in May 2015. This was driven by unemployed people who looked for full-time work, which decreased by 23,500 to 514,500.

The seasonally adjusted underemployment rate was 8.5 per cent in May 2015, unchanged from February 2015. Combined with the unemployment rate of 6.0 per cent, the latest seasonally adjusted estimate of total labour force underutilisation was 14.5 per cent in May 2015, a decrease of 0.4 percentage points from February 2015.

RBNZ Drops Cash Rate To 3.25%

Statement by NZ Reserve Bank Governor Graeme Wheeler:

The Reserve Bank today reduced the Official Cash Rate (OCR) by 25 basis points to 3.25 percent.

Growth in the global economy remains moderate. Data on economic activity in the US, China and Australia has been mixed, although there has been some improvement in the euro area and Japan. Volatility in financial markets has increased.

The New Zealand economy is growing at an annual rate around three percent, supported by low interest rates, high net migration and construction activity, and the decline in fuel prices. However, the fall in export commodity prices that began in mid-2014 is proving more pronounced. The weaker prospects for dairy prices and the recent rises in petrol prices will slow income and demand growth and increase the risk that the return of inflation to the mid-point would be delayed.

Inflation has been low due to falling import prices and the strong growth in the economy’s supply potential. Wage inflation and inflation expectations have been subdued.

With the fall in commodity prices and the expected weakening in demand, the exchange rate has declined from its recent peak in April, but remains overvalued. A further significant downward adjustment is justified. In light of the forecast deterioration in the current account balance, such an exchange rate adjustment is needed to put New Zealand’s net external position on a more sustainable path.

House prices in Auckland continue to increase rapidly, and increased supply is needed to address this. The proposed LVR measures and the Government’s tax initiatives planned for 1 October 2015 should ease the impact of investor activity.

A reduction in the OCR is appropriate given low inflationary pressures and the expected weakening in demand, and to ensure that medium term inflation converges towards the middle of the target range.

We expect further easing may be appropriate. This will depend on the emerging data.

Aligning Growth Policy Levers

Glenn Stevens gave an address to the Economic Society of Australia in Brisbane where he discussed the need to align policy levers to drive growth and the limits of monetary policy.

The latest edition of the Australian National Accounts, released last week, shows the picture. The quarterly growth figure was stronger than what had been embodied in our forecasts in the May Statement on Monetary Policy, though that comes after a weaker-than-expected outcome in the previous quarter. Some of the strength resulted from unusually high export shipments of resources, which were less disrupted by weather conditions in the ‘cyclone season’ than has often been the case in the past. Indications are that this pace of growth wasn’t repeated in the June quarter, when shipments of coal in particular were affected by weather disruptions on the east coast.

Taking the results over the past four quarters, growth was ‘below trend’. Export volume growth contributed strongly, while domestic final demand increased by a bit under 1 per cent, which is quite a weak result. Housing construction rose strongly, and consumer spending over the year rose by more than real household income (that is, the saving rate fell). Both these results owe a good deal to low interest rates and rising asset values.

But other components of demand were weak. Business investment fell substantially, with mining investment falling quickly and, as best we can tell, non-mining capital spending also weak. Public final spending didn’t grow at all. Public investment spending fell by 8 per cent over the past year.

Overall, these outcomes are weaker that what, two years ago, we expected would be happening by now. Back then, the two-year-ahead forecast was for annual GDP growth to be in a range of 2½ to 4 per cent by mid 2015. The width of that range reflected the normal size of error margins, coupled with the inevitable uncertainty about the timing of when some components of demand outside of mining might strengthen, and the judgement that if accommodative monetary policy really was held in place for several years (which was a key assumption behind those forecasts), activity could at some point start to pick up quite quickly. It will be three months before we get the national accounts data for the June quarter, but at this point, with three of the four quarters available for the year to June 2015, it would appear that the outcome will be either right at the bottom of the range predicted two years ago or, more likely, a bit below it.

Of course, forecasts are hardly more than educated guesswork and two-year-ahead forecasts are even less reliable. That there are inevitably forecast errors is neither surprising nor new, and it is not any more concerning per se now than it always has been. This is far from the biggest forecast error I’ve seen over my three decades in this game.

But it is nonetheless useful to see what we can learn from those errors.

The following points are prominent:

  • The terms of trade, which two years ago were assumed to fall, have in fact fallen further – they are about 12 per cent lower than the assumed path. That means national income is lower, which means spending power is lower.
  • The exchange rate, which at that time was above parity against the US dollar, and was assumed to stay there, is now about 25 per cent lower. It has moved in the same direction as the terms of trade, which is normal.
  • The lower exchange rate has helped to produce a contribution to growth from ‘net exports’ much greater than earlier forecast, while that from domestic demand has been much weaker. The latter is mainly spread across non-mining business investment and weaker government spending, together with softer consumption on account of lower incomes. One thing which is not very different from the forecast from two years ago is that mining sector capital spending is falling sharply.
  • Because the net effect of the above factors is that GDP growth has been on the weaker side of expectations, the unemployment rate is about half a percentage point higher than forecast two years ago. Consistent with that, growth in wages is, as you would expect, lower than forecast.
  • Headline inflation is lower than forecast, largely because of the recent fall in oil prices. Underlying inflation is within the 2–3 per cent range that had been forecast. Again, the depreciation of the exchange rate has been a factor here.
  • The cash rate is 75 basis points lower than assumed two years ago, as monetary policy has used the room provided by contained inflation to try to do more to help growth. Lending rates have fallen on average by about 100 basis points over that period. This has produced a stronger result for housing construction than forecast and will also have contributed to the rise in dwelling prices.

In summary, the economy has in several important respects followed a different track from the one expected a couple of years ago. That is partly because conditions in the world economy were different from what had been expected and partly because several domestic factors were different.

Some in-built responses have been in evidence. For example the decline in the exchange rate, even if not by as much as we might have expected, has had the effect of supporting growth and keeping inflation from falling as much as it might have done. And, of course, monetary policy has also responded to the evolving situation, consistent with the Reserve Bank’s mandate. These responses have had the effect of lessening the extent to which growth and inflation have differed from the outcomes expected two years ago, but haven’t managed to eliminate those differences entirely, at least in the case of output growth.

The slowing in wage growth in response to soft labour market conditions has also undoubtedly helped to hold employment up. In fact wage growth appears to be somewhat lower than previous relationships between wages and unemployment would suggest. This may be a sign of increased price flexibility in the labour market and could help to explain why employment recently has looked a little higher relative to estimated GDP than might have been expected. These hypotheses can be advanced only tentatively, though, until we have more data.

Looking ahead, the most recent forecasts suggest that growth rates will be similar to those we have observed recently for a while yet. Residential investment will reach new highs over the period ahead. Household consumption is expected to record moderate growth. With national income growth reduced by a falling terms of trade, this requires a modest decline in the saving rate. It doesn’t seem reasonable to expect much more from consumption growth than that.

Resources sector investment has a good deal further to fall yet over the next two years. Other areas of investment seem very low and while I would have expected that by now these would have been showing signs of strengthening, the most recent indications are for, if anything, a weakening over the year ahead. Public final spending has not been growing and fiscal consolidation still has some way to run. Under the current macroeconomic conditions, it would seem inappropriate for governments to seek additional restraint here in the near term.

Inflation is likely to remain low. Growth in labour costs is very low and some of the forces that were pushing up certain administered prices have started to reverse. So even if the exchange rate were to fall further, which in my view it needs to, we seem unlikely to have a problem with excessive inflation.

Putting all that together, as things stand, the economy could do with some more demand growth over the next couple of years.

Of course, these are forecasts. They might be wrong. In fact, they will be wrong, in some dimension or other. Our published material goes to some lengths to articulate a range of ‘risks’. It is easy to think of ‘downside’ ones in the current mood of determined pessimism.

But it is not entirely impossible to think of upside ones as well. A further fall in the exchange rate, which is not assumed in the forecasts, would add both to growth and prices. If one thinks that such a decline at some point is likely, that constitutes an ‘upside’ risk. Of course, the list of countries that would prefer a lower exchange rate is a long one and we can’t all have it.

That being so, we might give some thought to trying to create some upside risks to the growth outlook through policy initiatives. The Reserve Bank will remain attuned to what it can do, consistent with the various elements of its mandate – including price stability, full employment and financial stability. We remain open to the possibility of further policy easing, if that is, on balance, beneficial for sustainable growth.

The temptation, of course, is to presume outcomes can be fine-tuned by policy settings and that we can simply dial up more or less demand in short order to avoid deviations from some ideal path. Reality is inevitably more messy than that and has not always been kind to such fine-tuning notions. As it is, some observers think monetary policy has done too little, while others think it already has done way too much. I think it has been about right for the circumstances.

But the bigger point is that monetary policy alone can’t deliver everything we need and expecting too much from it can lead, in time, to much bigger problems. Much of the effect of monetary policy comes through the spending, borrowing and saving decisions of households. There isn’t much cause from research, or from current data, to expect a direct impact on business investment. But of all the three broad sectors – households, government and corporations – it is households that probably have the least scope to expand their balance sheets to drive spending. That’s because they already did that a decade or more ago. Their debt burden, while being well serviced and with low arrears rates, is already high. It is for this reason that I have previously noted some reservations about how much monetary policy can be expected to do to boost growth with lower and lower interest rates. It is not that monetary policy is entirely powerless, but its marginal effect may be smaller, and the associated risks greater, the lower interest rates go from already very low levels. I think everyone can see that.

If I am correct about this, it really is very important that other policies coalesce around a narrative for growth. In this regard, I think the Government is on the right track in not seeking to compensate for lower revenue growth by cutting spending further in the short run. Of course, some resolution of long-run budget trends is still going to be needed to sustain confidence and that will not be an easy conversation.

Meanwhile, as often remarked, infrastructure spending has a role to play in sustaining growth and also in generating confidence. I am doubtful of our capacity to deploy this sort of spending as a short-term countercyclical device. The evidence of history is that it takes too long to start and then too long to stop. But it would be confidence-enhancing if there was an agreed story about a long-term pipeline of infrastructure projects, surrounded by appropriate governance on project selection, risk-sharing between public and private sectors at varying stages of production and ownership, and appropriate pricing for use of the finished product. The suppliers would feel it was worth their while to improve their offering if projects were not just one-offs. The financial sector would be attracted to the opportunities for financing and asset ownership. The real economy would benefit from the steady pipeline of construction work – as opposed to a boom and bust. It would also benefit from confidence about improved efficiency of logistics over time resulting from the better infrastructure. Amenity would be improved for millions of ordinary citizens in their daily lives. We could unleash large potential benefits that at present are not available because of congestion in our transportation networks.

The impediments to this outcome are not financial. The funding would be available, with long term interest rates the lowest we have ever seen or are likely to. (And it is perfectly sensible for some public debt to be used to fund infrastructure that will earn a return. That is not the same as borrowing to pay pensions or public servants.) The impediments are in our decision-making processes and, it seems, in our inability to find political agreement on how to proceed.

Physical infrastructure is, of course, only part of what we need. The confidence-enhancing narrative needs to extend to skills, education, technology, the ability and freedom to respond to incentives, the ability to adapt and the willingness to take on risk. It is in these areas too, where there are various initiatives in place or planned, but which often do not get enough attention, that we need to create a positive dynamic of confidence, innovation and investment.

That is the upside we need to create.