Retail turnover rose 0.4 per cent in August 2015

The latest Australian Bureau of Statistics (ABS) Retail Trade figures show that Australian retail turnover rose 0.4 per cent in August following a fall of 0.1 per cent in July 2015, seasonally adjusted.

In seasonally adjusted terms the largest contributor to the rise was food retailing (0.6 per cent). Other retailing (1.3 per cent), department stores (1.3 per cent) and household goods retailing (0.2 per cent) also rose. There were falls in clothing, footwear and personal accessory retailing (-1.4 per cent) and cafes, restaurants and takeaway food services (-0.3 per cent).

In seasonally adjusted terms there were rises in Victoria (0.9 per cent), New South Wales (0.5 per cent), Western Australia (0.2 per cent), South Australia (0.3 per cent) and Tasmania (0.4 per cent). There were falls in Queensland (-0.2 per cent), the Northern Territory (-0.9 per cent) and the Australian Capital Territory (-0.4 per cent).

The trend estimate for Australian retail turnover rose 0.2 per cent in August 2015 following a 0.3 per cent rise in July 2015. The trend estimate for August 2015 is 4.3 per cent higher compared to August 2014.

Online retail turnover contributed 3.1 per cent to total retail turnover in original terms.

IMF Report On Australia Shows Work Is Needed

The IMF released their latest review of Australia. They expect growth to remain under trend to 2.8% in 2020, house prices to remain high along with household debt, household savings to fall, and the cash rate to fall before rising later. Mining investment will continue to fall, and non mining investment to rise, with a slow fall in unemployment to 5.5% by 2020. They supported the FSI recommendations for banks to hold more capital. They cautioned that if investor lending and house price inflation do not slow appreciably, these policies may need to be intensified.

On September 14, the Executive Board of the International Monetary Fund (IMF) concluded the 2015 Article IV consultation1 with Australia.

Australia has enjoyed exceptionally strong income growth for the past two decades, supported by the boom in global demand for Australia’s natural resources and strong policy frameworks. However, the economy is now facing a large transition as the mining investment boom winds down and the terms of trade has fallen back. Growth has been below trend for two years. Annualized GDP growth was around 2.2 percent in the first half of 2015, with particularly weak final domestic demand, and declining public and private investment. Capacity utilization and a soft labor market point to a sizeable output gap. Nominal wage growth is weak, contributing to low inflation.

The terms of trade has fallen sharply over the past year. Iron ore prices have fallen by more than a third and Australia’s commodities prices are down by around a quarter since mid-2014. The exchange rate has depreciated further in recent months following news about economic and financial market developments in China. This has significantly reduced the likely degree of exchange rate overvaluation and should help support activity. Although the current account deficit narrowed to 2.8 percent of GDP in 2014 as mining-related imports declined, it is expected to widen somewhat in 2015.

With subdued inflation pressure, and a weaker outlook, the Reserve Bank of Australia (RBA) cut its policy rate by a further 50bps in the first half of 2015 to 2 percent. While housing investment has picked up strongly, consumer confidence indicators and investment expectations remain muted. Consumption growth has also been moderate reflecting weak income growth. But low interest rates have pushed up asset prices. Overall house price inflation is close to 10 percent, but is around 18 percent in Sydney. Buoyant housing investor lending has recently prompted regulatory action to reinforce sound residential mortgage lending practices.

Fiscal consolidation has become more difficult and public debt is rising, albeit from a low level. Lower export prices and weak wage growth are denting nominal tax revenues; unemployment is adding to expenditures. The national fiscal deficit remained at 3 percent in fiscal year

(FY, July–June) 2014/15, broadly unchanged from the previous year. The FY 2015/16 Budget projects a return to surplus in 2019–20. The combination of tightening by the States and the commonwealth implies an improvement in the national cyclically-adjusted balance by some 0.7 of a percent of GDP on average over the next three years.

Executive Board Assessment

Executive Directors commended Australia’s strong economic performance over the past two decades, which has been underpinned by sound policies, the flexible exchange rate regime, earlier structural reforms, and a boom in the global demand for resources. They noted, however, that declining investment in mining and a sharp fall in the terms of trade are posing macroeconomic challenges, while potential growth is likely to slow in the period ahead. Accordingly, Directors agreed that continued efforts to support aggregate demand and raise productivity will be critical in transitioning to a broader-based and high growth path.

Directors noted that a supportive policy mix is needed to facilitate the structural changes underway. With a still sizeable output gap and subdued inflation, most Directors agreed that monetary policy is appropriately accommodative and could be eased further if the cyclical rebound disappoints, provided financial risks remain contained. Directors also noted that the floating exchange rate provides an important buffer for the economy.

Directors broadly agreed that a small surplus should remain a longer-term anchor of fiscal policy. In this regard, many Directors supported the authorities’ planned pace of adjustment, which they viewed as striking the right balance between supporting near-term activity and addressing longer-term spending commitments. Some Directors, however, considered that consolidation could be somewhat less frontloaded, given ample fiscal space. Directors broadly concurred that boosting public investment would support demand, take pressure off monetary policy, and insure against downside risks. In this context, they welcomed the authorities’ continuing to establish a pipeline of high-quality projects.

Directors highlighted that maintaining income growth at past rates and boosting potential growth would require higher productivity growth. They expressed confidence that this could be achieved, given Australia’s strong institutions, flexible economy, track record of undertaking comprehensive structural reforms, and the opportunities created by Asia’s rapid growth. Nonetheless, further reforms in a variety of areas will be required. In this regard, Directors noted the findings of the Competition Policy Review and looked forward to their implementation. Furthermore, addressing infrastructure needs will relieve bottlenecks and housing supply constraints. Directors also encouraged a shift toward more efficient taxes, while ensuring fairness.

Directors supported the recommendations of the Financial System Inquiry. They noted that while banks are sound and profitable, significantly higher capital would be needed in a severe adverse scenario to ensure a fully-functioning system. Accordingly, they welcomed the authorities’ commitment to make banks’ capital “unquestionably strong” over time. To address risks in the housing market, Directors supported targeted action by the regulator. They cautioned that if investor lending and house price inflation do not slow appreciably, these policies may need to be intensified.

Building Approvals Fall Again

Australian Bureau of Statistics (ABS) Building Approvals data shows that the number of dwellings approved fell 0.7 per cent in August 2015, in trend terms, and has fallen for five months.

Dwelling approvals decreased in August in Tasmania (6.8 per cent), Victoria (4.2 per cent), Western Australia (1.8 per cent), Northern Territory (0.6 per cent) and Queensland (0.2 per cent) but increased in the Australian Capital Territory (8.1 per cent), South Australia (4.5 per cent) and New South Wales (1.4 per cent) in trend terms.

In trend terms, approvals for private sector houses fell 0.1 per cent in August. Private sector house approvals rose in Queensland (2.0 per cent), New South Wales (0.4 per cent) and South Australia (0.2 per cent) but fell in Western Australia (2.8 per cent). Private house approvals were flat in Victoria, in trend terms.

The value of total building approved rose 0.8 per cent in August, in trend terms, and has risen for four months. The value of residential building rose 0.2 per cent while non-residential building rose 2.1 per cent in trend terms.

High Government Debt is Here to Stay – Fitch

There can be no meaningful reductions in government debt without stronger economic growth and better primary balances says Fitch Ratings in their Global Perspectives Series.

The dramatic increase in advanced economies’ government debt due to the financial crisis was quick, but its reduction in most countries will be very slow. Conditions that would facilitate rapid debt reduction appear unlikely to take hold.

In the absence of one-off factors such as privatisation receipts directed at paying down debt or – in extreme cases – agreements with creditors to reduce the debt stock, changes in government debt/GDP ratios depend on the primary balance, the effective interest rate on the debt and economic growth. These three variables form the classic government debt dynamics equation, and encompass all policy “solutions” to high debt, such as fiscal austerity (running a stronger primary position), inflating debt away (high nominal GDP growth relative to interest rates) or growing out of a debt problem (high real and nominal GDP growth relative to interest rates).

Much of the contemporary policy debate surrounding high government debt in Europe centres on the desirability and effectiveness of fiscal austerity. One argument is that it is self-defeating, especially when an economy is weak and growth is fragile – as is typical after a crisis – because the contractionary measures necessary to improve the primary balance will pull growth even lower. The absence of inflation, as we are seeing now, may supplement the view that demand is simply too weak to sustain another negative knock.

A counterargument contends that a tighter fiscal position ultimately fosters growth, first by boosting confidence that post-crisis policymakers are following a more prudent path, supporting private investment, and second by allowing for an increase in the flow of financial resources to the private sector, where they can be more efficiently and effectively deployed.

The austerity debate has largely overlooked how well this approach has worked in the past, and under what conditions. The dataset accompanying Mauro, Romeu, Binder and Zaman’s A Modern History of Fiscal Prudence and Profligacy, IMF Working Paper No. 13/5, provides a useful historical overview, as it contains data on government debt, GDP growth, primary balances and real long-term interest rates for more than 50 countries since 1800, where data availability permits. The episodes of meaningful debt reduction (debt falling 10 percentage points of GDP or more over a five-year period) in advanced economies since 1970 highlight the modern debt dynamics conditions that facilitated such declines, allowing an assessment of whether they might be replicable today.

In 1970-2011 there were 22 instances in 16 countries of government debt falling by 10 percentage points of GDP or more over a five-year period. On average during these episodes, governments ran primary surpluses of 4% of GDP, real economic growth was 3.6% and real interest rates were 3%. We may consider these figures debt dynamics benchmarks.

A comparison of the current and forecast debt dynamics of highly indebted (greater than 60% of GDP) advanced economies with these benchmarks, combining Fitch estimates of effective interest rates and IMF World Economic Outlook forecasts to 2020 for growth and primary balances, reveals that interest rates align favourably with the benchmark, but economic growth and primary balances are typically too low.

The only countries in this exercise forecast to have meaningful reductions in government debt are Iceland and Ireland, both of which are projected to run primary surpluses consistently of 2%-3% of GDP. Japan and Slovenia fare the worst, with debt expected to be higher in 2020 than in 2015. Most other countries are somewhere in between, with reductions in government debt of 5-10 percentage points of GDP, predicated on stronger growth and better primary outturns.

Need for Stronger Growth and Primary Balances 

The policy implications of this review are clear, if difficult to address. For better debt dynamics, the current low level of interest rates must be accompanied by larger fiscal adjustments to improve primary balances, or stronger growth, or both. Enhancing growth prospects may prove difficult. Private debt is still at historically high levels in many countries, reducing the impact of accommodative monetary policies. Advanced economies with “productivity puzzles” abound, and export-led growth, while alluring, cannot be pursued universally, particularly in the context of the profound weakness in global trade flows.

This brings us back to the austerity debate, which is unresolved as yet, but with plenty of supporters on both sides. The situation will become more urgent if neither growth nor primary balances were stronger by the time long-term interest rates eventually begin to rise, at which point all three debt dynamics variables could be working against lower government debt ratios.

If high public debt is here to stay, as seems probable, so too are the consequences. Governments will be less able to enact specific countercyclical fiscal measures, possibly amplifying the next downward shift in the economic cycle and resulting in even higher debt. Policymakers will also find themselves in unfavourable starting positions should the need arise to respond to other potential strains on public finances, such as systemic financial sector stress or a catastrophic event. For the advanced economies as a whole, the probability of debt continuing to climb over the next several years may be at least as high as that of meaningful debt reduction.

Australian Population Growth Is Slowing

The ABS demographic data released today to March 2015 shows that Australia’s population growth rate has slowed to a rate last seen nearly 10 years ago to  1.4% during the year ended 31 March 2015.  Slowing growth, and the aging of the population are both drag anchors to future growth.

The total population was 23,714,300 people. This reflects an increase of 316,000 people since 31 March 2014, and 93,900 people since 30 December 2014. All states and territories recorded positive population growth.

Natural increase and net overseas migration (NOM) contributed 45% and 55% respectively to total population growth for the year ended 31 March 2015.

Victoria recorded the highest growth rate of all states and territories at 1.7% or 97,500 people. Victoria and Queensland were the only states recording a net gain from interstate migration

The Northern Territory a recorded the lowest growth rate at 0.2%, its lowest growth rate in 11 years. This is 80 per cent lower than that of March 2014. Net interstate migration losses were the greatest contributor to this slower growth, with the territory recording its largest ever interstate migration loss in the year to March 2015.

Western Australia also recorded slower growth. In the past two years, net overseas migration to the state has dropped by 71 per cent, while net interstate migration has dropped to the point where the state has seen a net interstate loss. This has not been seen in over 10 years in this state.

The preliminary estimate of natural increase recorded for the year ended 31 March 2015 (142,900 people) was 9.7%, or 15,400 people lower than the natural increase recorded for the year ended 31 March 2014 (158,300 people). The preliminary estimate of NOM recorded for the year ended 31 March 2015 (173,100 people) was 16.0%, or 33,000 people lower than the net overseas migration recorded for the year ended 31 March 2014 (206,100 people).

NZ’s Estimation of a Neutral Interest Rate

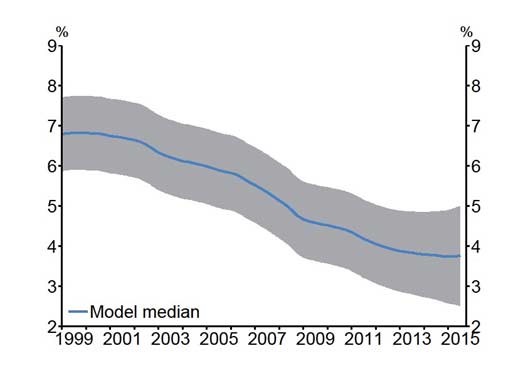
The Reserve Bank of New Zealand has today published a paper in its Analytical Notes series on Estimating New Zealand’s neutral interest rate. In the paper they run through a number of different methods to derive this indicator rate, and observe the mean is 4.3%. Strikingly this mean rate has been falling for a number of years, and is a further indicator of lower rates around the world.

It is important for the Reserve Bank of New Zealand to understand the extent to which current monetary policy settings are either contractionary or expansionary with respect to the macroeconomy. As a benchmark for this analysis, the Bank estimates a level of the nominal 90-day bank bill rate that it believes is neither expansionary nor contractionary. This benchmark interest rate is termed the ‘neutral interest rate’.

The neutral interest rate is unobservable and significant judgement is required to assess its current level. The Bank continually monitors the economy for possible changes in the neutral interest rate. This includes a broad assessment of consumer attitudes towards debt and risk, the economy’s potential growth rate, and international developments. Signs that the neutral rate may be changing are initially incorporated into the Bank’s risk assessment when setting policy. If the economy shows clear signs of a change in the neutral interest rate, the Bank will formally change its estimate in its various modelling frameworks.

The Bank looks at a range of model-, survey-, and market-based estimates of the neutral rate to help inform this ongoing judgement. This paper outlines the methodology the Bank uses to arrive at these model-, survey-, and market-based estimates. The Bank currently uses five key methods to help inform judgements about the neutral interest rate. These include:

• a neo-classical growth model;
• implied market expectations of long-horizon interest rates;
• analysts’ expectations of long-horizon interest rates;
• analysts’ expectations of long-horizon annual nominal economic growth; and,
• a small New Keynesian model.

These estimates suggest the nominal neutral 90-day interest rate sits between 3.8 and 4.9 percent currently. The mean of these indicators is 4.3 percent.

RBNZ-Neutral-RatesThe Bank currently judges that the nominal neutral 90-day interest rate sits at 4.5 percent – within the range of estimates and close to the mean of these estimates. This implies that current monetary policy settings are expansionary, although these models highlight some emerging risk that the neutral interest rate is falling further. The Bank will continue to use these five methods, along with broader monitoring of the economy, to help identify any possible changes in the neutral interest rate. Furthermore, the Bank will continue to look for ways to improve its estimates, including the development of other estimation methodologies.


From ‘debt and deficit’ to ‘building prosperity’: what’s needed to shift the economic narrative

From The Conversation.

So, new Australian Prime Minister Malcolm Turnbull wants to have a “conversation” with the Australian people and “explain” policies in a way that respects our intelligence. Excellent. He will be better at this than Abbott, and new Treasurer Scott Morrison will be better than Joe Hockey.

Turnbull began the conversation on Sunday in announcing his new ministry. In this speech he used the term “prosperity” in one form or another (including “prosperous”) at least three times. This is interesting and welcome. We hear about “growth” and “productivity” but hardly anyone understands what they mean and why they are important. Prosperity is a term that captures those ideas in a way people can better understand. He didn’t define prosperity but let me suggest he is talking about living standards.

The best indicator of living standards is national income per person which has grown at an average rate of 2.3% over the past 40 years, but has fallen sharply in recent years. In fact the growth rate has been negative in recent years meaning living standards have actually fallen.

There are three principal drivers of living standards and they are all going in the wrong direction: labour productivity which has fallen from historic average of 2% growth to 1.4%, the terms of trade which is essentially prices the rest of the world are willing to pay for our exports and have fallen by 30% from their peak in 2007, and the share of the population in jobs which has fallen about 2% since 2005 and is set to fall by another 3% over the next few decades. The driver we can do most about on a sustained basis is labour productivity. The employed share of the population is important too but it can’t be increased forever.

In improving living standards, the new team of Turnbull and Morrison face huge challenges and unfinished business. One challenge, surprisingly and unfortunately, comes from their own principal advisers in Treasury who have completely lost the plot when it comes to thinking about how to raise living standards.

Treasury sees its mission as improving the “wellbeing” of the Australian people by which it means improving “a person’s substantive freedom to lead a life they have reason to value”. Well, that’s nice but it’s more like the advice a parent gives their child rather than the basis for measurable and achievable goals of economic policy. It leads to a vague un-prioritised and unmeasurable list of indicators including the “risks” people face in life, “complexity” of choices they face, and “sustainability” of their opportunities over time. Remember, this is the framework of the “institution with the chief responsibility for providing economic advice to government”.

So clearly Turnbull and Morrison will need to do their own thinking on how to raise living standards. They should return to the big themes that Joe Hockey tried unsuccessfully to articulate two years ago: the culture of entitlement to taxpayer handouts and the huge growth in government spending. And they need to somehow find a way of putting serious tax reform back on the agenda and also tackle industrial relations reform in the wake of the alarming revelations of the trade union Royal Commission.

The public discourse on tax reform is beginning to run off the rails. It has become about how to raise more revenue to fund rising government spending on health, aged care, disability insurance, child care and a raft of other welfare measures. Morrison needs to turn this debate around.

Higher taxes to fund more welfare is not the way to raise living standards.

Consider these observations. The Australian budget deficit has fallen as a percent of GDP from its highest level since 1970 of 4.2% in 2009-10 to 2.6% in 2014-15. But this has been due entirely to rising tax revenue rather than cuts in spending which has stayed the same as a share of GDP. Over the same period government spending in the US, U.K. and New Zealand decreased as a share of GDP. Yet GDP is growing at least as fast in these countries and their unemployment rates are lower than in Australia.

Reform myth busting

Morrison must explain that taxes have costs to living standards. A standard estimate is that for the average dollar of tax that is raised, about 20 cents is lost down the metaphorical toilet – a “deadweight loss” is the polite term. It refers to the costs in output caused by the disincentive to employ labour and capital. So an extra dollar of spending that must be financed by taxation needs to earn a 20 per cent rate of “return”, which is a high bar. Hence the challenge for Morrison is to explain that we can’t just spend and tax our way to higher living standards.

On tax reform, Morrison also needs to address head-on the myths in the public debate. The worst is the simplistic criticism that a higher GST would be inherently unfair because a given amount of GST is a higher share of a low income than of a high income. First it ignores life cycle effects – young low income people are often high income people in the future. Second it ignores the ability to compensate welfare recipients and the working poor while still leaving plenty of revenue to reduce other harmful taxes – a package that would add about 2% to living standards.

This leads to another myth – that company tax cuts are just welfare for the big end of town. Quite the opposite – the biggest winners from company tax cuts would be ordinary workers. This might be counter-intuitive but it is very widely accepted among tax experts and has a strong theoretical and empirical basis. The reason is that company tax cuts would encourage capital to move to real businesses that employ workers, which would increase employment and wages.

The next huge field of opportunity is industrial relations reform. Here Morrison will need Turnbull the lawyer and smooth talker. Based on the Royal Commission evidence, trade unions and business (both are to blame) have had their snouts in the trough at the expense of workers and taxpayers. And they will need to show, without mentioning the words “work” and “choices” in the same sentence, that in fact giving individual workers and employers the right to negotiate their own terms unfettered can drive employment and prosperity.

Author: Ross Guest, Professor of Economics and National Senior Teaching Fellow, Griffith University

Residential Real Estate Now Worth $5.76 trillion

The ABS released their data on capital city house prices today, to June 2015.  Total property is now worth $5.76 trillion, reflecting recent significant price rises in Sydney and Melbourne. The number of dwelling rose to 9.53 million, and the average price was $604,700.

The capital city residential property price indexes rose in Sydney (+8.9%), Melbourne (+4.2%), Brisbane (+0.9%), Adelaide

The price index for residential properties for the weighted average of the eight capital cities rose 4.7% in the June quarter 2015. The index rose 9.8% through the year to the June quarter 2015.

(+0.5%) and Canberra (+0.8%), was flat in Hobart (0.0%) and fell in Perth (-0.9%) and Darwin (-0.8%).

Annually, residential property prices rose in Sydney (+18.9%), Melbourne (+7.8%), Brisbane (+2.9%), Canberra (+2.8%), Adelaide (+2.7%) and Hobart (+1.5%) and fell in Darwin (-1.8%) and Perth (-1.2%).

The total value of residential dwellings in Australia was $5,761,607.2m at the end of June quarter 2015, rising $271,939.1m over the quarter.

The mean price of residential dwellings rose $26,200 to $604,700 and the number of residential dwellings rose by 38,400 to 9,528,300 in the June quarter 2015.

The unfinished business facing Australia’s new treasurer

From The Conversation.

When Australia’s new treasurer walks into the office on Monday morning, a stack of unfinished business awaits. A quick scan of the Treasury website reveals four major inquiries begun in the past 18 months that are still in progress – the Financial System Inquiry, the Competition Policy Review, the Tax White Paper and the Northern Australia Insurance Premiums Taskforce.

The outcomes of these processes open up the possibility of bold decisions that would uplift the outlook for the nation’s economic growth and longer-term prosperity. It is worthwhile to delay a rush to judgement, and consider a framework and narrative that incorporates and informs all of these areas of inquiry.

The most obvious piece of pending business is the government response to the Financial System Inquiry led by David Murray over the course of 2014. The government response, which had been promised for a few months now, appeared ready to be issued this week.

Indeed, close observers have been left wondering whether there would be much “response” in the response, in light of pronouncements that have already been made. Banking regulator APRA has issued guidance on bank capital (with significant market impacts this year); the government has drafted new legislation on superannuation governance that has been released for public consultation; the decision has been made to not impose a deposit insurance scheme; ASIC’s capability and funding model are currently under review; and the RBA has conducted a payments review including interchange fees.

Off the back of these reviews, other mini-inquiries and consultations have emerged. The Assistant Treasurer Josh Frydenberg in August announced a regulatory review of the payday lending industry. The review of retirement income stream regulation that took place last year is still pending outcomes, and perhaps partly rolled into the Tax White Paper process.

The Northern Australia Insurance Taskforce is examining ways in which the government’s balance sheet can be used to reduce insurance premiums in specific regions of Australia – perhaps without the rest of the Australian community fully appreciating the knock-on impacts this could have for other policyholders. Also under-appreciated are other changes in the insurance industry, such as how the Medibank privatisation is redrawing the regulatory landscape on health insurance.

Yet, one wonders whether the two core positions in the FSI report have been lost in all of the noise: the need to enable efficient funding of the economy by removing distortions, and the ability to promote competition and innovation through appropriate policy settings.

Removing distortions and enabling competition including through innovation in the financial system are both absolutely critical; they are the engine of sustainable financial sector growth. And there is a lot of work to be done.

What does sustainable financial sector growth look like, and why is it important? What is the policy framework that surrounds it? The narrative that will explain this to the Australian community needs to be developed and communicated. Without it, the bold policy choices that are yet to be made are likely to come across as tedious, intangible and maybe just too hard.

The story is straightforward, but is not told often, or well. When we hear from politicians about our economic future, the focus is usually on the goods-producing sectors – mining, agriculture, food, specialised manufacturing. In services we focus on easily-understandable cross-border movement in people – tourism and higher education. We rarely hear boosterism applied to financial services.

Yet, financial services is the largest single industrial segment in the Australian economy by gross value added. It is the largest contributor of corporate tax to the Australian government. It is a major employer in most states, and dominant in NSW and Victoria. It is also probably the largest single services export from Australia to the rest of the world, as ACFS detailed in a recent report. Its above-average rate of productivity growth over the past decade suggests that Australia’s financial sector is innovative.

Of course, the financial services sector also plays an important role in intermediating funds that support growth and innovation through the rest of the economy. The financial services sector runs the payments system, the credit system and the capital markets system that both funds business activity and provides wealth management products for households. Financial services also manage risk through insurance.

What the government has done thus far with the FSI report is fine, but there is potential to go a lot further. The need for this can be seen in the gaps where the financial system has been found wanting: credit to small business, generation of venture capital, creation of a broader suite of retirement income products, the high cost of insurance in some sectors.

Creating supports for clusters for innovation in finance, writing legislation that would enable digital identities while protecting personal financial data, forcing greater access to and use of data so as to level the playing field for competition – these are proactive and forward looking recommendations that may not be easy but must be done. Push the financial sector into the digital age, and the rest of the economy will follow.

And then there is the infrastructure. The NBN may be on its way, but what about data storage in the cloud? This has become essential infrastructure that allows financial firms to store their data at lower cost. Enabling this functionality while protecting firms from cyber crime would be a whole-of-economy advance in Australia’s global competitive position.

A framework that removes distortions and enables competition and innovation – this speaks to the agile, innovative, creative future that Prime Minister Malcolm Turnbull articulated in his victory speech on Monday night. Build the narrative around the inquiries, and good outcomes are sure to follow.

Author: Amy Auster, Deputy Director, Australian Centre for Financial Studies

No Sovereign Credit Impact From Australia PM Change – Fitch

The change in Australia’s premiership following a Liberal party leadership vote held on Monday will not have an immediate credit impact for the sovereign, says Fitch Ratings. Frequent changes in leadership, with four prime ministers governing the country over the past five years, have made little difference in core economic policies so far. There is no sign that this latest transition will lead to deterioration in policymaking effectiveness.

Notably, there is cross-party consensus at the federal level in favour of fiscal consolidation – there is much less appetite in Australia relative to some other high-grade peers for abandoning efforts to reduce deficits. Recent leadership changes, including the vote against incumbent Tony Abbott on Monday, have been driven more by personality and social or constitutional issues as opposed to differences over economic policy.

Political volatility will, in general, only have a credit impact if it were to result in tangible economic policy changes, loss of foreign investor confidence, reduction in policymaking capacity and/or if it impaired the authorities’ ability to respond to a crisis. But in Australia’s case, there has been little to no signs that the recent frequent changes in power have had any such effects.

Beyond the leadership issues, Australia shares some of the long-term challenges of other high-grade sovereigns, including an ageing population and the need to foster productivity growth. The Australian economy is also facing immediate challenges linked to its reliance on commodity exports, particularly to China. High personal indebtedness – over 150% of disposable income – also means households are more vulnerable to higher interest rates and any substantive worsening in the job market. Incoming Prime Minister Malcolm Turnbull has placed some weight on the need to address long-term economic challenges in his public statements, although it remains to be seen whether this will lead to concrete policy changes.

Any further deterioration in Australia’s macroeconomic position may require more politically difficult policy decisions to keep fiscal consolidation on track. As such, continued political volatility, while not a significant issue thus far, could yet impair authorities’ ability to implement policies should economic conditions deteriorate further.

Turnbull, the minister for communications, defeated Abbott as leader of the Liberal party in a 54 to 44 vote by Liberal MPs on 14 September. Turnbull was sworn in as Australia’s 29th prime minister on 15 September.