So much to discuss, RBA minutes and Lowe’s speech, APRA loosening the credit taps, rising mortgage delinquency, and our updated property and finance scenarios.
Live chat will be enabled.
Digital Finance Analytics (DFA) Blog
"Intelligent Insight"

So much to discuss, RBA minutes and Lowe’s speech, APRA loosening the credit taps, rising mortgage delinquency, and our updated property and finance scenarios.
Live chat will be enabled.
RBA Governor Lowe set out his views in Brisbane. What hope the budget surplus then?
I would like to begin by providing an update on recent developments in the global and Australian economies. I will then discuss how our thinking on the appropriate stance of monetary policy has evolved over recent times.
Up until around the middle of last year, the global economy was growing quite briskly (Graph 1). Then, over the second half of the year, growth slowed and this lower pace continued into 2019.
There are a few factors that help explain this slowing in the global economy.
The first is a slowdown in the Chinese economy. The Chinese authorities have for some time been seeking to address the build-up of risks in the financial system. As part of their efforts on this front they have sought to rein in shadow banking. The effect of this has been felt across their economy and, given the size of the Chinese economy, the impact has also been felt around the world.
A second factor is a marked slowdown in international trade. Over the past year, global trade has not grown at all (Graph 2). This is unusual as, historically, global trade has tended to increase at least as fast as GDP. This recent weakness partly reflects the slowing in the Chinese economy, but the increases in US and Chinese tariffs are also a factor. Not surprisingly, it has flowed through into weaker conditions in the manufacturing sector around the world and there has been a disruption to some supply chains. Business investment, too, has been affected, with firms delaying investment decisions. In the face of increased uncertainty about future trade policy, many businesses have preferred to wait for a clearer picture. A cyclical downturn in the global electronics industry has also weighed on exports and investment, particularly in some east Asian economies.
A third factor contributing to the slowdown in global growth has been a series of country-specific factors, including natural disasters in Japan, a new vehicle emissions testing regime in Germany and some extreme weather events.
So, these are some of the key factors that have been at work.
Looking forward, the global picture looks a little brighter and it is reasonable to expect that growth will strengthen a little later in the year.
The Chinese authorities have responded to the slowing in their economy with measures to support economic activity. Globally, financial conditions are very accommodative and major central banks have signalled an easier monetary policy stance than was earlier expected. It is also reasonable to expect that the drag on growth from some of the country-specific factors that I mentioned will pass in time. Consumption growth in many economies also remains robust, supported by strong employment growth and rising wages. And notably, the weakness in the manufacturing sector has not spilled over in a material way to the services sector. All this means that the global economy appears quite resilient at the moment.
The big uncertainty remains trade policy. A resolution of the current disputes would help boost trade flows and reduce some of the uncertainties facing businesses. In that case, we could expect a pick-up in investment too. On the other hand, a failure to resolve the disputes represents a major downside risk to the global economy. So there is a lot riding on this issue.
One other feature of the global economy that I would like to draw your attention to is the coexistence of low unemployment and low inflation. Unemployment rates in many of the major economies are the lowest they have been in many decades. At the same time, inflation remains low. While wages growth has picked up, inflation rates are mostly below 2 per cent and below the central banks’ targets (Graph 3).
This experience is the opposite to that of the 1970s and early 1980s. During that period, many countries experienced what became known as stagflation: the coexistence of high unemployment and high inflation. Today, the picture is very different: we have low unemployment and low inflation. This is obviously a much better configuration.
Understanding why this has happened is a priority for us, as we too in Australia are experiencing something similar. We are still searching for the full answers, but the fact that the experience is common across so many countries suggests that there are some global factors at work. In my view, these are partly linked to changes in technology and to globalisation. Both of these affect perceptions of competition and they both are a source of uncertainty about the future. In turn, they are affecting pricing decisions across the world.
We can’t be sure how long these effects will last and whether the coexistence of low inflation and low unemployment is temporary, or whether it is a new normal. Whether or not it is permanent, the coexistence of low inflation and low unemployment does appear to be highly persistent. This persistence has led to a reassessment in a number of countries of the unemployment rate that is sustainable without inflation becoming a concern. This is an important issue and one I will return to in the context of Australian monetary policy.
I would first like to provide an update on the Australian economy.
Just as the global economy slowed over the second half of 2018, so too did the Australian economy – we went from growing at an above-average pace in the first half of 2018 to a below-average pace in the second half (Graph 4).
As has been the case globally, we had our own country-specific factors that have temporarily weighed on economic growth, including the drought and some disruptions to resource production and exports.
More fundamentally, though, the main reason for the shift in momentum in the Australian economy is a slowdown in household consumption growth. Over the second half of 2018, household consumption increased by just ¾ per cent, which is an unusually soft outcome.
The decline in housing prices is a factor here, but the more important factor is the long period of weak growth in household income (Graph 5). Over the past three years, household disposable income has increased at an average rate of just 2¾ per cent. This compares with an average of 6 per cent over the preceding decade. As this period of weak income growth has persisted, it has become harder for households to dismiss it as just a temporary development – as something that will pass quickly. The lower rate of income growth has also made it harder for households to pay down debt. The end result has been that many people have decided to adjust their spending plans. There was further evidence of this adjustment in the retail trade data for the March quarter.
We are not expecting a quick turnaround in growth in consumer spending, but we are expecting a gradual improvement. This is largely on the basis of an expected pick-up in growth in household income, and a stabilisation of the housing market over the period ahead. We are expecting household disposable income to grow at an average rate of 4 per cent over the next couple of years, which is noticeably higher than the average of recent times. Stronger growth in income will help, but the more important factor is some tax relief.
Over the past year, tax paid by households increased at a much faster rate than did income; almost 10 per cent, compared with 3¼ per cent – that is a big difference and it is unusual. We are not expecting it to continue for a couple of reasons. First, the tax offsets for low- and middle-income earners announced in the recent budget will boost disposable income. And second, it is likely that we will return to a more normal relationship between growth in incomes and tax paid.
Our expectation is that the stronger growth in disposable income will flow through into household spending, although this will take some time.
Looking beyond household spending, the outlook for the Australian economy is being supported by a number of other developments.
The first is the ongoing investment in infrastructure. This investment is important. It is not only supporting demand in the economy at a time when this is needed, but it is also adding to the supply capacity of the economy and directly improving people’s lives, including through a reduction in transport congestion.
There is also strong growth in demand for a range of services, partly as a result of ongoing strong population growth.
Another factor supporting growth is the recent lift in the terms of trade, which have continued to surprise on the upside, boosting our national income.
The outlook for investment in the resources sector has also improved, due to both higher levels of sustaining capital investment and the commencement of some new projects. After five years of declining mining investment as LNG projects were completed, we are expecting an increase over the coming year (Graph 6). Non-mining business investment is also on an upward trend as firms invest in additional capacity. By contrast, investment in residential construction is likely to be a drag on the economy for the next few years. After six years of strong growth, residential construction is now declining and this is likely to continue for a while yet.
In comparison with the GDP data, the labour market data over the past year have painted a stronger picture of the economy and have mostly surprised on the upside. More people have joined the labour market and job creation has been strong, with employment increasing by 2½ per cent over the year, compared with growth in the working-age population of 1¾ per cent. The unemployment rate has also declined over the past year (Graph 7).
Recently, though, some labour market indicators have softened a little: the unemployment rate ticked up to 5.2 per cent in April; the underemployment rate has also moved a little higher as there are more part-time workers who are seeking additional hours; job advertisements have declined; and hiring intentions have come off their earlier highs. At the same time, the vacancy rate remains high, monthly employment growth remains firm and hiring intentions remain above average. Taking these various indicators together, the labour market continues to be resilient, although our expectation is that employment growth will slow to be broadly in line with growth in the working-age population.
The other element of the labour market that I would like to comment on is wages. As the labour market has strengthened over the past year, wages growth in the private sector has picked up. By contrast, wages growth in the public sector has been steady at around 2½ per cent (Graph 8). Overall, though, wages growth remains lower than the rate that would appear consistent with inflation being comfortably within the target range. Even in New South Wales and Victoria – where the unemployment rates have averaged around 4½ per cent over recent times – wages growth has been running at just 2½ per cent. It would appear that some of the global factors that I mentioned earlier are working here as well.
Putting these various elements together, our central scenario – as outlined in our recent Statement on Monetary Policy – is for the Australian economy to grow by 2¾ per cent over both 2019 and 2020 (Graph 9). As always, though, there is a range of uncertainty around this forecast. But the central outlook is for growth at around our estimate of potential growth in the Australian economy. Given this, over these two years the unemployment rate is forecast to be around 5 per cent. In 2021, the central forecast is for slightly better outcomes, partly due to a pick-up in the resources sector.
It is worth pointing out that when preparing these forecasts, we used our normal technical assumption that interest rates would move broadly in line with market pricing. At the time the forecasts were prepared, market pricing implied that the cash rate was expected to decline to 1 per cent over the next year. If, instead, we had used an assumption of unchanged interest rates, the growth forecast would have been lower and the forecast for unemployment would have been higher.
Turning now to inflation, the outcome for the March quarter was noticeably lower than we had expected. In year-ended terms, headline inflation was 1.3 per cent and in underlying terms it was around 1½ per cent (Graph 10). Looking through the details of the CPI, there appear to be only limited inflation pressures across much of the economy. The low rates of wages growth are contributing to relatively low rates of inflation in the services sector. Rent inflation is also the lowest it has been in decades. And various government initiatives to ease cost-of-living pressures are contributing to lower increases in many administered prices. Together, these factors have led to a low rate of inflation for non-traded goods and services (Graph 11).
The picture for traded goods and services inflation is a little different. Recently, there have been increases in some food prices as a result of the drought and floods. The earlier small depreciation of the exchange rate has also been passed through into the prices for some consumer durables. These developments mean that tradables prices as a group are no longer declining. Even so, inflation remains low for most traded goods and services.
Looking forward, the central forecast is for underlying inflation of around 1¾ per cent this year, 2 per cent next year and a little higher the following year. In headline terms, inflation is expected to be noticeably higher in the June quarter, due to the recent increase in petrol prices. For 2019 as a whole, headline CPI inflation is expected to be around 2 per cent and the same the following year. This means that inflation is expected to remain around the bottom of the medium-term target range over the forecast period.
I would like to turn now to monetary policy and how our thinking and communication have evolved over recent times.
You might recall that through 2018 we had three main messages: (1) we were making progress towards our inflation and unemployment goals; (2) given that this progress was expected to continue, it was more likely that the next move in interest rates would be up, rather than down; and (3) given the progress towards our goals was expected to be only gradual, any move in interest rates was some time off.
Earlier this year, our assessment of the balance of probabilities around the likely direction of the next move in interest rates shifted a little. At the Reserve Bank Board meeting in February, we assessed that the probabilities of an interest rate increase and a decrease had become more evenly balanced than they were through 2018.
This shift reflected two developments.
The first was the slowing in the Australian economy over the second half of 2018 that I just spoke about. And the second was the lower-than-expected inflation outcome for the December quarter. The main countervailing consideration was the labour market, which painted a stronger picture of the economy than the other indicators. In the face of these conflicting signals, we judged that the best approach was to hold interest rates steady while we obtained a clearer picture of the direction of the economy.
It was relatively clear, though, that if the GDP data were giving the better signal – and the labour market eventually softened – lower interest rates would likely be appropriate. This was especially so in light of the ongoing low rate of inflation. This assessment was reflected in the minutes of the Board’s April meeting, where we discussed a scenario in which there was a lack of progress on inflation and the unemployment rate trended higher.
Following our April meeting, we received another reading on inflation, which confirmed that price pressures were subdued across the economy. Over the past year – and particularly in the past two quarters – inflation has come in lower than we expected and our inflation forecasts have been revised down. This is evident in Graph 12, which shows the forecasts a year ago, the actual outcomes and our current forecasts. In contrast to the subdued inflation outcomes, employment growth has been stronger than we expected a year ago. This can be seen in the right-hand panel. In most cases, when employment growth is stronger than expected, we expect to see an upside, not a downside, surprise on inflation. So, from this perspective, the recent experience is a little unusual.
As the Board has sought to understand this experience and studied similar experiences overseas, we have been asking ourselves: what rate of unemployment is achievable in Australia without generating inflation concerns?
Over recent years, the answer to this question was thought to be around 5 per cent – in other words, it was thought that an unemployment rate below 5 per cent was likely to put pressure on the supply capacity of the economy and, in turn, raise possible inflation concerns.
But from today’s perspective, I think we can do better than this. My judgement of the accumulating evidence is that the Australian economy can support an unemployment rate of below 5 per cent without raising inflation concerns. This would be consistent with the experience overseas, with many other advanced economies sustaining lower rates of unemployment than previously thought possible without leading to a noticeable uplift in inflation.
If this judgement is correct, the question is: how does our society achieve and sustain a lower rate of unemployment? It is possible that the current policy settings are sufficient to deliver lower unemployment. The labour market has surprised on the upside over recent times, and it could do so again. While we can’t rule out this possibility, the recent flow of data makes it seem less likely.
In the event that the unemployment rate does not move lower with current policy settings, there are a number of options. These include: further monetary easing; additional fiscal support, including through spending on infrastructure; and structural policies that support firms expanding, investing and employing people. Relying on just one type of policy has limitations, so each of these is worth thinking about.
The Reserve Bank Board recognises that monetary policy has a role to play here. Earlier today, we released the minutes of the Board’s meeting two weeks ago. At that meeting, we discussed a scenario in which there was no further improvement in the labour market and the unemployment rate remained around the 5 per cent mark. In this scenario, we judged that inflation was likely to remain low relative to the target and that a decrease in the cash rate would likely be appropriate. A lower cash rate would support employment growth and bring forward the time when inflation is consistent with the target. Given this assessment, at our meeting in two weeks’ time, we will consider the case for lower interest rates.
Thank you for listening. I look forward to answering your questions.
The RBA released their minutes today, and things are looking less rosy, even though their rose-tinted glasses.
Members commenced their discussion of the international economy by observing that global growth had eased in the second half of 2018 and looked to have continued at around this more moderate rate in 2019. Growth in Australia’s major trading partners was also expected to continue at around this slower pace over 2019 and 2020. Members also observed that the outlook for China continued to be a significant uncertainty for the global growth outlook, as were trade tensions, which had escalated again between the United States and China immediately prior to the meeting. Global financial conditions had become more accommodative since the turn of the year. Members noted that this could lead to stronger growth than expected, although there were still risks of events occurring that could lead to both tighter financial conditions and lower global growth.
March quarter GDP growth had been stronger than expected in the United States and the euro area, but had been quite weak in a number of trade-intensive economies in east Asia. The latest monthly data had shown that growth in Chinese industrial production, fixed asset investment and total social financing had increased, suggesting momentum had picked up in response to targeted policy easing by the Chinese authorities. Conditions in Chinese property markets had also strengthened. Members noted that economic sentiment in China had improved since the beginning of the year, partly because small to medium-sized businesses were obtaining improved access to finance and government infrastructure spending was boosting demand.
Members noted that the sharp slowing in global trade had been related to slowing growth in China. The decline in the value of Chinese imports had been broadly based across regions, although the large decline in the value of trade with the United States suggested that trade diversion as a result of new tariffs had also been a factor. Growth in China was expected to slow gradually over the forecast period to the middle of 2021. This was expected to continue to weigh on external demand for trade-intensive economies in east Asia and the euro area; recent data on export orders in east Asia had been subdued.
Members discussed various longer-term policy initiatives in China, including policies on investment abroad and modernisation of China’s manufacturing sector. China’s infrastructure investment abroad had served to support land and sea trade routes, although there had been some challenges that Chinese authorities had been addressing. Members also noted the authorities’ efforts to promote innovation, particularly in China’s technology sector, and to upgrade the Chinese manufacturing sector significantly.
For some economies, the slowing in external demand had been accompanied by lower investment and investment intentions. In some east Asian economies in particular, including South Korea, the turn in the cycle in the global electronics industry had dampened exports and investment. Members noted that firms would also be less likely to commit to long-term investments given the uncertainty around the evolution of international trade policy.
In many economies, domestically focused sectors, such as services and retail trade, had been more resilient than externally focused sectors. This was particularly the case in the advanced economies, where tight labour market conditions had supported growth in spending. Unemployment rates had remained around multi-decade lows in many advanced economies and wages growth had increased noticeably. In the United States and Japan, recent wage increases had been larger for low-wage earners than high-wage earners.
Core inflation had remained subdued in most economies and, following weaker inflation data in the United States, was below target in the three major advanced economies.
There had been some large movements in commodity prices over recent months. Iron ore prices had remained high as a result of supply disruptions in Brazil and Australia. Oil prices had also risen, which had led to higher headline consumer price inflation in most economies and was expected to flow through to higher prices for Australian liquefied natural gas exports over the following couple of quarters. As a result, the forecast for Australia’s terms of trade had been revised higher, but they were still expected to decline over the forecast period to the middle of 2021.
Members commenced their discussion of the domestic economy by noting that growth had been subdued in the second half of 2018. Indicators of household consumption suggested that growth had remained subdued in the March quarter. In addition, demand for new dwelling construction was expected to have remained weak. These factors had been the main drivers of a downward revision to the domestic growth outlook in the near term. Beyond 2019, these effects were broadly offset by upward revisions to export growth and some newly announced mining investment projects. Members noted that, overall, the Bank expected year-ended GDP growth to be 2¾ per cent over 2019 and 2020.
Growth in consumption had been weaker than expected in the second half of 2018 and retail sales data for the March quarter suggested that this weakness had continued into 2019. Members noted that, as had been the case for some time, the outlook for growth in consumption was a key uncertainty for the overall growth outlook. The risks to consumption were tilted to the downside, given the extended period of low income growth and the adjustment occurring in housing markets. The forecast for an improvement in growth in consumption depended on an increase in growth in household disposable income over the forecast period. The forecast increase in household disposable income growth was supported by employment growth, a pick-up in wages growth and lower growth in tax payments, partly because of the introduction of the low- and middle-income tax offsets announced in the Australian Government 2019-20 Budget. Members noted that there was uncertainty about the outlook for fiscal policy and how this might affect the outlook for growth in household disposable income.
Housing markets had remained weak in the preceding month. The rental vacancy rate in Sydney had increased to the highest level in around 15 years and housing prices in established markets had continued to decline. More positively, the pace of price declines had moderated and the modest recovery in auction clearance rates since the start of the year had been sustained.
Information obtained through the Bank’s liaison program continued to indicate that sales conditions for off-the-plan apartments and new detached housing had been difficult. The spike in residential building approvals in February had largely been unwound in March, confirming that underlying conditions for new dwelling activity remained weak. Data released since the previous meeting had shown that the pipeline of residential work to be done had decreased in the December quarter, but remained high. Members noted that the forecasts for dwelling investment suggested that population growth could exceed growth in the stock of housing towards the end of the forecast period, and that this possibility had been suggested by a number of the Bank’s liaison contacts.
Survey measures of business conditions had moved a little higher in March and April and had remained slightly above average, though well below the high levels that had prevailed throughout most of 2018. Forward-looking indicators of non-mining business investment had been mixed; non-residential building approvals had declined, but the pipeline of infrastructure work remained high. Non-mining business investment was expected to support growth in output over the forecast period.
Mining investment had declined in the December quarter, but was expected to increase over the forecast period, reflecting investment required to sustain current production levels and an expectation that a number of new projects would commence towards the end of the forecast period. Recent trade data suggested resource exports would contribute to output growth in the March quarter, and exports were expected to contribute to output growth throughout the forecast period. Members noted that the forecast pick-up in rural exports from 2020 depended on a return to normal weather conditions.
Public demand was expected to continue to support aggregate growth over the forecast period; a significant share of this expenditure was associated with delivering goods and services to households, such as the National Disability Insurance Scheme. Members noted that the Victorian Government had announced measures to contain growth in labour costs in an environment of expected lower stamp duty revenues.
Growth in employment in the March quarter had been strong, following similar outcomes over much of 2018. Most of the growth in employment since mid 2018 had been in full-time employment. The unemployment rate had remained around 5 per cent in March. Members observed that conditions in the labour market had signalled a significantly stronger pace of economic activity since mid 2018 than indicated by the GDP data. Leading indicators of labour demand had eased over recent months and provided a mixed picture of the near-term outlook. As a result, employment growth was expected to be similar to the growth rate of the working-age population in the near term. The unemployment rate was expected to remain around 5 per cent through most of the forecast period, before declining to around 4¾ per cent in 2021.
Members noted that the forecasts for the labour market suggested that there would be some spare capacity in the labour market throughout the forecast period, although there was uncertainty about how quickly the spare capacity would decline and how progress would feed into wage pressures. The central forecast was for wages growth to pick up gradually. In combination, the forecasts for wages growth and consumer price inflation implied that real consumer wage growth would be low but positive over the forecast period.
The inflation data in the March quarter CPI release were noticeably lower than expected. The CPI increased by 0.1 per cent (seasonally adjusted) in the quarter, while the underlying rate of inflation was ¼ per cent. In year-ended terms, headline inflation was 1.3 per cent, with the underlying rate at 1½ per cent. The earlier exchange rate depreciation and the drought-related increase in some food prices had led to relatively strong retail price inflation in the March quarter. However, these inflationary pressures had been more than offset by broad-based weakness in other CPI components, which was likely to be more persistent.
Rental inflation had remained low, driven by a marked slowing in rental inflation in Sydney; data on newly advertised rents suggested that rents had started to pick up in Perth. Developer discounts and incentives had weighed on the prices of newly built homes, particularly in Melbourne and Brisbane. A range of government policy decisions had contributed to lower inflation in administered prices in recent quarters. Market and survey-based measures of inflation expectations had declined in recent months, as had been the case in other advanced economies.
Members noted that the recent CPI data had led the Bank to reassess the disinflationary effects of the weak housing market. Combined with the lower GDP growth outlook, this had led to a downward revision to the inflation outlook, although there was also some uncertainty about the persistence of downward pressure from utilities and administered price changes and the effect of housing market weakness. The central forecast scenario was for underlying inflation of around 1¾ per cent over 2019, 2 per cent over 2020 and a little higher after that.
Members commenced their discussion of financial market developments by noting that global financial conditions were accommodative and had eased significantly since the start of the year. Market expectations for the future path of monetary policy in a number of economies had declined earlier in the year, in line with guidance from major central banks that policy was likely to be more accommodative than previously expected. The expectation that policy rates would remain little changed for some time had contributed to very low levels of volatility in most financial markets.
In the United States, with inflation close to but a bit below target and the federal funds rate close to neutral, the Federal Reserve (Fed) had reiterated that it would take a patient and flexible approach to its policy decisions. While the Fed’s recent forecast update implied that one more policy rate increase was likely by the end of 2020, market pricing implied that the Fed was expected to lower its policy rate around twice over that period. At its April meeting, the European Central Bank had reiterated that it expected policy rates to remain at current levels at least through to the end of 2019. The Bank of Japan had indicated that its very stimulatory policy settings will remain in place until at least mid 2020. Market participants expected the next moves in policy rates in Canada, New Zealand and Australia to be down.
Government bond yields remained at very low levels in the advanced economies, having declined since late 2018 in line with downward revisions to growth and inflation projections, and the lowering of policy rate expectations by market participants. In Germany and Japan, long-term bond yields were around zero, close to the record lows of 2016. Members noted that Australian government bond yields had declined by more than those in other major markets over the preceding six months, following weaker-than-expected inflation data and a lower expected path for monetary policy. By contrast, Chinese government bond yields had increased over the preceding month, as signs emerged that policy stimulus there was providing support to economic activity.
Members noted that, following the brief inversion of segments of the US yield curve in March, the slope of the US yield curve had increased a little in April. While market commentators had noted that past episodes of yield curve inversion had tended to precede recessions, the decline in credit spreads and rise in equity valuations in 2019 suggested market participants did not perceive this to be a particular risk.
Members observed that financing conditions for corporations remained favourable. In the advanced economies, corporate bond yields had declined, partly because of a decline in spreads. In addition, equity prices had increased substantially since the start of 2019 to be at their highest levels in over a decade, including in Australia.
In China, growth in total social financing had been steady in recent months and a little higher than in 2018, supported by bank lending and bond issuance. Off-balance sheet financing had continued to decline, reflecting the authorities’ efforts to discourage riskier forms of financing. Members noted that the Chinese authorities had introduced additional measures to encourage banks to lend to small private sector firms, which had previously made use of off-balance sheet financing that was now less readily available. Members also noted the substantial local government bond issuance to finance infrastructure projects, which was a key part of the authorities’ stimulus measures.
In foreign exchange markets, volatility had remained low over the preceding month, including in most emerging markets. Members noted, however, that risks remained pronounced for a small number of economies with specific vulnerabilities, most notably Turkey and Argentina, where financial conditions had tightened again.
The Australian dollar had depreciated a little following the weaker-than-expected March quarter CPI release, but overall had been little changed over recent months and remained around the lower end of its narrow range of the past few years. Members noted that this reflected the offsetting influences of the rise in commodity prices and decline in Australian government bond yields relative to those in the major markets over 2019. The difference between long-term government bond yields in the United States and Australia had increased to a historically large 75 basis points.
Housing credit growth had slowed over the preceding year, but the monthly pace of growth had stabilised over recent months. In three-month-ended annualised terms, growth in housing lending was around 4½ per cent for owner-occupiers and ½ per cent for investors. Loan approvals also appeared to have stabilised in recent months. Members noted that, although lending practices were tighter than they had been for some time, the decline in housing credit growth over the preceding year had been driven largely by weaker demand for finance, associated with the decline in housing prices.
The average interest rate charged on outstanding variable-rate housing loans had remained broadly steady. While banks had increased their standard variable reference rates since mid 2018, rates on new loans had remained materially below the average of those on outstanding loans. Members noted that banks had recently reduced the rates charged on new fixed-rate loans.
Funding costs for the major banks had declined to record lows in preceding months, as the increase in short-term money market rates in 2018 had been fully unwound and retail deposit rates had continued to edge lower. Despite the low cost of funding, bank bond issuance in 2019 so far had been a little below the average of recent years. Issuance of bonds by other corporations and of residential mortgage-backed securities had been broadly in line with the average of recent years.
The pace of growth in business lending had been maintained in recent months at rates that were above those of the preceding few years, driven by lending to large businesses. Lending to small businesses had declined over the preceding year. Interest rates on variable-rate loans to large businesses, which are linked to bank bill swap rates, had declined in the March quarter. Members observed that the rates charged on small business loans remained markedly higher than those on large business loans, with the gap between small and large business loan rates having doubled following the global financial crisis.
Financial market participants’ expectations of cash rate cuts were brought further forward following the release of the March quarter CPI. Financial market pricing implied that the cash rate was expected to be lowered by 25 basis points within the next three months and again by the end of 2019.
In considering the stance of monetary policy, members observed that growth in Australia’s major trading partners had slowed, driven by a sharp slowing in global trade associated with slower growth in China. Members also noted, however, that targeted stimulus measures in China appeared to be having an effect and global financial conditions remained very accommodative. In a number of advanced economies, labour markets had continued to tighten and wages growth had increased, but inflationary pressures had remained subdued.
Domestically, members noted that the sustained low level of interest rates over recent years had been supporting economic activity and had contributed to a decline in the unemployment rate. However, household income growth had remained low and the March quarter inflation data indicated that the inflationary pressures in the Australian economy were lower than previously thought.
After updating the forecasts for the new information, the central forecast scenario remained for progress to be made on the Bank’s goals of reducing unemployment and returning inflation towards the midpoint of the target, but at a more gradual pace than previously expected. Under the central scenario, GDP growth had been revised lower in the near term, but was expected to pick up to be around 2¾ per cent over 2019 and 2020. The unemployment rate was expected to remain around 5 per cent over 2019 and 2020 before declining a little to 4¾ per cent in 2021. This implied that spare capacity would remain in the economy for some time. Given this, and the subdued inflationary pressures across the economy, underlying inflation was expected to be 1¾ per cent over 2019, 2 per cent over 2020 and a little higher after that.
Members noted that the central forecast scenario was based on the usual technical assumption that the cash rate followed the path implied by market pricing, which suggested interest rates were expected to be lower over the next six months. This implied that, without an easing in monetary policy over the next six months, growth and inflation outcomes would be expected to be less favourable than the central scenario.
At the same time, members also recognised that there were risks to the forecasts in both directions. The risks to the global economy remained tilted to the downside, with uncertainty remaining around the evolution of international trade policy. Domestically, the outlook for household consumption remained a key uncertainty, with the risks tilted to the downside given ongoing low income growth and the adjustment occurring in housing markets. On the upside, it was possible that the combined effects of continued accommodative financial conditions, the increase in Australia’s terms of trade, a renewed expansion in the resources sector and the expected lift in household disposable income growth would result in stronger growth in output than in the central forecast scenario.
Members discussed the outlook for the domestic labour market in some detail. As in the previous meeting, members discussed the scenario where inflation did not move any higher and unemployment trended up, recognising that in those circumstances a decrease in the cash rate would likely be appropriate. As noted at the previous meeting, members recognised that the effect on the economy of lower interest rates could be expected to be smaller than in the past, given the high level of household debt and the adjustment that was occurring in housing markets. Nevertheless, a lower level of interest rates could still be expected to support the economy through a depreciation of the exchange rate and by reducing required interest payments on borrowing, freeing up cash for other expenditure.
In light of the recent run of inflation data, the Board then discussed the likelihood that the economy could sustain a stronger labour market with lower rates of unemployment than previously estimated, while achieving inflation consistent with the target. In this context, members observed that the recent international experience was that inflation had remained low despite historically low rates of unemployment. Given the international evidence and the recent Australian inflation data, members agreed that a further decline in the unemployment rate would be consistent with achieving Australia’s medium-term inflation target. Given this, members considered the scenario where there was no further improvement in the labour market in the period ahead, recognising that in those circumstances a decrease in the cash rate would likely be appropriate.
Taking into account all the available information, including the various uncertainties about the outlook, members judged that it was appropriate to hold the stance of monetary policy unchanged at this meeting, noting that holding monetary policy steady had enabled the Bank to be a source of stability and confidence over recent years. In view of the spare capacity that remained in the economy, however, members agreed that it was important to continue to pay close attention to developments in the labour market and set monetary policy to support sustainable growth in the economy and achieve the inflation target over time.
The Board decided to leave the cash rate unchanged at 1.5 per cent.
As expected, APRA has released a consultation to change the minimum floor rate of 7% for mortgage serviceability assessment (despite recently having said it would stay). It is subject to a 4-week consultation.
More “unnatural acts” as we predicted to try and sustain the debt and property bubble. More such acts will follow.

In APRA’s view, the expectations introduced in 2014 have served an important purpose by limiting excessive borrowing in an environment of low interest rates and high household debt.
However, changes in the market and economic environment since that time have caused APRA to review the appropriateness of the current guidance. Two factors, in particular, suggest a reconsideration of the current approach may be warranted:
– the low interest rate environment is now expected to persist for longer than originally envisaged. This may mean that the gap between actual rates paid and the floor rate may become unnecessarily wide; and
– compared to 2014, when a single standard variable rate was used as the basis to price all mortgage loans, ADIs have introduced differential pricing for mortgage products. The merits of a single floor rate are therefore less obvious, particularly as it will be most binding on owner-occupiers with principal and interest loans, and least binding on investors with interest-only loans.
Given these changes, APRA is seeking views on proposed revisions to its guidance on the buffer and floor rates currently set out in APG 223.
APRA is proposing to:
– remove the quantitative guidance on the level of the serviceability floor rate, i.e. the reference to a specific 7 per cent floor. APRA will still expect ADIs to determine, and keep under regular review, their own level of floor rate, but ADIs will be able to choose a prudent
level based on their own portfolio mix, risk appetite and other circumstances;– increase the expected level of the serviceability buffer from at least 2 per cent (most ADIs currently use 2.25 per cent) to 2.5 per cent, to maintain prudence in overall serviceability assessments; and
– remove the expectation that a prudent ADI would use a buffer ‘comfortably above’ the proposed 2.5 per cent, to improve clarity of the prudential guidance.
APRA considers that these changes will provide greater flexibility for ADIs to manage and set floor rates which reflect the outlook for interest rates, while still ensuring sufficient prudence is retained in serviceability assessments through the proposed higher buffer rate.
This move is not intended to signal any lessening in APRA’s focus on the importance of sound lending standards, but to simply acknowledge that the current interest rate environment, and the
introduction of differential pricing, may not warrant a uniform mandated interest rate floor of 7 per cent across all products.As an alternative approach, APRA considered retaining but reducing the interest rate floor, and leaving the existing interest rate buffer unchanged. However, APRA considered that this approach would not address the emergence of differential pricing as effectively.
Prescribing multiple floor rates for different product types was also considered, but was regarded as too complex and unnecessarily prescriptive.
APRA’s guidance on the proposed level of the interest rate buffer rate is informed by analysis of previous Australian interest rate cycles and international regulatory practices for serviceability buffers. As set out in paragraph 34 of APG 223, APRA continues to expect that ADIs apply the buffer to new and existing debt, recognising that for certain types of mortgage products higher buffers may be appropriate.
Aussie Home Loans boss James Symond has described the mortgage industry’s mammoth lobbying efforts as a “case book study” in uniting a competitive industry – via InvestorDaily.
Few sectors of the financial services universe had more riding on the 2019 federal election than mortgage broking. A Labor victory would have been a devasting blow to the third-party channel, which is responsible for helping most Aussies secure finance to buy a home.

“The industry banded together. You couldn’t be prouder of them all. This is a case book study of an industry that felt vulnerable and came together and stepped up to defend itself,” Mr Symond told Investor Daily. “You had individual mortgage brokers working in small businesses around the country having one-on-one meetings with MPs,” he said.
Regardless of what their individual political views might have been, this election was deeply personal for mortgages brokers, who earn an average of around $86,000 – far from what some might consider the “big end of town” that Labor was hell bent on destroying. Shorten effectively galvanised a formidable opposition in the third-party channel by failing to back down on remuneration changes.
After the Hayne royal commission recommended scrapping broker commissions, the industry quickly united to lobby both sides of the government. The result saw an enlightened coalition confirm no changes would be made to broker remuneration. Labor, on the other hand, would act on Hayne’s view and ban trail commissions while introducing a higher cap of 1.1 per cent on upfront commissions.
With the opinion polls prior to the election pointing to a Labor victory, the mortgage industry was making one hell of a gamble.
“It was very much a bet, because we couldn’t infiltrate Labor,” Mr Symond said. “With the Liberals, we got onto the right people who listened, who were open to being educated about how the mortgage broking industry operates and its value to consumers. But Labor was simply not interested.
“We got lucky that the coalition got back in. We don’t have to worry about the fact that Labor wouldn’t listen.”
It was a major misstep for Labor not to interact with the mortgage broking fraternity, given the opposition’s strong stance on economic matters. Negative gearing reforms were a major policy for Labor, which could have easily won over an army of mortgage brokers and the first-home buyers they represent by coming to the table on remuneration. Linking affordability and home ownership with the value proposition of a mortgage broker is easy enough to spin.
On the flipside, those with negatively geared properties who use the services of a broker would be highly unlikely to vote for a Shorten government. Including many brokers themselves.
“Labor had their own agenda,” Mr Symond said. “They didn’t give a hoot about mortgage brokers.”
“Thankfully the coalition got in, because it would’ve been a different story if they didn’t. We have some stability now.”
The broking industry has the government on its side and will continue to drive competition in the mortgage market – something that was in serious jeopardy if Labor had succeeded and scrapped trail commissions.
In addition to Aussie Home Loans, listed broking businesses like Mortgage Choice, AFG and Yellow Brick Road – which recently confirmed that it is doubling down on mortgages – will be the obvious beneficiaries of the Coalition’s win.
What will be interesting to watch is how the major banks react. While they have historically moved as a group, the question hanging over the broking industry has led them in different directions in recent years.
The royal commission and the 2019 federal election were arguably the final battles in a multiyear campaign that has ultimately sealed a victory for the third-party channel and the millions of home buyers it serves.
We run our next live event tomorrow at 20:00 Sydney. Here is a link to the reminder, and to the live show/chat. You can ask questions live, or send them to me beforehand, via the blog, or YouTube.
The New Zealand Reserve Bank has today announced the next steps in its Capital Review, following the closing of written submissions on Friday last week. An announcement is planned by the end of November, with implementation of any new rules starting from April next year.
The review proposes changes to regulatory capital requirements for locally incorporated banks. These include requiring bank shareholders to increase their stake so that they absorb a greater share of losses should their bank fail, and ensuring banks more accurately calculate how much capital they have.
Deputy Governor Geoff Bascand says he is encouraged by the number of, and the effort put into, submissions received on the proposals to make New Zealand’s banking system safer.
“It is important that the public understands how higher levels of capital better protect their deposits. It is pleasing to see stakeholders’ interest in the proposals reflected in the 164 responses received as well as in feedback received through our briefings with banks, industry bodies, investors, the news media, and social sector groups.
“The proposals are consistent with steps taken by other banking regulators after the Global Financial Crisis. There is increasing evidence that the costs of bank failures – both economic and well-being costs – are higher than previously understood.”
The submissions will now be collated and published along with a summary in June. The Reserve Bank will continue its stakeholder outreach programme, which includes conducting focus groups to understand how New Zealanders feel about risks in our financial system, how these risks could affect them, and how the risks should be managed.
An important part of the consultation process involves seeking relevant information from industry and broader stakeholders to better understand costs and benefits, Mr Bascand says.
“The proposals were designed around a net benefits framework, where more capital was required up to the point that financial stability gains were matched by increases in costs.
“Our policy development process is to develop policy options, lay out our thinking on the nature of the costs and benefits of the policy being consulted on, seek input from affected parties, and produce a full cost benefit around any modified proposals before making final policy decisions.”
The Reserve Bank is also in the process of appointing external experts to independently review the analysis and advice underpinning the proposals. Their reports will be part of the suite of information considered in the final decision-making process of the review.
An announcement is planned by the end of November, with implementation of any new rules starting from April next year. There will be a transition period of a number of years before banks are required to fully comply with any new rules.
The review began more than two years ago, when the Reserve Bank published an issues paper and opened the first of four public consultations.
The results of the federal election are in – but what does it mean for the broking industry? We unpack the key policy positions regarding the third-party channel – via The Adviser.

In a closely-run campaign that was neck-and-neck between the Australian Labor Party and the Coalition, Prime Minister Scott Morrison clinched the lead on election night (18 May).
Despite there being some surprises on the night – including Queenslanders swinging away from Labor to the Coalition; the fact that opinion polls are fallible; and the shock departure of former PM and Liberal candidate for Warringah, Tony Abbott (who lost his seat to Independent candidate Zali Steggall) – Mr Morrison will remain as the 30th Prime Minister of Australia.
Bill Shorten, leader of the opposition, conceded to Mr Morrison on Saturday night, saying it was “in the national interest” and wished him “good fortune and good courage”.
The mortgage broking industry – which has a strong presence in Queensland, where Labor lost several of its seats – has been vocal supporters of the Coalition Government, given its stance on broker remuneration.
The industry will likely not see any imminent, radical changes to remuneration in the next three years under this Coalition, given its previous commitments.
Both the abolition of trail and upfront commissions were recommended by Commissioner Hayne in his final report for the Royal Commission into Misconduct in the Banking, Superannuation and Financial Services Industry.
While the Coalition had initially said in its official response to the final report that it would ban trail commission payments for new mortgages from 1 July 2020, it later delayed any decision on fundamentally changing the structure of broker remuneration until three years’ time.
In March of this year, Treasurer Josh Frydenberg said that the government would look at reviewing the impacts of removing trail in three years’ time rather than abolishing it next year as originally announced, following concerns regarding competition.
He commented: “[F]ollowing consultation with the mortgage broking industry and smaller lenders, the Coalition government has decided to not prohibit trail commissions on new loans but rather review their operation in three years’ time”.
The review, to be undertaken by the Council of Financial Regulators and the Australian Competition and Consumer Commission will therefore look at both the impacts of removing trail as well as the feasibility of continuing upfront commission payments.
Speaking to the broking and real estate industries via teleconference earlier this month, Mr Frydenberg thanked mortgage brokers for their “absolutely critiical role in the economy” and “for what they do for our community” and emphasised that the Coalition government’s response to the “cathartic” banking royal commission was to adopt all the recommendations in one form or another, but to leave broker remuneration largely alone until a review in three years’ time.
The Treasurer said: “[W]ith respect to the ban on upfront and trail commissions, as recommended by commissioner Hayne, that we would leave that to a review in a few years’ time.
“The reason is that mortgage brokers play an absolutely critical role in our economy, and they help generate competition in that market, and we don’t want to see mortgage brokers put out of business with, effectively, their business just migrating to the big banks.”
Mr Frydenberg said this position was taken after the government reviewed the royal commission report and after speaking to key stakeholders about “consumer and business access to financial services, the overall stability of the financial system, the impact of competition and, of course, on economic growth”.
“What we don’t want to do is weaken competition and strengthen big banks,” he said, adding that mortgage brokers were “overwhelmingly small businesses” and sole traders.
The Coalition Government’s stance differs from Labor’s position, which has said it backs a fixed fee for upfront commissions [at 1.1 per cent] and a ban on trail commissions for new loans from 1 July 2020.
“We believe this is problematic on a number of levels, particularly because many mortgage brokers will be worse off under Labor than they are today and could be put out of business.
“It will also impact on competition and, ultimately, their customers,” the Treasurer said earlier this month.
“Today… brokers get paid higher amounts for more complex loans, but under the Labor Party’s model they won’t be remunerated for this, which will exclude certain consumers from using mortgage brokers. And a fixed fee could drive brokers to encourage churn and put them in clear conflict with their best interests duty.”
Mr Frydenberg noted that it was also “not clear as to whether Labor’s policy includes GST or whether it includes the aggregator’s fee”.
“I think the Labor Party [has] created significant doubt in the sector and, obviously, concern – that is the feedback that we are getting,” he said.
However, the Coalition and Labor Party did both support Commissioner Hayne’s recommendations to introduce:
The Coalition has also recently announced a new First Home Loan Deposit Scheme that will enable first home buyers to access a mortgage with a 5 per cent deposit.
This would make 95 per cent loan-to-value ratio mortgages available to first home buyers earning up to $125,000 annually (or $200,000 for couples) from 1 January 2020.
The First Home Loan Deposit Scheme, which will partner with private lenders and prioritise smaller lenders in a bid to “boost competition”, will be available to qualifying first home buyers from 1 January 2020.
The value of homes that can be purchased under the scheme will be “determined on a regional basis, reflecting the different property markets across Australia,” Mr Morrison said.
The Prime Minister estimated that the scheme would help FHBs save around $10,000 by not having to pay lenders’ mortgage insurance (LMI).
The latest edition of our weekly finance and property news digest with a distinctively Australian flavour.
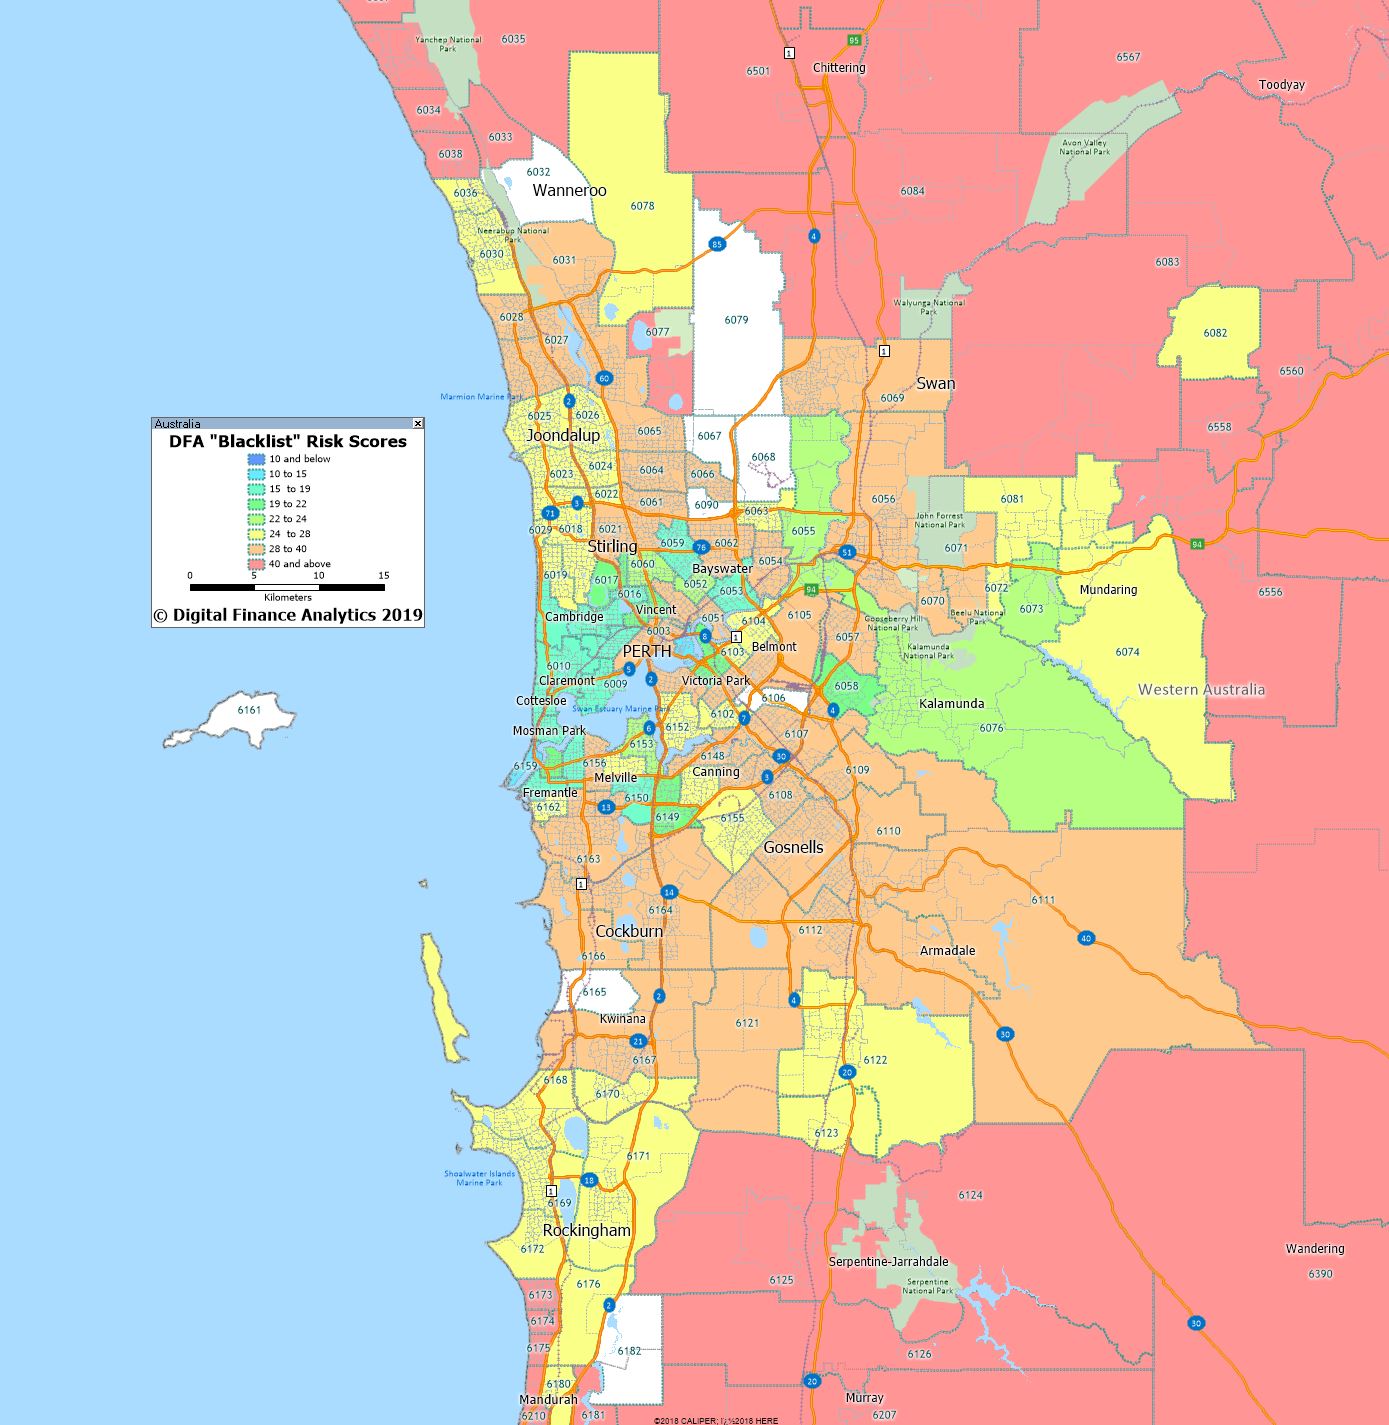
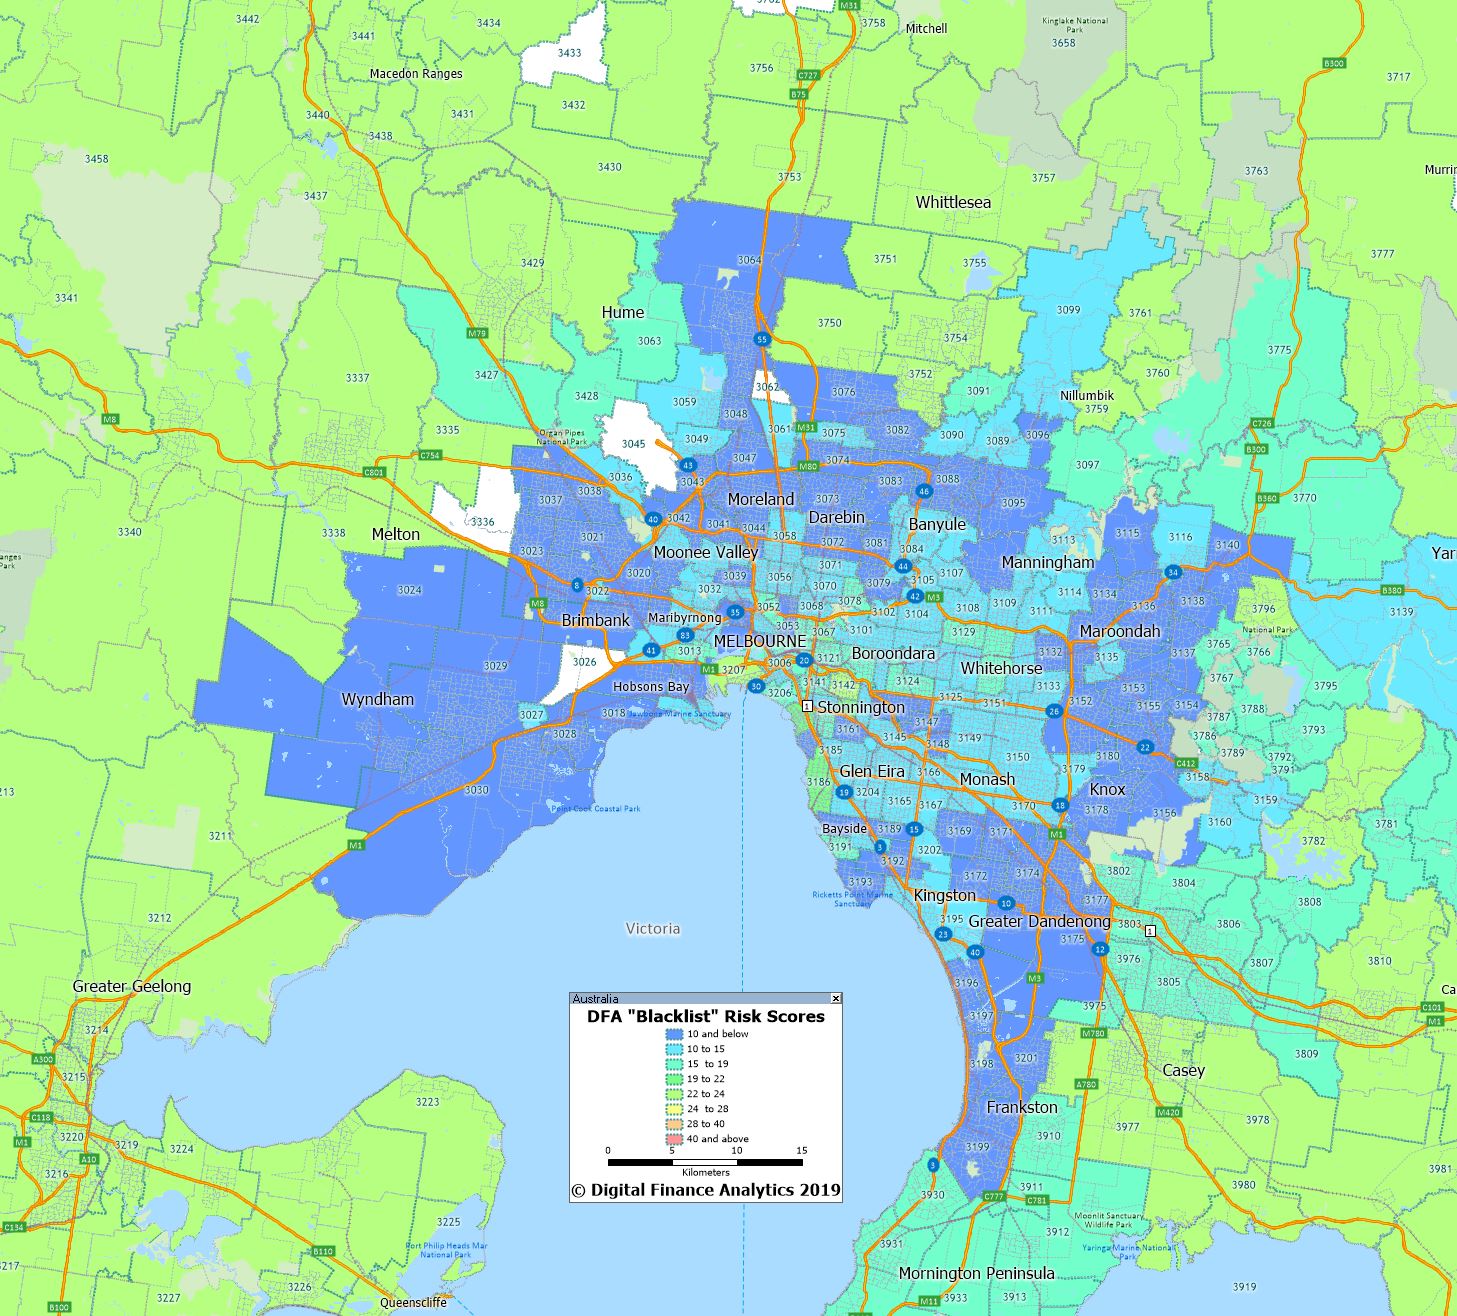
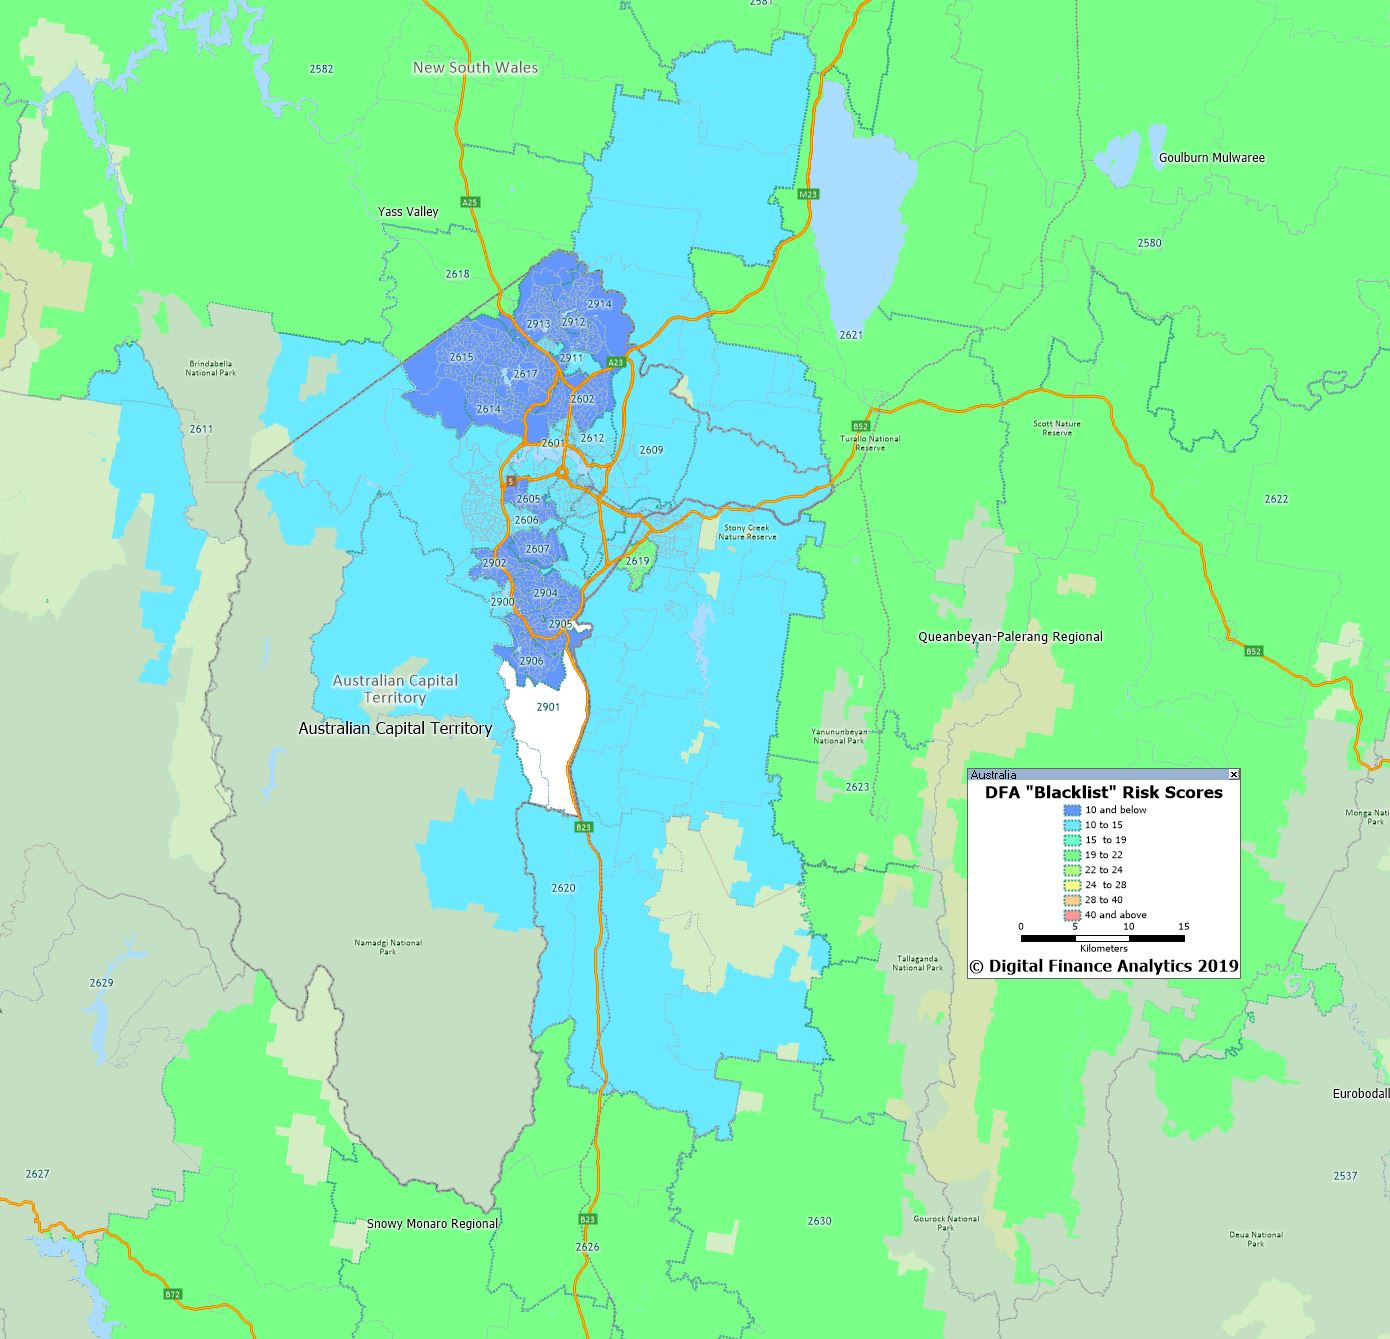
DFA has developed a risk scoring system, which combines information from lenders, and households to provide an indicator of the relative likelihood of an applicant successfully obtaining a mortgage, within a specific post code, and the relative weighting in terms of loan-to-value (LVR) and other factors which will be taken into account.
Additional factors will also include the mix between high-rise and low-rise development (some banks have blacklisted certain development types in some suburbs), and recent home price moves.
On the DFA Blacklist scale, the higher the score, the greater the difficulty in obtaining finance. In practice, this also reflects the relative risks of mortgage stress and default, and is also subject to an economic overlay in terms of relative economic performance and household finances. This was featured in an ABC piece last week. It is not predicative, rather it reflects current behaviour and past risk.
While individual household scores will vary, an average post code score above 15 represent higher than normal risk, meaning many lenders will require a larger deposit, or may prefer not to lend at all. The higher the score, the greater the difficulty in getting finance.
Since I have received many requests for more information, today we are releasing more complete mapping, which is up to the end of April 2019.
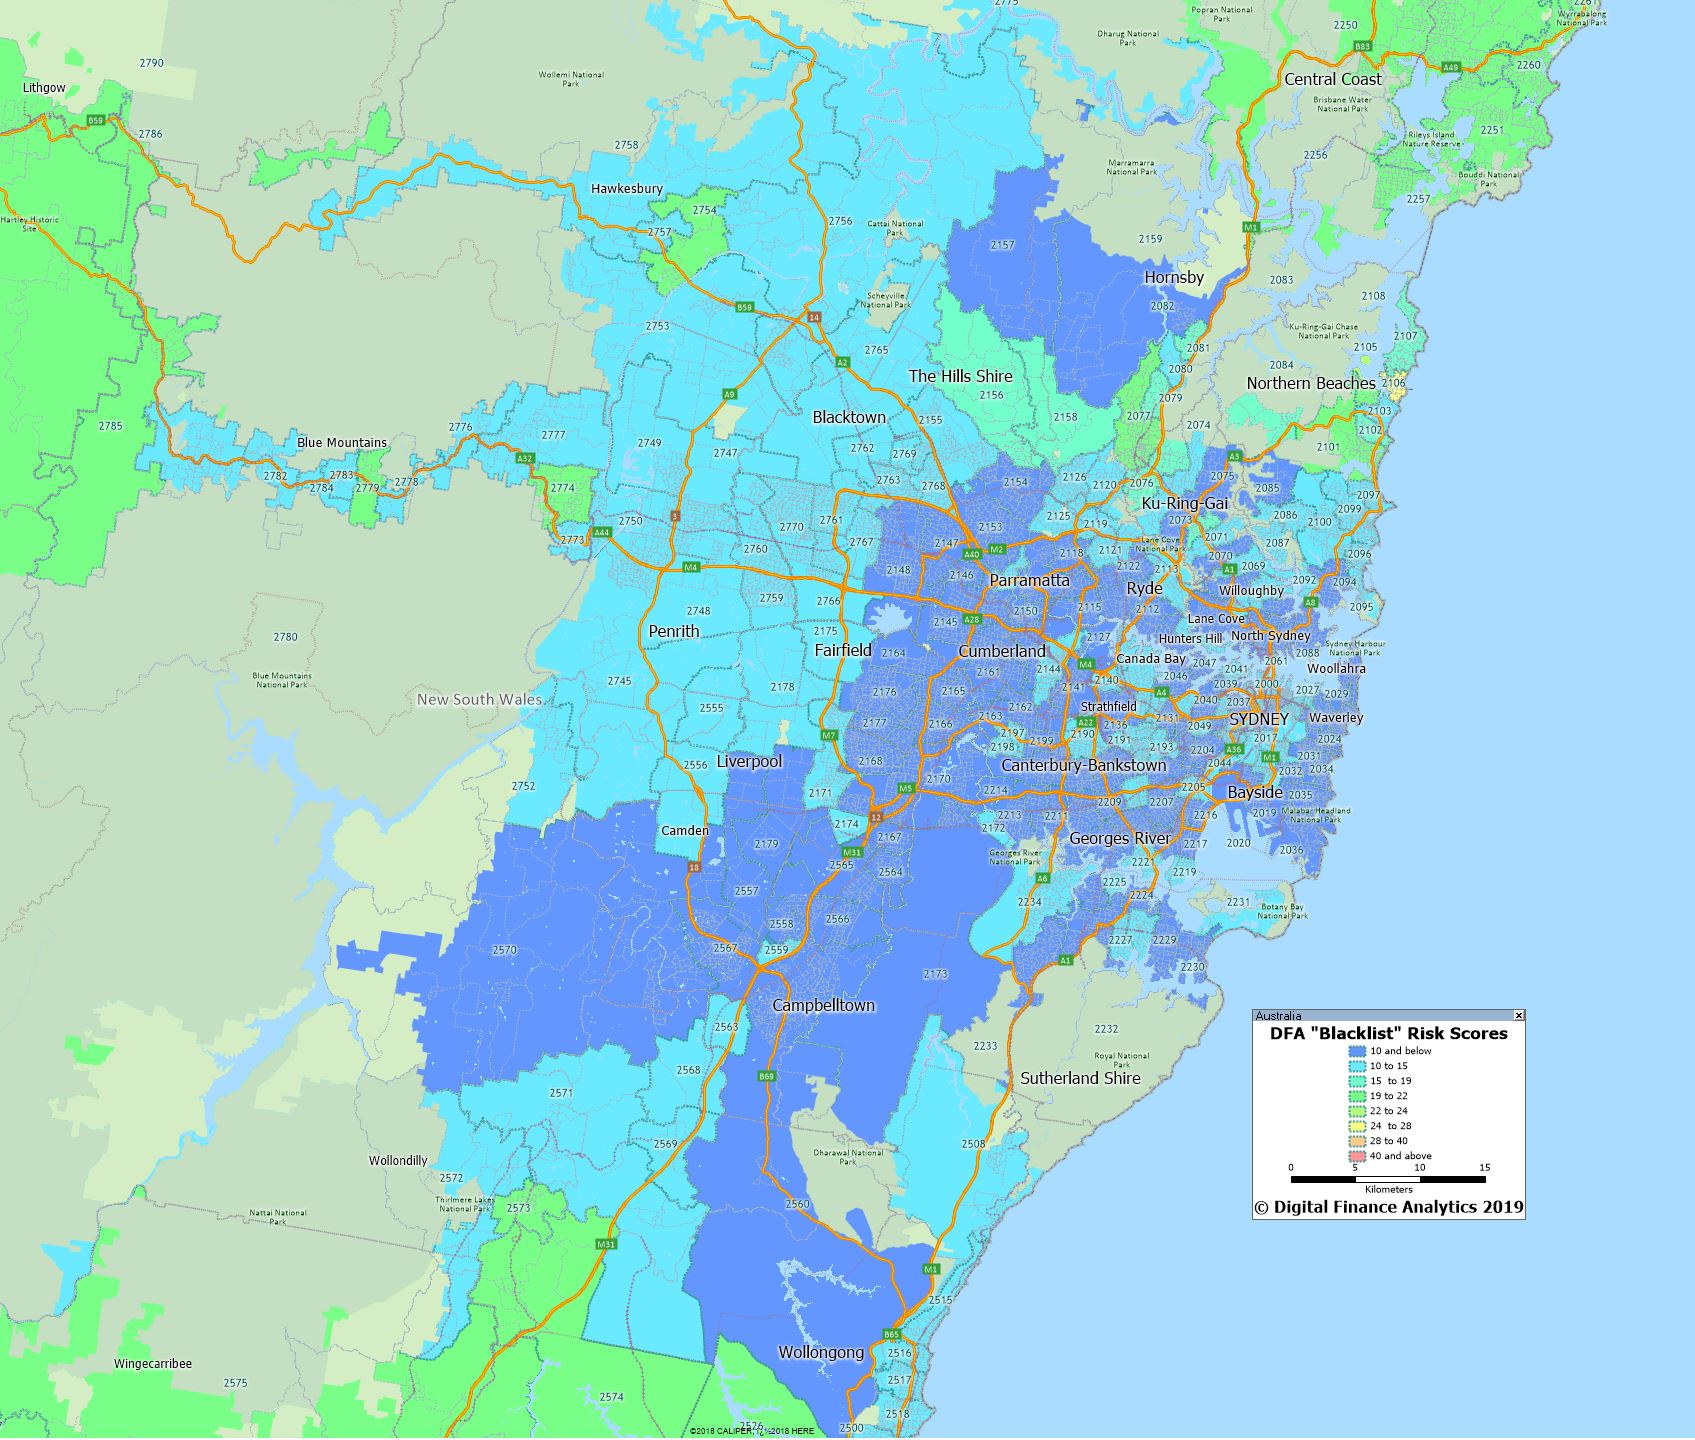
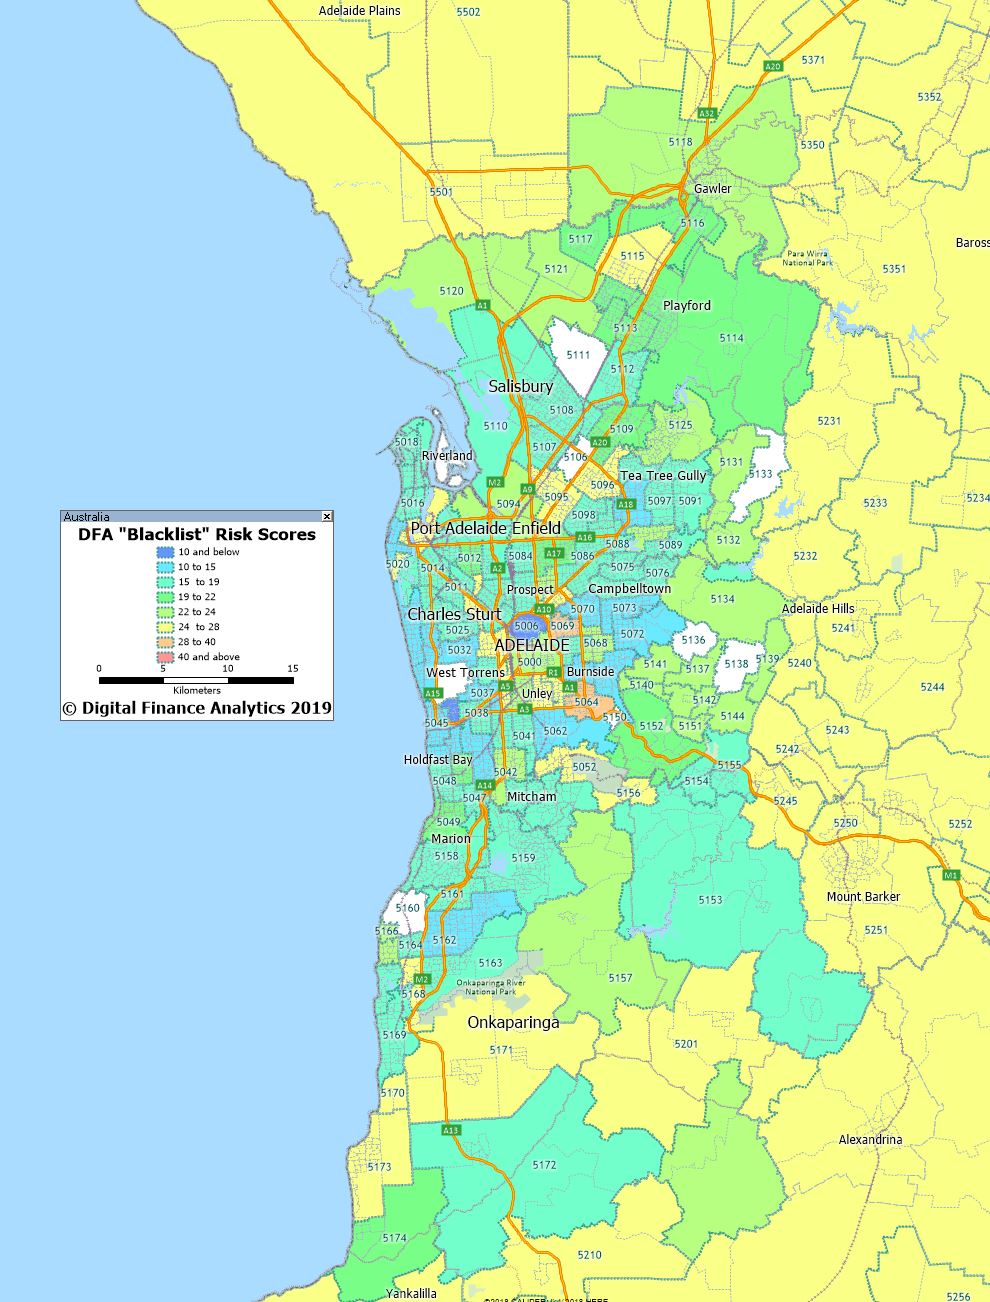
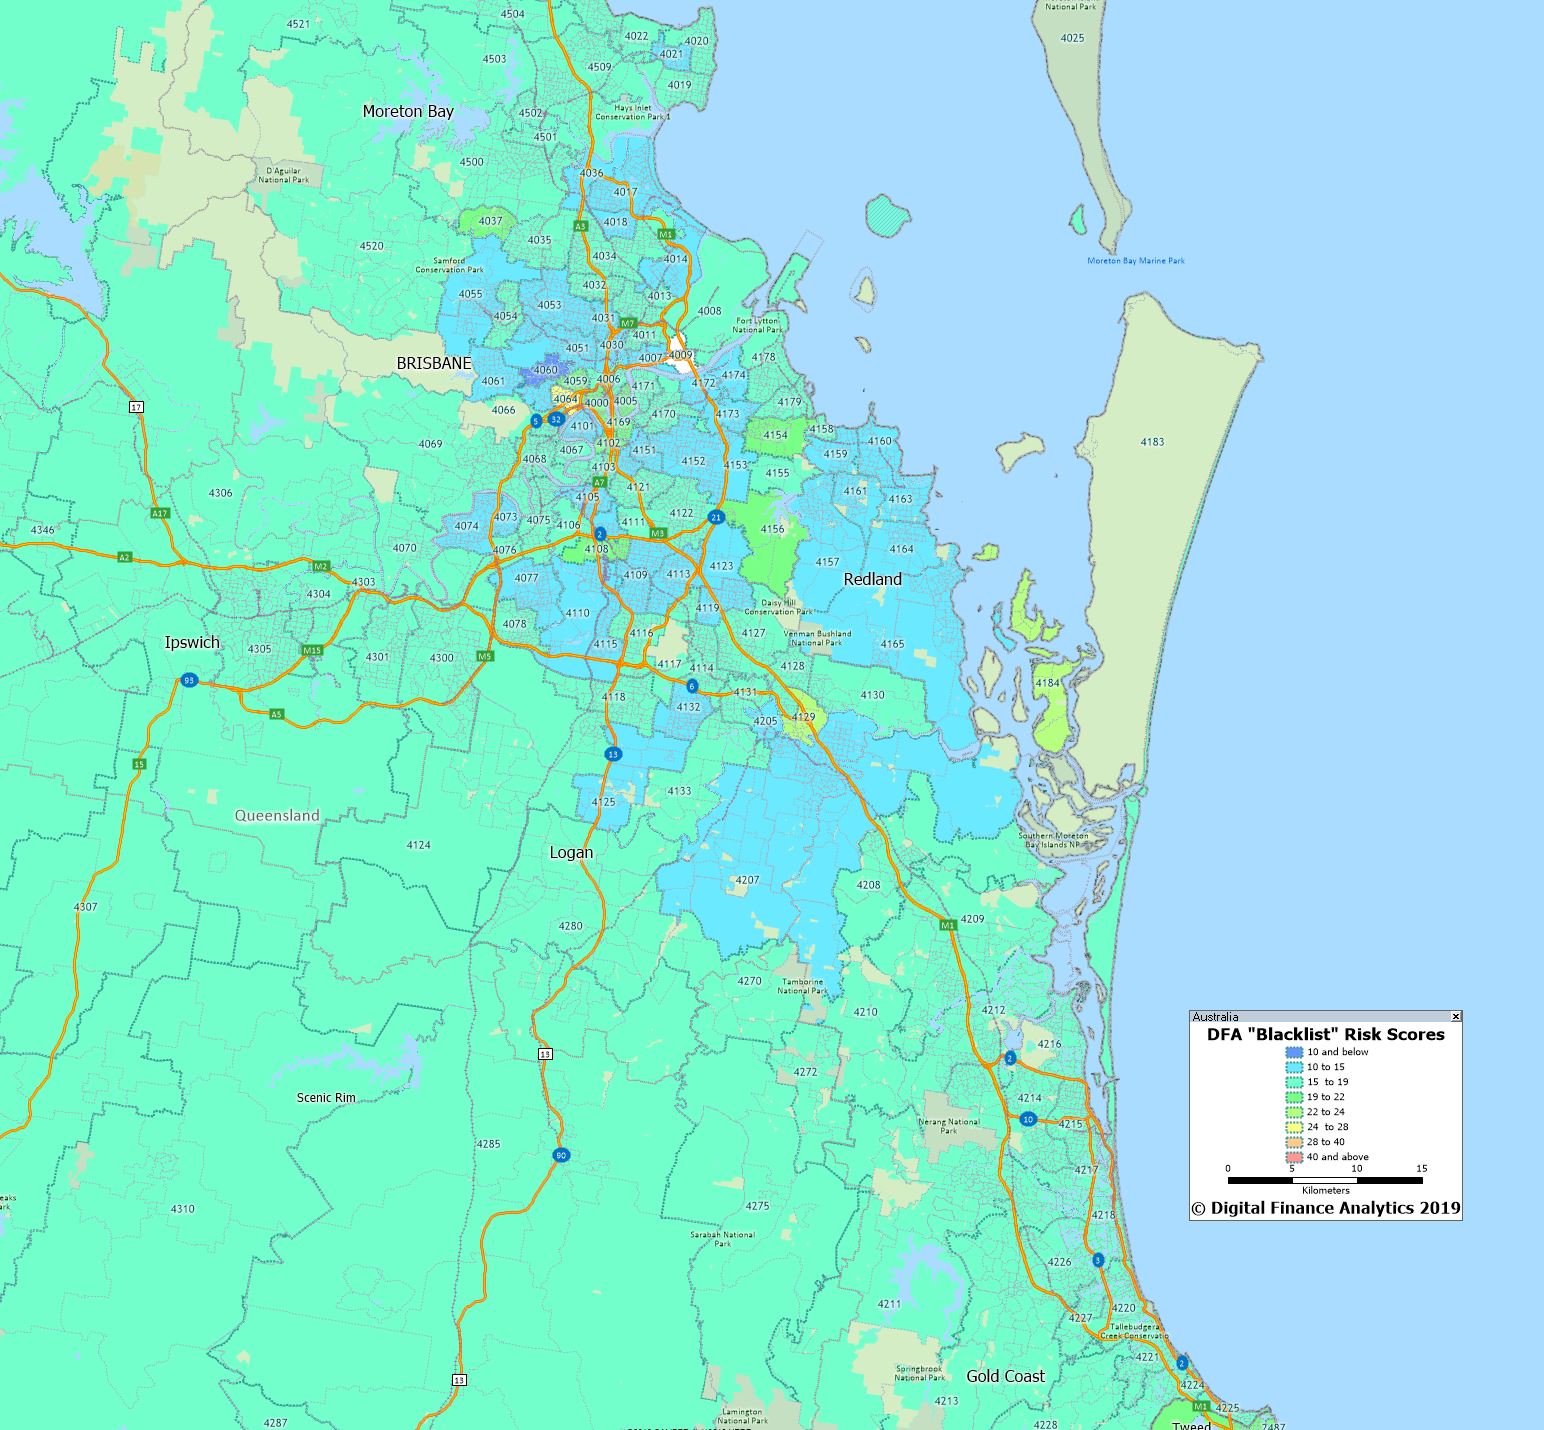
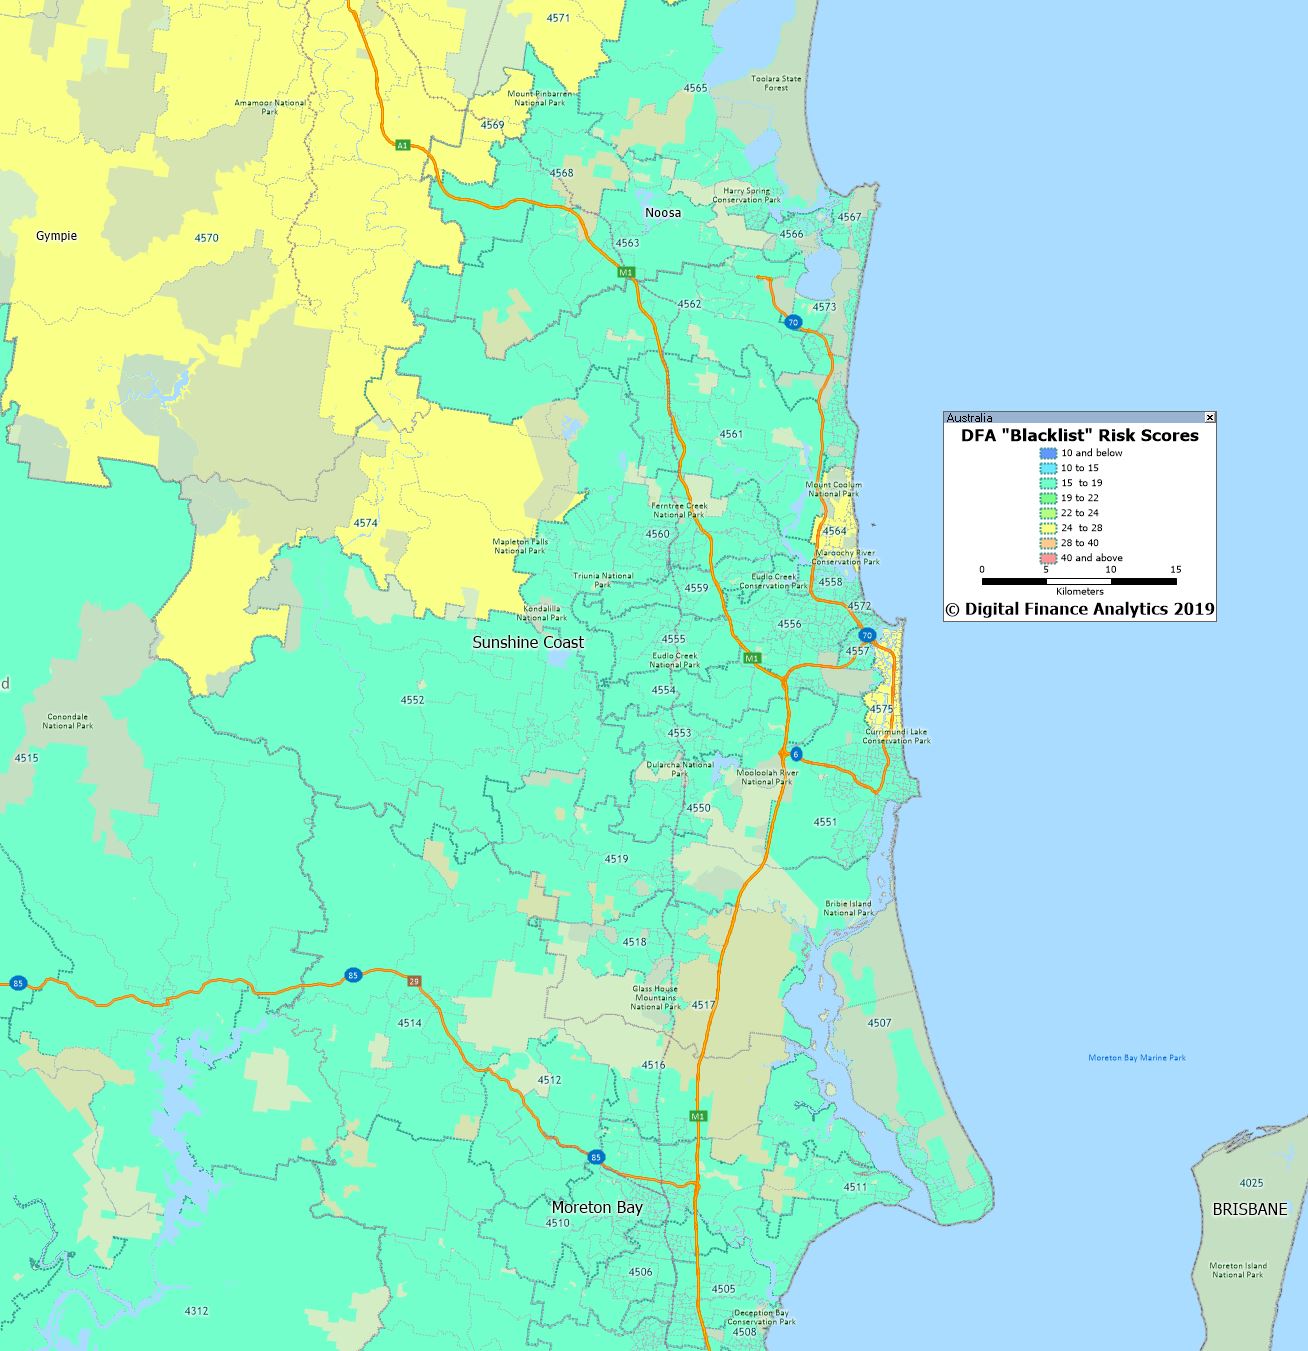
The maps are presented in native high resolution. The blue shades are low scoring post codes. Red shows highest scores.
Western Australia, as represented by the area around Perth is by far the most blacklisted region.
In comparison Sydney scores are lower, though with some hot spots.
Melbourne also shows a few hot spots.
Adelaide has some risk areas.
Brisbane and the Gold Coast are fairing quite well (but again, with some hot spots).
The Sunshine Coast is more problematical.
The ACT scored pretty low.
While Darwin was more problematic, reflecting the significant falls in values in recent years, and the economic conditions there.
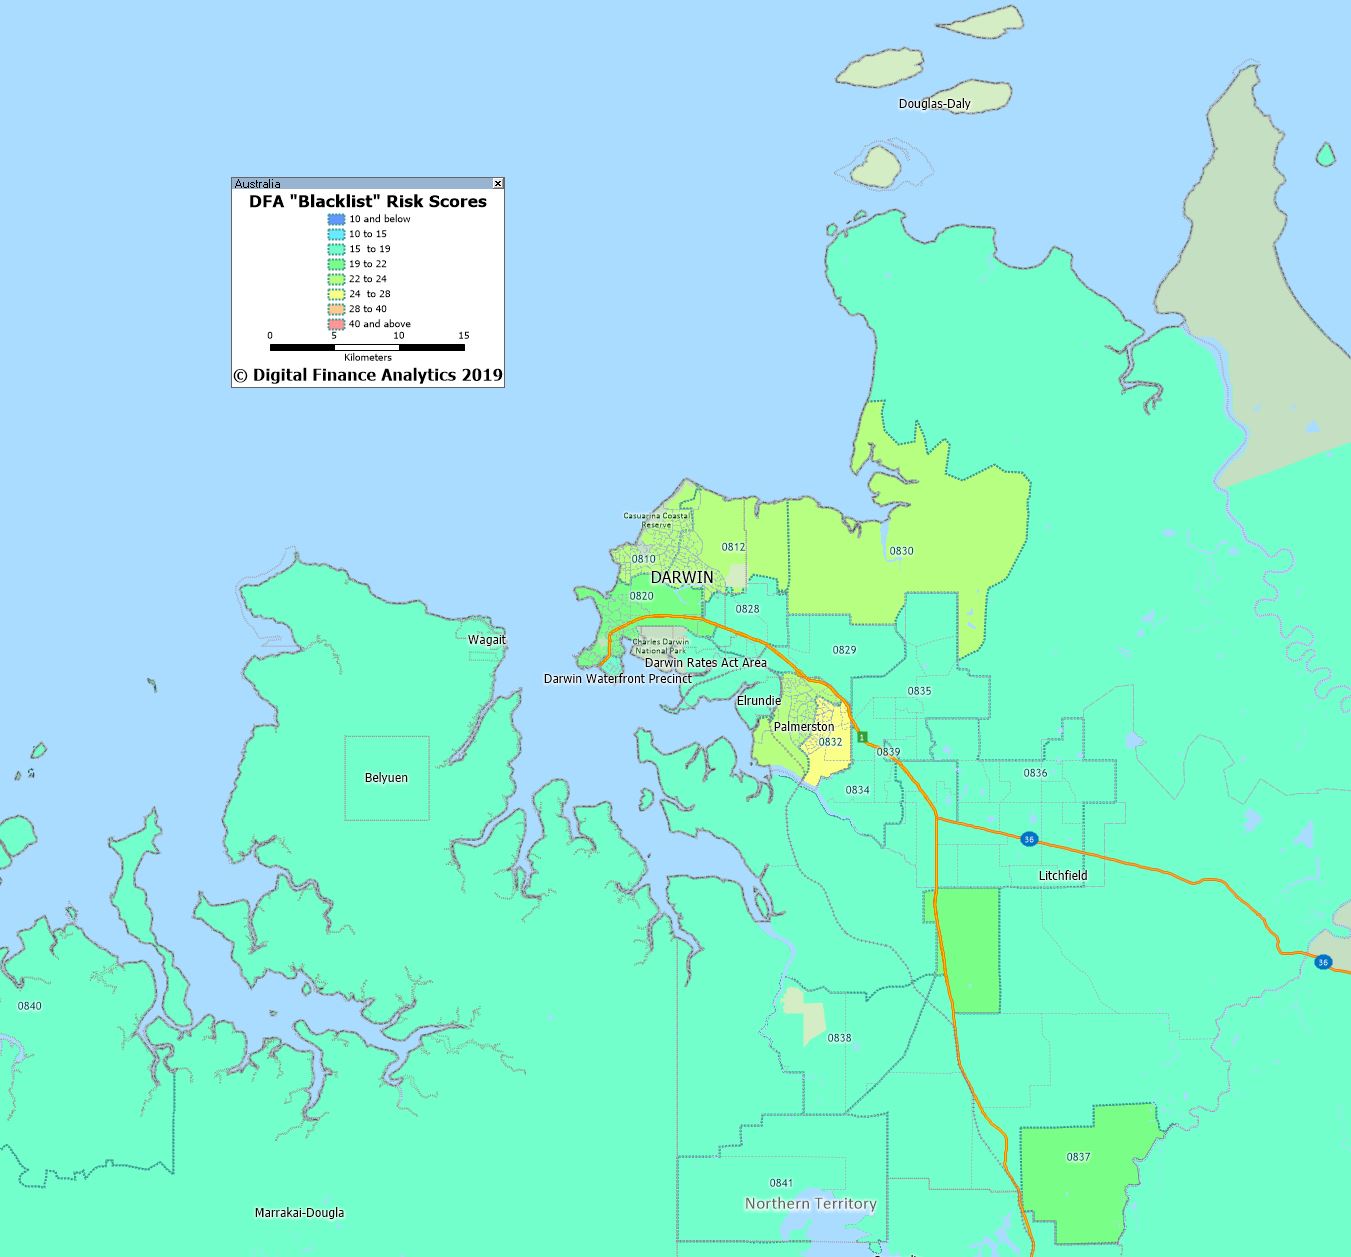
To emphasise the point, individual lenders and borrowers circumstances will vary, but our analysis does highlight that not all post codes are born equally when it comes to mortgage applications.