RBA Deputy Governor Guy Debelle summarised the Bank’s assessment of the various measures put in place to address the risks around housing lending. He argues risks are under control, though external shocks could still hit household balance sheets. Loose ending is not seen as a risk…. Hmmmm! Whilst the regulatory measures have significantly reduced the riskiness of new housing lending, we have masses of loans written under weaker regulation, which are exposed.
The motivation for implementing these various measures was to address the mounting risk to household balance sheets arising from the rapid growth of certain forms of lending, in particular lending to investors and interest-only (IO) lending. The strong growth in investor borrowing was increasing the risk that investor activity could be excessively boosting housing prices and construction and so increasing the probability of a subsequent sharp unwinding. This risk is greater for investor borrowing than owner-occupiers as investors can behave pro-cyclically, withdrawing from the market as it declines. The rise in the prevalence of interest-only borrowing for both investors and owner-occupiers increased the overall risk profile of household borrowing. No principal is repaid during the IO period, and the increase in required repayments can be large when the IO period expires.
I don’t see the riskiness of the borrowing as being the source of the negative shock. My concern is for its potential to be an accelerator to a negative shock from another source. To put it another way, I don’t regard it as likely that household borrowing will collapse under its own weight. Rather, if a negative shock were to hit the Australian economy, particularly one that caused a sizeable rise in unemployment, then the risk on the household balance sheet would magnify the adverse effect of that shock. This would have first order consequences for the economy and hence also for monetary policy.
To repeat the conclusion of the assessment in the FSR: the measures have helped to reduce the riskiness of new borrowing. In turn, this has stemmed the increase in household sector vulnerabilities and improved the resilience of the economy to future shocks. The measures have led to a slowing in credit growth but there is little evidence to suggest that the measures have excessively constrained aggregate credit supply. Housing credit growth has slowed, but it is still running at 5 per cent.
The various measures implemented to address the riskiness of housing lending fall into three categories:[1]
Lending standards or serviceability criteria. This includes tightening up the assessment and verification of borrower income and expenses, the discouragement of high loan-to-valuation ratio (LVR) loans and ensuring that minimum interest rate buffers were being applied, including on existing loans.
Investor lending growth benchmark. A 10 per cent cap on investor lending growth was introduced in December 2014.
A cap on the share of interest-only loans in new lending of no more than 30 per cent.
These measures were introduced progressively over a number of years. The scrutiny on serviceability by both APRA and ASIC has been underway for over four years now. For example, in September 2015, APRA noted that by then, serviceability practices had been tightened, such as the haircutting of various forms of income, including rental income. At the same time, APRA reported that minimum interest rate buffers and floors were also being more consistently applied.
This means that these tighter lending standards have been in place for a while now. They are not a recent phenomenon. But this also makes assessing the overall impact difficult in some cases, though the effect of some of the measures has been obvious. There clearly has also been an interaction between them.
What Has Been the Effect of These Various Measures?
Different interest rates are now charged across the various types of mortgages. Interest rates are higher on investor lending and interest-only lending than they are on owner-occupier lending (Graph 1). Previously there was little, if any, variation in the interest rate charged on different types of loans, beyond the size of the discount that varied with borrower income and the size of the loan.
Graph 1
Rather than use quantitative restrictions on the flow of new investor or interest-only lending to meet the requirements, banks chose to increase the interest rate on all loans of these types, both new and existing. Judging by what happened, it appears that the impact of the interest rate changes on borrower activity was difficult to calibrate. The banks seem to have increased rates by more than enough to achieve the requirements with most significantly undershooting the caps on both investor lending growth and the share of IO loans.
Investor lending growth took a while to respond to the introduction of the growth benchmark, in part because banks didn’t increase interest rates on investor loans until some time after its introduction (Graph 2). But there was a sharp and immediate slowing in response to the cap on IO lending. The share of IO loans in the flow of new lending declined sharply from 40 per cent in March 2017 to 17 per cent by September 2017 and has remained around 15 per cent since then. At the same time, the share of new lending with LVRs greater than 90 per cent has declined for both owner-occupiers and investors. In particular, there is now only a very small amount of loans to investors being written with LVRs over 90 per cent. Investor credit is now barely growing. Lending to owner-occupiers has slowed but is still growing at 6½ per cent.
Graph 2
As a result there has been a sizeable shift in the composition of the stock of housing lending. In addition, in response to both measures, a sizeable number of borrowers switched from an investor and/or IO loan to a principal and interest (P&I) owner-occupier loan reflecting the now significant interest differential. As a result of switching and weaker growth of investor lending, we estimate the share of housing loans to investors has declined by 5 percentage points to around one-third. Interest-only loans currently comprise 27 per cent of the stock, having been as much as 40 per cent (Graph 3). These changes decrease the riskiness of the stock of housing lending.
Graph 3
There has been a decrease in maximum loan sizes offered by banks to new borrowers in response to the tightening of the serviceability requirements. How big an effect might this have?[2] As any of you who have applied for a home loan may know, often the bank is willing to lend you much more than you want to borrow. Now they are willing to lend you less on average, by around 20 per cent. How much impact this actually has in aggregate depends on how many people are now constrained by this lower maximum loan size that weren’t previously. Using data from the HILDA survey, we estimate that the share of borrowers who are near their maximum loan and so are affected by this change is small, though for those who are constrained the effect can be quite large. Our assessment is that the aggregate impact is less than it would appear on the face of it.
As a consequence of the greater scrutiny of interest-only lending and the tightening of serviceability requirements, some borrowers are no longer able to roll over their IO loan at the expiry of the IO period. The shift to a P&I loan can cause their required payments to increase by as much as 30–40 per cent.[3] Liaison with lenders suggests that some borrowers have encountered repayment difficulties after switching to P&I repayments at the end of their IO terms, but that many have subsequently been able to adjust to higher payments within a year. Loan-level data from the Reserve Bank’s Securitisation Dataset supports this. It is also worth remembering that this process has already being going for quite some time, but we have yet to see it have a material effect on arrears rates. It still has a couple more years to run before the stock of expiring IO loans will have all been written under the current tighter serviceability criteria. But based on the experience to date, I don’t see this is a material risk, particularly given the current favourable macro environment.
Competition
Turning now to look at the effect on these measures on competition. (This is covered in more detail in the FSR Chapter). The investor lending benchmark did have a competitive impact for a time in that it constrained the ability of smaller lenders to gain market share by increasing their lending faster than 10 per cent. That said, with investor lending growing at or below 5 per cent since early 2016, it has not been a significant constraint on most lenders increasing their market share for some time now. Indeed, recently we have seen smaller lenders again gaining market share. Currently the major banks’ share of new lending is at its lowest in a decade. At the same time, there was no constraint on the ability of smaller lenders to gain market share in the owner-occupier market. The interest-only cap did not obviously have an effect on competition. Again, with nearly all lenders well below the 30 per cent threshold, it is not a binding constraint on lenders from increasing their market share.
The tighter lending standards have seen an increasing share of borrowers obtain finance from non-ADI lenders. These lenders are subject to regulatory oversight but less than that of ADI lenders. They are subject to ASIC’s responsible lending standards but not to prudential supervision by APRA. Non-ADIs’ housing lending has been growing rapidly, over twice the rate of growth of ADIs. As a result, the estimated non-ADI share of housing credit has also increased, although it remains less than 5 per cent of the total.
Effect on the Housing Market
The integral relationship between debt and housing prices means that these measures have clearly influenced conditions in the housing market. The FSR analyses in detail the impact on the housing market of the investor lending benchmark in 2014. It uses the fact that the share of investors varies across different parts of the housing market. Differentiating between ‘high’ investor regions and ‘low’ investor regions, the analysis shows that high investor regions had very similar price growth to low investor regions before the benchmark was implemented. In contrast, after the benchmark was introduced, house price growth has been notably slower in the higher investor regions.
Other factors may have also contributed to the divergent price growth between the high and low investor regions. For example, regions with a high share of investors may have also experienced larger increases in housing supply and so slower price growth in the period after the benchmark was introduced. The analysis attempts to control for these other factors and concludes that the policy effect accounts for around two-thirds of the 7 percentage point difference in average cumulative housing price growth between high and low investor regions from December 2014 to mid 2018 (Graph 4).
Graph 4
Again it is worth reiterating that the measures are aimed at the resilience of household balance sheets, not house prices. The assessment of their effectiveness is around the riskiness of household balance sheets, not the outcomes in the housing market. But at the same time, they clearly are having a notable effect on the housing market.
Housing construction activity has been at a high level for some time now. Our forecast is for it to continue at this level for at least a year given the amount of work in the pipeline. Beyond that, we expect construction activity to decline from its peak. Off-the-plan apartment sales in the major east coast cities have declined since around mid 2017, with developers citing weaker demand from domestic investors, as well as from foreign buyers. One risk is that tighter lending standards could amplify the downturn in apartment markets if some buyers of off-the-plan apartments are unable to obtain finance. This could lead to an increase in settlement failures, further price falls and even tighter financing conditions for developers. However, to date, in our liaison with developers, few have reported much evidence of this.
While not directly related to the housing measures, there has been some tightening in credit for developers of residential property. This reflects lenders’ reducing their desired exposure to dwelling construction, which is higher-risk lending, particularly given the longer planning and construction lags of higher density dwelling construction. That is, banks are less willing to lend given the fall in prices. To the extent that the housing policy measures have contributed to the decline in investor demand and prices, they have indirectly affected developers’ access to finance. There is a risk that this process overshoots leading to a sharper or more protracted decline in activity than we currently expect.
The effect of a tightening in lending to developers seems to me to be a higher risk to the economic outlook than the direct effect of the tighter lending standards on households, which has ameliorated risk. Relatedly, there may also be a bigger impact on lending to small business given the extensive use of property as collateral for small business loans. This would be further exacerbated if the banks’ risk appetite for small business lending declines for other reasons.
Housing prices have fallen by almost 5 per cent from their late 2017 peak while the pace of housing credit growth has slowed over the past couple of years. The fall in housing prices is a combination of a number of other factors, including the very large increase in the supply of houses and apartments both now and in prospect. It also reflects a reduction in foreign demand, which has been affected by a tightening in the ability to shift money out of China and an increase in stamp duty in some states.
Some have attributed the slowing in housing credit solely to a tightening in the supply by banks in response to regulatory actions. Others have suggested there has been a weakening in housing demand and so demand for credit, including because of the high level of and weaker outlook for housing prices. To me, reductions in both the demand and supply of credit have been at play and it is hard to separate their effects. For example, tighter lending conditions have reduced how much some people can borrow, and this contributed to weaker demand for properties and so softer prices. Price falls have themselves contributed to weaker demand by investors who are no longer confident of rising values. Assessing the relative importance of demand and supply is also complicated by the fact that banks have cut back most on their lending to less credit-worthy borrowers, but have more aggressively targeted safer borrowers with lower interest rates.
Conclusion
The regulatory measures have significantly reduced the riskiness of new housing lending. A smaller share of new loans are to investors, are interest-only, have high LVRs or are to borrowers more likely to have difficulty repaying the loan. But it takes time for the riskiness of the stock of outstanding loans to improve. When you implement a change in lending standards the existing loans are no different to how they were the day before. But over time a larger share of outstanding loans will have been written with more stringent lending standards, while the larger share of principal and interest loans will see more of the outstanding loans have a declining balance over time. Finally, in assessing the overall riskiness of the debt both before and after the various measures, it is worth remembering that arrears rates remain low.
To conclude, the available evidence suggests that the policies have meaningfully reduced vulnerabilities associated with riskier household lending and so increased the resilience of the economy to future shocks.
Property Expert and Economist Joe Wilkes and I discuss the impact of foreign buyers in the New Zealand market, in the light of the recent ban, and the implications for the markets ahead.
Joe also looks at the impact of marginal borrowers on home prices and sales, in the light of recent data. This is an important concept which describes the network effect on prices and volumes as demand eases.
You can watch his previous show where he starts the NZ conversation as part of the UK background discussion, and some context for his comments.
More shows in the works as we amp up our coverage of the New Zealand market.
I discuss the current state of banking in Australia with businessman John Dahlsen, who was a director at ANZ for many years.
He brings his extensive experience to the issues facing the sector, and lays out an approach which would create more customer centric, efficient and lower risk banks.
In commercial litigation, as in most litigation, there is an emphasis on trying to settle matters early before they are heard in court.
In criminal law matters the prosecutions encourage early guilty pleas in exchange for lower penalties.
The Australian Securities and Investments Commission (ASIC) has been increasingly resorting to early settlements as a means of achieving cheaper and quicker outcomes.
The quick win for ASIC is an enforceable undertaking and a media release. The quick win for the other party is avoiding a drawn-out court case and being able to get on with its business.
Courts usually rubber-stamp them
Where the alleged breach of the law is serious, necessitating a large penalty, a judge has to formally approve the settlement, in a hearing until now regarded as something of a rubber-stamping exercise.
He rejected the joint application for settlement between ASIC and Westpac Banking Corporation for a penalty of A$35 million.
The problem, as he pointed out was that it was not clear from the agreed facts what actual contraventions of the National Consumer Credit Protection Act 2009 Westpac had been accused of.
He asked ASIC and the Westpac to redraft the agreed settlement and return to court by 27 November 2018.
To establish the law and what happened
The case matters because the Financial Services Royal Commission has been examining the use of computer programs to determine the ability of borrowers to repay loans.
It is possible that many Westpac loans were approved to customers who would have been found to be unable to meet the repayments had their individual circumstances been examined, and it is possible that is in breach of the law.
But without a clear judgment or a clear statement of facts for the court to examine, or a clear judgment from the court, it is impossible to tell.
That’s why Justice Perram said no, to establish what the law requires and what Westpac did.
Author: Michael Adams Professor of Corporate Law & Governance, School of Law, Western Sydney University
In our latest discussion with Economist John Adams we discuss the latest developments in the “Gold Quest”. Where is Australia’s gold and why won’t the RBA answer John’s questions?
As expected we are seeing the Government do “unnatural acts” to support the banking sector, in an attempt to alleviate the home price falls and lending freeze ahead of the election next year. The proposed $2 billion funding pool is small beer in the estimated $300 billion SME lending sector.
There is precedent a decade ago when the government’s $15 billion co-investment with the private sector into the residential mortgage-backed securities market during the GFC.
The federal government has announced a new, $2 billion Australian Business Securitisation Fund to help provide additional funding to small business lenders, via The Adviser.
In a joint statement, Treasurer Josh Frydenberg and the Minister for Small and Family Business, Skills and Vocational Education, Michaelia Cash, have announced that the Australian Business Securitisation Fund (ABSF) will “significantly enhance” the ability for small businesses to access funds by providing “significant additional funding to smaller banks and non-bank lenders to on-lend to small businesses on more competitive terms”.
The Australian Business Securitisation Fund will be administered by the Australian Office of Financial Management (AOFM), which was previously involved in the Residential Mortgage Backed Securities Market in 2008.
Speaking on Wednesday (14 November), the two ministers said: “Small businesses find it difficult to obtain finance other than on a secured basis – typically, against real estate. Small businesses that have already obtained finance secured against real estate, but wish to continue to grow, also find it difficult to access additional funding.
“Even when small businesses can access finance, funding costs are higher than they need to be.
“To overcome this and ensure that small businesses are able to fulfill their potential and continue to underpin economic growth and employment, the Australian Business Securitisation Fund will invest up to $2 billion in the securitisation market, providing significant additional funding to smaller banks and non-bank lenders to on-lend to small businesses on more competitive terms.”
The government has also reiterated that it will “encourage the establishment of an Australian Business Growth Fund to provide longer term equity funding”.
It is now in consultation with the prudential regulator (APRA) and several financial institutions in regard to the establishment of the fund, which could likely emulate overseas counterparts, such as the UK’s Business Growth Fund. This fund has reportedly invested around $2.7 billion in a range of sectors across the economy.
The ministers said: “Many small businesses find it difficult to attract passive equity investment which enables them to grow without taking on additional debt or giving up control of their business.
“A similar fund has not emerged in Australia, in part, as a result of the unfavourable treatment of equity for regulatory capital purposes.”
APRA has reportedly suggested that it is “willing to review these arrangements” to assist in facilitating the establishment of the Australian Business Growth Fund.
The government has said that it will host a series of meetings with stakeholders during the next sitting period in Canbera to “fast track” the establishment of the growth fund.
“With more than three million small businesses employing around seven million Australians, enhancing small business access to funding is part of the Coalition Government’s plan for a stronger economy,” the ministers said in a joint release.
Several players in the finance sector have welcomed the announcement, with NAB’s chief customer officer, business and private banking, Anthony Healy, saying that “the country’s largest business bank recognised that for Australia to continue to grow, SME businesses need better and easier access to capital”.
Mr Healy highlighted that NAB had been providing unsecured lending to small businesses through its QuickBiz channel, “helping SMEs borrow against the strength and cash flow of their business rather than physical bricks and mortar”.
He continued: “The Australian Business Growth Fund can help this further by providing a way in which SMEs can receive long term equity capital investments to grow their business, invest in new technology and create more jobs, which is why NAB is supportive of the concept.
“We do believe there is more that can be done to provide SMEs with access to equity capital, and we take confidence from the UK Business Growth Fund having operated successfully for several years.
“We look forward to further discussions with the federal government and other participants about the fund’s potential establishment soon,” said Mr Healy.
Likewise, Spotcap’s managing director, Lachlan Heussler, said: “Mr Frydenberg’s proposal meets a real financial need and is a win-win for both Australian small business owners and for the alternative lending industry in Australia.
“Without sustainable lending and affordable finance options, small and medium-sized businesses will struggle to grow, innovate and create more jobs for our economy.”
Mr Heussler continued: “Australia’s 2.2 million small and medium-sized businesses are the beating heart of our economy but are starved of working capital and under-served by traditional lenders who require security.
“By lowering borrowing costs, the proposed fund is a good step in increasing competition between the dominant, big lenders and online, unsecured lenders, such as Spotcap”.
The Council of Small Business Organisations Australia (COSBOA) likewise welcomed the news, with CEO Peter Strong stating: “We congratulate the hovernment, and the Treasurer Josh Frydenberg, on this decision. It’s a well needed game changer for financing of small businesses.”
Mr Strong said that securing access to affordable capital had become the “number one” challenge for small business owners in Australia, particularly as some banks had “relied solely on past earnings rather than taking future earnings potential into account”.
“As a result, if the business owner doesn’t have a house (or other major asset) to put on the line as security then they are stuck – and Australia misses out on the employment that can be generated by the future growth of these businesses,” he said.
Mr Strong continued: “Small business owners often tell me that the only time they can get a loan is when they no longer need it. Others have told me that they have had to travel overseas to get finance and, using the same business plan as they used in Australia, they get their loan. This was a crazy and damaging situation.”
Mr Strong continued: “It is by no means ‘free money’ but small businesses that are sound and have good growth potential will finally have access to affordable finance.”
Touching on the new growth fund, the COSBOA CEO stated: “Importantly, the Treasurer understands that the announcement would fail if the process of managing the funds is convoluted and complex.
“We, with others, have already been asked to join in designing the system to make sure it is fit for purpose and not made unfit by interference from those who don’t understand our sector. We look forward to working with the Morrison Government, the Treasurer, the Small Business and Family Enterprise Ombudsman and other stakeholders to make these two funds accessible for small business owners and start-ups.”
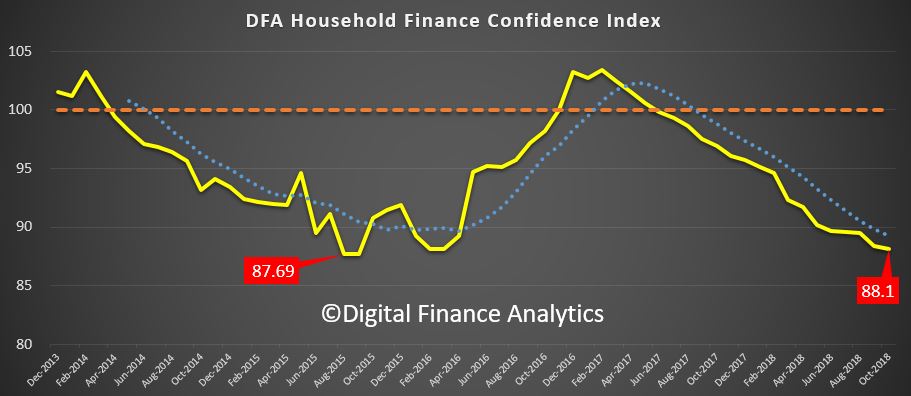
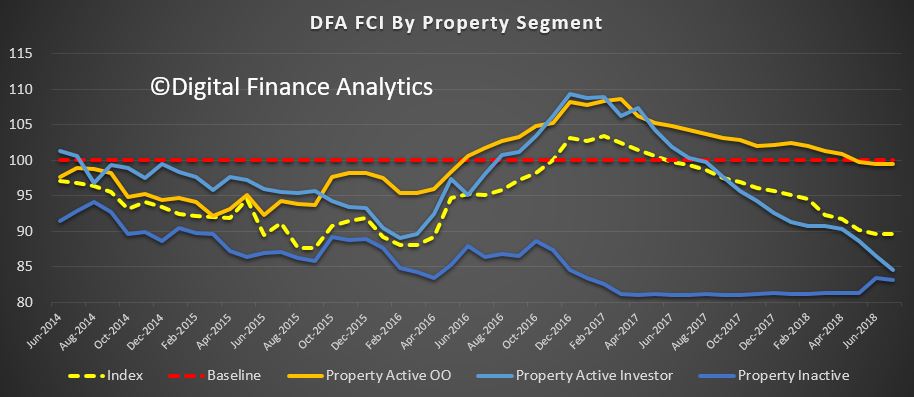
The results from the DFA household surveys to the end of October 2018 are out today. The index measures households overall comfort level with their finances across a number of key dimensions. Recent home price trends, lower returns on deposits and share market gyrations have combined to take the index lower, despite strong employment trends. The wealth effect is now working in reverse, with a potential impact on future consumption.
The index returned a result of 88.1, down from 88.4 last month. This continues the decline since late 2016, and is now approaching the lowest ratings from 2015.
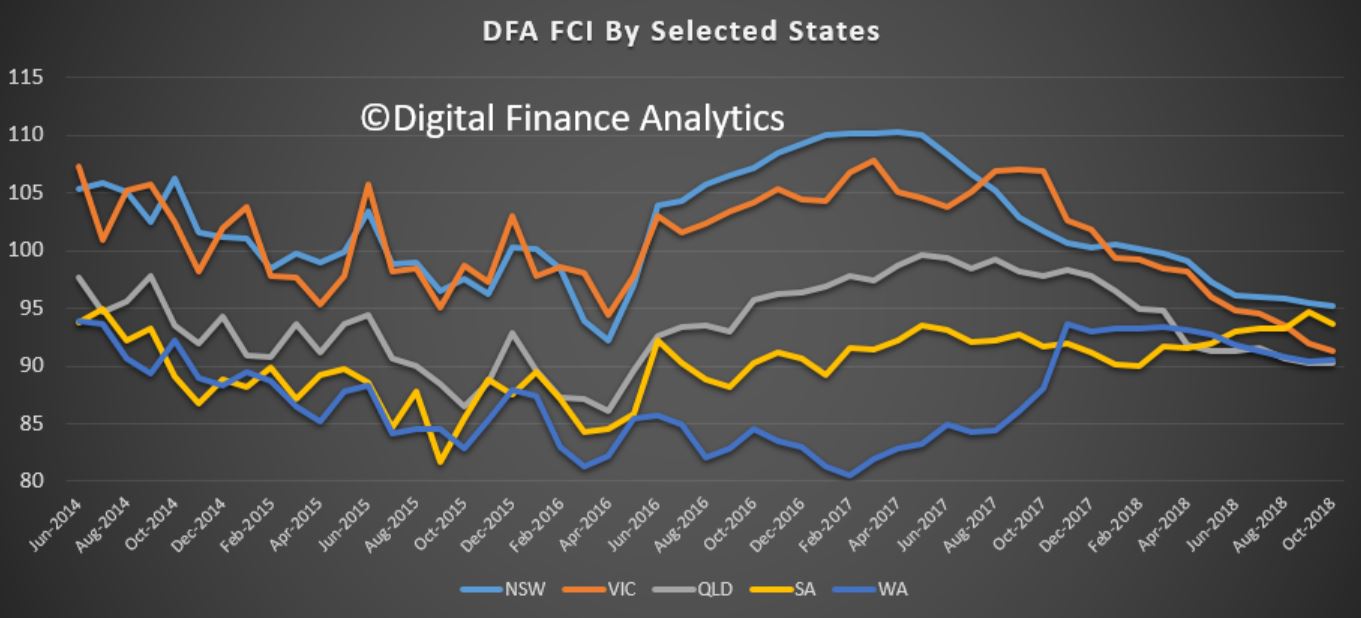
The convergence across the states continue as home price falls in NSW and VIC take a toll, with the southern state showing a significant slide. WA and QLD appear to be tracking quite closely.
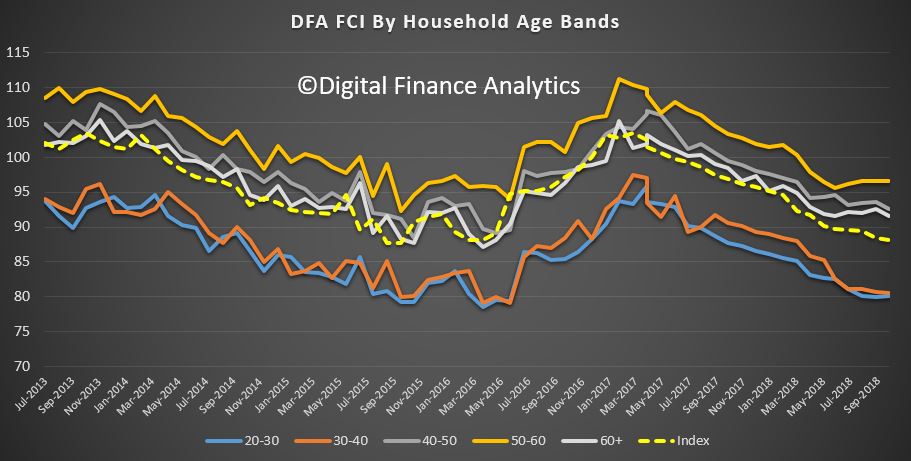
Across the age bands, younger households are under the most pressure (thanks to large mortgages, or renting) while those aged 50-60 years remain the most confident, thanks to lower net borrowing, and more savings and investments. For those aged 40-50 recent falls in property prices swamp any benefit from stock market performance.
Those holding property for owner occupation remain the most positive, despite falls in paper values of their homes, but property investors are now registering significant concerns, thanks to flat or falling net income from rentals, falling capital values and concerns about the future of negative gearing and capital gains tax relief. More property investors signalled an intention to seek to sell property, as the switch from interest only to principal and interest loans continues. More than 41% of mortgage applications were rejected, compared with 5% last year, as more rigorous underwriting standards bare down. In fact those renting are in many cases more confident than property investors, significant turn around. The great property investor decade in passing.
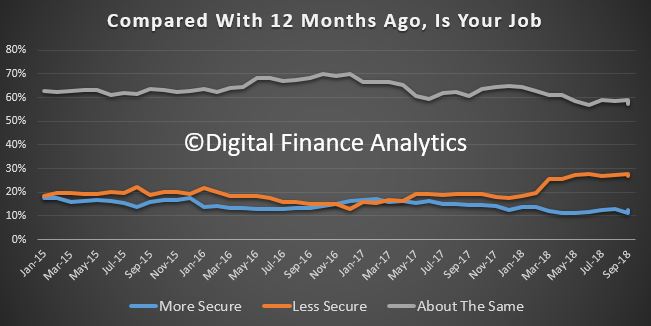
Turning to the moving parts within the index, there was a small fall in those feeling more insecure about their job prospects, down 0.71% to 26.99%. There was a rise of 1.53% in those feeling more secure to 12.68%, and as a result those saying there was no change dropped a little, down 1.91% to 57.14%. We continue to see the spread of more precarious employment, including gig economy jobs, zero hours contracts, and growth in low paid ancillary healthcare jobs. We also saw a significant fall in employment in the finance, construction and real estate sectors, as the property sector eases.
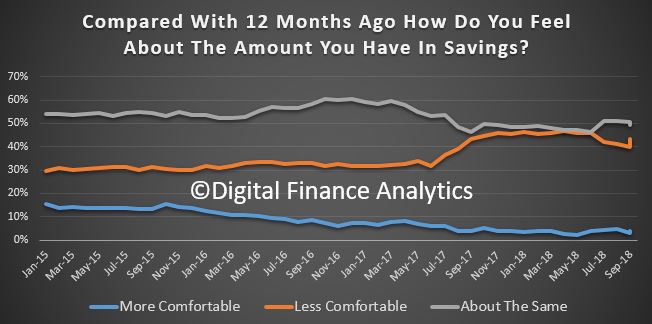
Savings have been hit by recent stock market ructions, plus lower deposit rates on call accounts. As a result, there was a 3.38% rise in those less comfortable with their savings, to 43.39%. 49.28% said there was no change.
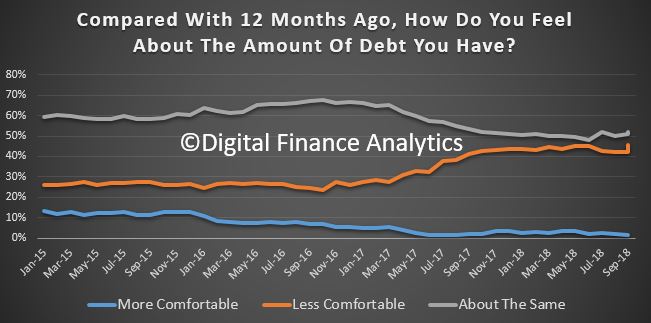
On debt, 45.47% of households were more concerned about their debt holdings, up 3.48%, thanks to some higher interest rates, rejected loan applications, and falling property values eating into equity, so reducing loan to value ratios. That said, those seeing no change stood at 51.87%, so more than half of households do not see any significant change.
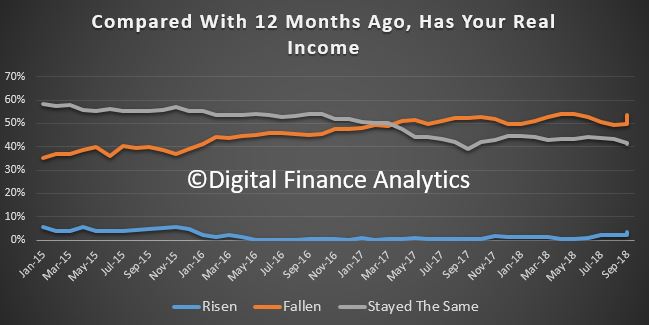
Looking at household cash flow, income growth remains anemic in real terms. Just 3.69% said they had real income growth in the past year, up 1.32%, partly thanks to recent wage awards. However, 53.71% said their incomes had fallen over the same period, up 4.01%, and 41.33% said there was no change. Those in the public sector (especially in Canberra) appear to be fairing the best.
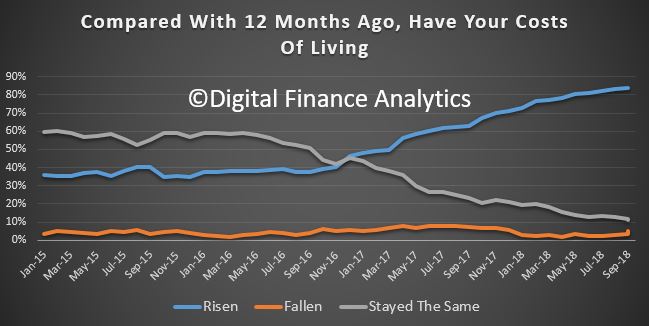
On the costs side of the equation, recent oil price falls have yet to translate into the results, so households said that overwhelmingly their costs of living has risen in the past year – at 83.66%. 4.88% said their costs had fallen, up 1.50% and 11.33% said there was no change. We see find households discussing power bills, fuel, health care costs and child care expenses, but they also highlighted recent rises in some food staples and council charges.
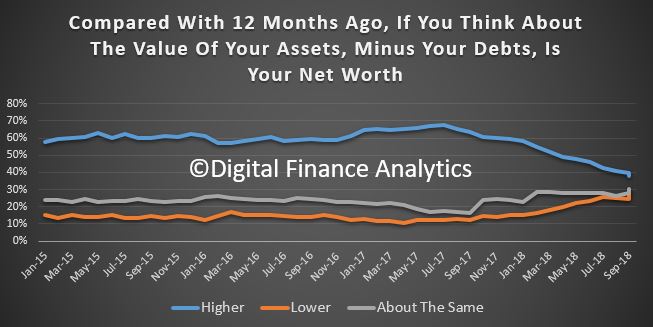
So finally, we can look at net worth (assets minus debts). Around 30% of households reported no change compared with a year ago, but 30.6% reported a net fall, up 5.27% and directly associated with the fall in property values and share values. 37.92% said their net worth was higher, down 1.89% from last month. So the fall in values is now hitting home, and as a result more households are experiencing a negative wealth effect.
This may well be deadly to household consumption (the engine of growth from the RBA’s perspective). This all goes to show that tracking employment growth as a leading indicator of the economy is not telling the whole story.
Slow wages growth, falling home prices and rising costs are combining to drag wealth and household confidence lower, and there is no end in sight. Another reason why we think the RBA will not be lifting the cash rate any time soon.
By way of background, these results are derived from our household surveys, averaged across Australia. We have 52,000 households in our sample at any one time. We include detailed questions covering various aspects of a household’s financial footprint. The index measures how households are feeling about their financial health. To calculate the index we ask questions which cover a number of different dimensions. We start by asking households how confident they are feeling about their job security, whether their real income has risen or fallen in the past year, their view on their costs of living over the same period, whether they have increased their loans and other outstanding debts including credit cards and whether they are saving more than last year. Finally we ask about their overall change in net worth over the past 12 months – by net worth we mean net assets less outstanding debts.
In our latest video show I caught up with Joseph Wilks who was on the front line of the UK property market in 2008 and beyond.
He describes what happened (and the parallels with Australia) and also explores some of the dynamics of the New Zealand property market which seems to have some of the same hallmarks.
Domain has released their preliminary auction results for today. The final results from last week came in at 38% nationally, and the early results from today also look weak. Significantly lower than this time last year, and they are likely to settle lower again.
Their graph cuts off at 40% so lower than that do not show.
Brisbane listed 111, reported 54 and sold 22 with 7 withdrawn, giving a Domain clearance rate of 36%.
Adelaide listed 72, reported 32 and sold 21 with 6 withdrawn, giving a Domain clearance rate of 55%.
Canberra listed 89, reported 72 and sold 32 with 7 withdrawn giving a Domain clearance of 41%.
Welcome to the Property Imperative weekly to 10th November 2018, our digest of the latest finance and property news with a distinctively Australian flavour.
Loads more data this week, all pointing to the impact that tighter credit conditions are having on the economy – that is unless you are the RBA, which seems to see everything as just fine and missing the debt bomb elephant in the room.
Watch the video, listen to the podcast or read the transcript.
And by the way you value the content we produce please do consider joining our Patreon programme, where you can support our ability to continue to make great content.
We start with the latest lending stats from the ABS. Further evidence of the lending slow down came through in spades in their housing finance statistics to September 2018. Looking at the trend flows first, new lending for owner occupation fell 1.7% compared with last month, to $13.78 billion. Investment lending flows fell 0.8%, to $8.96 billion, and owner occupied refinanced loans were flat at $6.24 billion. Refinanced loans as a proportion of all flows rose to 20.8% and we continue to see this sector of the market the main battleground for lenders who are trying to attract lower risk existing borrowers with keen rates. Investment loans, were 39.4% of all new loans, up again from last month as owner occupied lending demand eases.
Looking at all the categories of loans month on month, we see lending for owner occupied construction down 1.2%, lending for the purchase of new dwellings down 2.2%, lending for the purchase of other existing dwellings down 1.7%, while investment lending for the construction of new property fell 2.5%, investment property for individuals fell 0.6% and investment lending for other entities, such as self-managed super funds, dropped 2.2%. As a result, total flows were down 1.1% compared with last month.
First time buyers were also down in number in September, falling by 8.8% to 8,693 new loans. This was 18% of all loans, up from 17.8% last month. As we highlighted in our recent post “Mortgage Lending Enters the Danger Zone”, household debt is still rising, home prices are falling creating a negative wealth effect, and this will drive prices lower still.
Yet according to the RBA’s latest statement on Monetary policy, all is well, as they continue to paint a picture of underlying momentum in the economy based on jobs growth, low unemployment, and a prospect of wages growth, but still down the track. “GDP growth is running above 3 per cent. The unemployment rate has declined noticeably, reaching 5 per cent in the month of September. GDP growth is now expected to be around 3½ per cent on average over 2018 and 2019, but to ease in the latter part of the forecast period as production of some resource commodities stabilises at high levels”. They of course left the cash rate unchanged on Tuesday.
They are now forecasting an unemployment rate down to 4¾ per cent by the end of 2020. That would normally be a catalyst for wage rises, but we are not so sure that logic works any more given the international evidence, and the different employment structures (e.g. gig economy, part-time work, zero hours’ contracts etc.).
GDP was helped by strong terms of trade thanks to higher commodity prices. “Global energy demand has supported oil, liquefied natural gas (LNG) and thermal coal prices, while ongoing strong demand for steel in China and, increasingly, India, has supported the prices of iron ore and coking coal; supply disruptions have also boosted coking coal prices in recent quarters. But later they warn of a potential slow down.
They argue that the housing slowing down, which is apparent in most areas across the country is inconsequential, and the housing debt burden (high by any standards), is manageable. But we note the debt ratio is as high as ever it’s been, the household savings ratio is falling, and household wealth is declining thanks to falling prices now. This could well crimp consumption down the track. And that has supported GDP growth for years.
So overall, they say the positives outweigh the negatives, and the next few quarters are looking fine, but we believe there are a number of clouds on the horizon. These include further interest rate rises in the USA, flowing through to higher funding costs in Australia for many mortgage holders, the risks from China slowing, and possibility that wages growth will remain stuck in neutral. High household debt remains a significant burden. Yet they cannot see the elephant!
So whilst the RBA still suggest the cash rate may rise higher later, we think there is a significant chance they will have to cut further, to levels never seen before. Our read is there are significant risks in their outlook, and they are mostly on the downside. But then the RBA does have a habit of wearing rose-tinted glasses.
In fact, there is panic in the air as tightening credit spills over into falling home prices and potentially impacts the broader economy. Indeed, the AFR reported today that Treasurer Josh Frydenberg has urged banks to ease their lending clampdown for the public good as the government seeks to head off a royal commission-inspired credit crunch just as the housing market hits the skids. He expressed concern that lending across the board – for homebuyers, small business and borrowers – could tighten further after Commissioner Kenneth Hayne releases his final report by February 1.
The early reappointment of Australian Prudential Regulation Authority chairman Wayne Byres sends a message that is both poorly timed and off-key, given the important questions that have been raised by the royal commission. See out post “Shock Announcement Collapses Confidence And Trust In Australia’s Financial System”. Commissioner Ken Hayne’s interim report was so incendiary that it’s easy to forget it only covered the first two-thirds of the commission’s hearings.
The Reserve Bank of Australia and Treasury have also privately cautioned the Morrison government that any regulatory response to the financial services Royal Commission must be careful to avoid putting the brakes on lending to home buyers and business.
This is remarkable given the high debt ratios and mortgage stress, and is one of the “un-natural acts” we have been warning about. Let’s be clear, the Royal Commission has shone a light on poor practice, but APRA had already been applying belated pressure on the banks for loose lending, especially to investors and we have been in a long-term forced upswing thanks to poor Government policy, and weak supervision. This is now being pulled back, finally, but to BLAME the Royal Commission for this outcome is nonsense. It’s the same category as the exaggerated claims that Labor’s negative gearing reforms would hit existing investment property holders. It is just not true.
I discussed the underlying trends in the housing sector and why this is not just a bubble, but a structural crisis, in an interview I did with Alex Saunders from Nugget’s News. We explored the question of whether housing is in a bubble, micro-markets, and the expectations for the future trajectory of home prices given tighter lending conditions. And where might block chain fit in? You can watch the programme on YouTube.
I also discussed the latest results from our Mortgage Stress surveys. Having crossed the 1 million Rubicon last month, across Australia, more than 1,008,000 households are estimated to be now in mortgage stress (last month 1,003,000). This equates to 30.7% of owner occupied borrowing households. In addition, more than 22,000 of these are in severe stress. We estimate that more than 61,000 households risk 30-day default in the next 12 months. We continue to see the impact of flat wages growth, rising living costs and higher real mortgage rates. Bank losses are likely to rise a little ahead. We discussed these results in our post “October Mortgage Stress Update”.
It’s also worth noting that the ABS data this week on costs of living showed that many households seeing their costs rise way faster than the official CPI data. Most households would not be at all surprised.
We now know that the Royal Commission will be interrogating the major banks and the regulators in the final series of hearings, and there are some hard questions to be asked, about poor culture, behaviour standards and practice. Yet we noted that the 300 or so documents released this week from a range of players, are following “party lines”. The major banks are arguing in their submissions that no significant changes to structure or regulation are required, some of the smaller players argue they are at a competitive disadvantage thanks to the current industry structure and regulation and the mortgage broker sector argues that no significant changes are required to remuneration and conflict of interest rules. On the other hand, consumer groups stress the current issues of poor selling, advice and supervision.
And the submissions from the industry also lay bare more of the criminal activity, fraud, and worse, which has beset the sector. We still believe significant change is required, and you can watch our segment on this “Our Royal Commission Submission”. The regulators need a shake-up as well. So the question is, will the Royal Commissioner stand firm, or wilt under the pressure from so many stakeholders. I hope he can see the elephant in the room!
And talking of regulators, APRA released a paper this week on Loss-Absorbing Capacity of ADI’s. It shows that currently major Australian banks are at the lower end of Total Capital compared with international peers. As a result of proposed changes, major banks (Domestic systemically important banks in Australia, D-SIBs) will see their funding costs rise – incrementally over four years – by up to five basis points based on current pricing. This is intended to build in more financial resilience by lifting the capital requirements, centred on tier 2. Other banks may also be impacted to an extent.
If the D-SIBs were to maintain an additional four to five percentage points of Total Capital they would have ratios more in line with their international peers. But not in the top 25%, and the banks overseas are also lifting capital higher… so some tail chasing here! Is this “unquestionably strong”? “The aim of these proposals and resolution planning more broadly is to ensure that the failure of a financial institutions can be resolved in an orderly fashion, which protects the interests of beneficiaries and minimises disruption to the financial system,” APRA Chairman Mr Byres said. Written submissions are open to 8 February 2019.
The Bank reporting season revealed weaker profits, pressure on net interest margins, a rise in 90+ mortgage delinquencies, and more provisions for customer remediation. Yet, the banks managed to tweak their provisions to maintain capital levels. The earnings of Australia’s four major banks are likely to fall further in the near term due to slowing credit growth, especially in the residential mortgage segment, and further remediation and compliance costs associated with inquiries into the financial sector, including the Royal Commission, says Fitch Ratings. They said “Slower growth puts pressure on the banks to increase lending margins to maintain profitability. However, intense regulatory and public scrutiny of the sector, as well as strong competition, may make it difficult for the banks to reprice loans and pass on the recent increase in wholesale funding costs, as evidenced from the latest financial results. Net interest margins are therefore unlikely to improve in the short term”.
Jonathon Mott from UBS, one analyst I rate very highly, said: (1) ‘Underlying’ revenue fell -1.3% (h/h); (2) NIM was down 7bp to 199bp; (3) Average Interest Earning assets grew just 1.4% as the banks further tightened underwriting and continued to run off low yielding institutional assets; (4) Fee income and markets revenue were weaker; (5) ‘Underlying’ costs rose 1.9% (h/h) given ongoing investment, compliance and regulatory spend, which more than offset productivity savings; (6) This left ‘Underlying’ Pre-Provision Profits down 3.6% (h/h); (7) Credit impairment charges fell to just 11bp – the lowest ever recorded.
Oh and NAB this week finally moved to protect their Net Interest Margin, saying it would be changing the special offer on its base variable rate, available for new owner occupier principal and interest customers, from 3.69 per cent to 3.87 per cent. The change, which comes into effect from this Friday, November 9, reduces the discount on the advertised rate from 48 basis points to 30 basis points. It will only affect new customers taking out the product. The announcement comes nearly two months after the fourth-largest lender said it would not join the rest of the Big Four in raising mortgage rates in a bid to “rebuild trust” with customers.
So to property. Home prices are still falling according to the CoreLogic index, with year to date declines on average of 6.12% in Sydney, 4.79% in Melbourne and 3.5% in Perth. Brisbane is up 0.04% and Adelaide up 1.7% making a 5 capital average fall of 5%. In fact, the rate of decline appears to be accelerating.
Macquarie has joined the bearish view of home prices, saying they now expect national dwelling prices to fall for at least another 12 months, with a peak-to-trough correction of around 10 per cent. They expect prices in Sydney and Melbourne to fall by 15-20 per cent. They suggest it is a housing correction rather than being the result of a macro correction, in that falls have so far been orderly, with little evidence of distressed selling, even among investors affected by changes in prudential policy and lending standards. A disorderly housing price correction is unlikely, absent a major global economic downturn. They see declines, even a 20 per cent peak-to-trough decline would merely take prices back to April/May 2015 levels. They see no evidence of a severe credit curtailment, which is interesting. We do not agree.
The number of properties coming on the market continues to skyrocket, as more are forced to sell, or are confronted with the fear of not getting out, as the Sydney listings shows from Domain. There are more than 27,000 listed which seems to be some sort of record, our property Insider Edwin Almeida is tracking the results.
CoreLogic says the weighted average clearance rate saw further softening last week, with only 42.7 per cent of homes successful at auction. There were 1,541 auctions held across the combined capital cities, having decreased from the 2,928 auctions held over the week prior when a higher 47 per cent cleared. Both volumes and clearance rates continue to track lower each week when compared to the same period last year (2,046 auctions, 61.5 per cent).
In Melbourne, final results saw the clearance rate fall last week, with 45.7 per cent of the 266 auctions successful, down from the 48.6 per cent across a significantly higher 1,709 auctions over the week prior.
Across Sydney, the final auction clearance rate came in at 42.6 per cent across a slightly higher volume of auctions week-on-week, with 813 held, up from 798 the previous week when 45.3 per cent cleared. Sydney’s final clearance rate last week was not only the lowest seen this year, but the lowest the city has seen since December 2008.
The only capital city to see more than 50 per cent of auctions successful last week was Adelaide (50.8 per cent), however this was lower than the prior week’s 57.6 per cent. Brisbane saw the lowest clearance rate, with only 30 per cent of homes selling.
Geelong recorded the highest clearance rate of all the non-capital city regions, with 57.1 per cent of auctions reporting as successful, while the Sunshine Coast region had the highest volume of auctions (55).
This week, the number of auctions scheduled to take place across the combined capital cities is expected to rise, with 2,276 currently being tracked by CoreLogic, increasing from the 1,541 auctions held last week, although lower than results from one year ago (2,907). Across Melbourne, auction activity is expected to rise considerably after the slowdown seen preceding the Melbourne Cup festivities last week, with the city set to host 1,074 auctions this week, up from the 266 auctions held last week. In Sydney, 817 homes are scheduled to go to auction this week, increasing slightly from the 813 auctions held last week. Across the smaller auction markets, the number of homes scheduled for auction this week is lower than last week across all cities.
So to the markets, where the ASX 100 fell 0.09% on Friday to 4,874, whilst the ASX 200 Financials rose 0.23% to end at 5,911 and the local fear index rose 1.45% to 14.09.
AMP bumped along the bottom at 2.67, up 2.30 on Friday, ANZ moved up to 27.13, or 0.3%, the Bank of Queensland rose 0.61% to end at 9.92, while Bendigo and Adelaide Bank rose 0.57% to 10.55. CBA rose 0.47% on Friday to 70.95 while Mortgage Insurer Genworth was up 2.2% to 2.32. Macquarie recovered to 123.64 up 0.45%. National Australia Bank slid 0.12% to end the week at 24.90, Suncorp was up 0.64% to 14.08, and Westpac was up 0.07% to 27.70.
The Aussie, which reacted positively to the US mid-terms, ended the week at 72.25, but was down 0.44% on Friday. The Aussie Bitcoin rate was 8,566, down 0.54% and the Aussie Spot Gold fell 0.71% to 1,674.
Across to the US markets. U.S. stocks were lower after the close on Friday, as losses in the Technology, Basic Materials and Industrials sectors led shares lower. At the close in NYSE, the Dow Jones Industrial Average fell 0.77%, while the S&P 500 index fell 0.92% to 2,781, and the NASDAQ Composite index fell 1.65% to 7,407. The CBOE Volatility Index, which measures the implied volatility of S&P 500 options, was up 3.83% to 17.36. Gold Futures for December delivery was down 1.30% or 15.90 to $1210.30 a troy ounce. Elsewhere in commodities trading, Crude oil for delivery in December fell 1.37% or 0.83 to hit $59.84 a barrel. The US has just become the largest oil producer. Generally, a 20% drop from high close to low close defines a bear market. We are entering that territory!
Banks were off, with the S&P500 Financials down 0.93% to 449.49. On the whole, consumer discretionary stocks are slightly outpacing the S&P 500 since early October. The outlier might be Apple, which is actually a tech stock but obviously can have a huge impact on shopping season. The stock has made it back a bit after falling below $200 a share last week, but remains a long way from recent highs of around $230 as investors continue to debate what the company’s holiday quarter guidance and decision to stop reporting iPhone unit sales might mean moving forward. It ended at 204.5, though down 1.93 on the day.
A weakening Chinese economy helped affirm the bearish narrative of slower global growth. The FED kept the cash rate on hold, but the narrative confirms the view that further hikes are likely, with the 3-month bond rate flat at 2.36, and the 10-year rate back a little off its highs, down 1.44% to 3.19. The Fed said it expects “further, gradual increases” in rates as the economy continues to thrive. It’s a bit hard to understand any panic about these words, because they didn’t tell investors anything that most didn’t already know.
The European Commission tangled with Italy over the Italian government’s budget forecasts, which the EC said looked too optimistic on deficits. Moving west, debate raged about whether a Brexit deal might be getting close, and the U.K. government is holding meetings on the issue this weekend, media reports said. A Brexit breakthrough, if it comes, might give European markets a boost. But it’s unclear how close it might be. Deutsche Bank was down 1.75% on Friday to 8.97, and we are watching this as a bellwether for more trouble ahead.
Bitcoin was down 1.45% to 6,415.
So to conclude, the big debt question still remains the elephant in the room, and many are choosing to look past it, though as interest rates continue to push higher in the US, this will be harder to do. Locally, we expect more unnatural acts to try and keep the credit balloon in the air, but we believe that tighter standards are set to lurk in the shadows, meaning that the stage is set for more home price falls ahead.
Finally, a quick reminder, our next live Q&A session is now scheduled for November 20th at 8 pm Sydney time. You can schedule a reminder by using the YouTube Link and join in the live discussion, or send in questions beforehand. If previous sessions are any guide, it should be a lively event!