
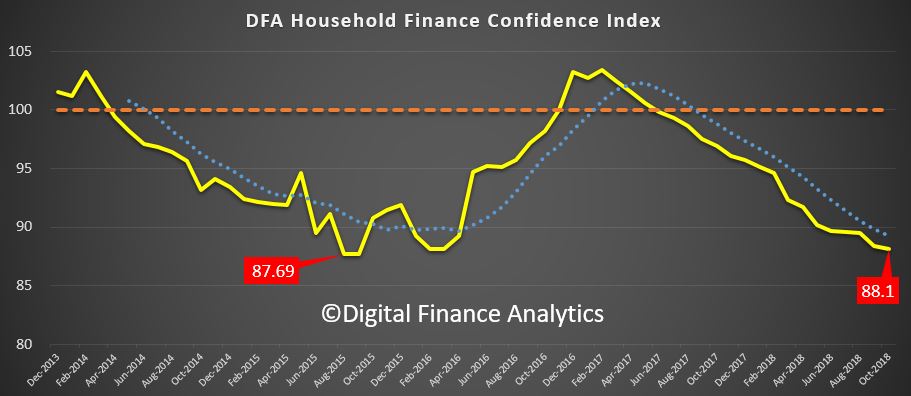
The results from the DFA household surveys to the end of October 2018 are out today. The index measures households overall comfort level with their finances across a number of key dimensions. Recent home price trends, lower returns on deposits and share market gyrations have combined to take the index lower, despite strong employment trends. The wealth effect is now working in reverse, with a potential impact on future consumption.
The index returned a result of 88.1, down from 88.4 last month. This continues the decline since late 2016, and is now approaching the lowest ratings from 2015.
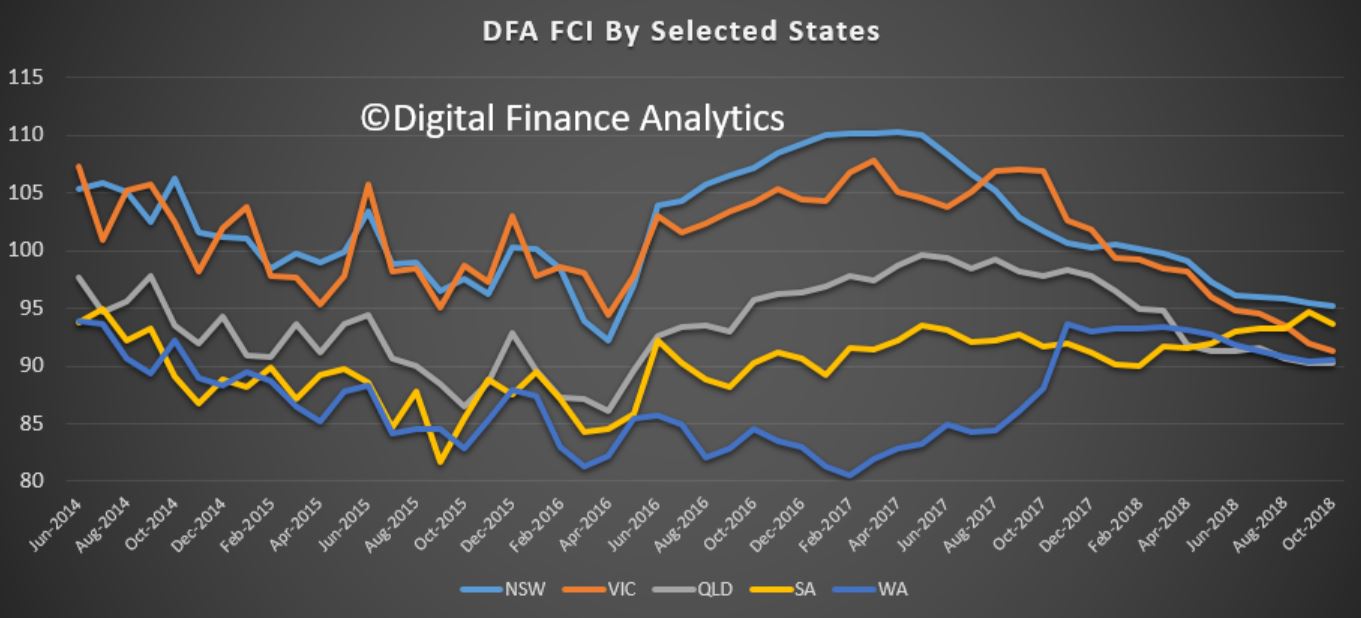
The convergence across the states continue as home price falls in NSW and VIC take a toll, with the southern state showing a significant slide. WA and QLD appear to be tracking quite closely.
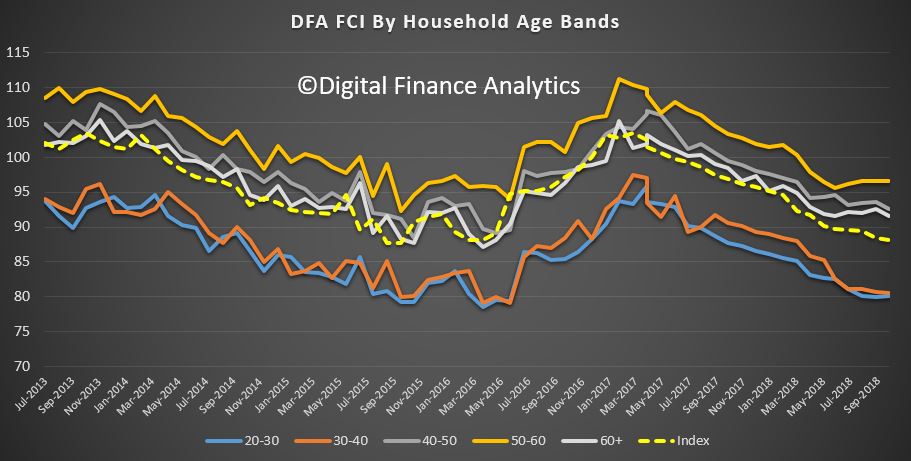
Across the age bands, younger households are under the most pressure (thanks to large mortgages, or renting) while those aged 50-60 years remain the most confident, thanks to lower net borrowing, and more savings and investments. For those aged 40-50 recent falls in property prices swamp any benefit from stock market performance.
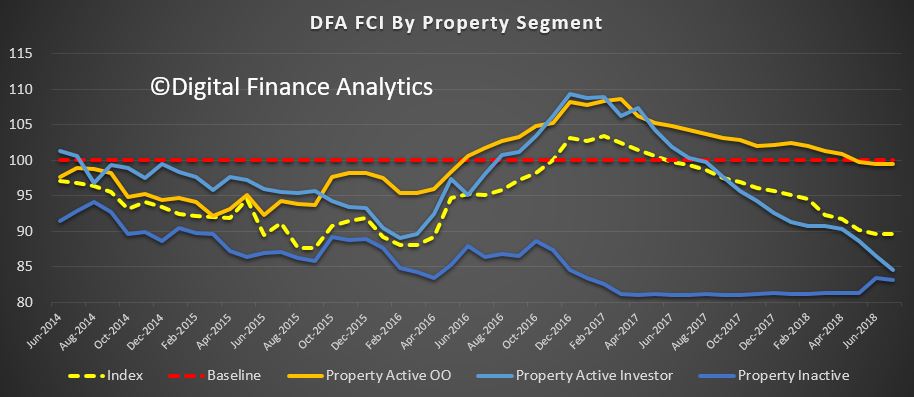
Those holding property for owner occupation remain the most positive, despite falls in paper values of their homes, but property investors are now registering significant concerns, thanks to flat or falling net income from rentals, falling capital values and concerns about the future of negative gearing and capital gains tax relief. More property investors signalled an intention to seek to sell property, as the switch from interest only to principal and interest loans continues. More than 41% of mortgage applications were rejected, compared with 5% last year, as more rigorous underwriting standards bare down. In fact those renting are in many cases more confident than property investors, significant turn around. The great property investor decade in passing.
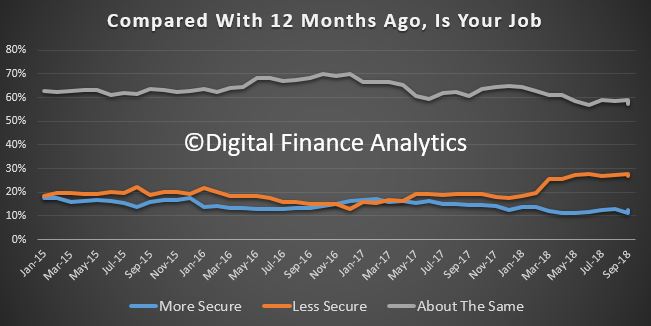
Turning to the moving parts within the index, there was a small fall in those feeling more insecure about their job prospects, down 0.71% to 26.99%. There was a rise of 1.53% in those feeling more secure to 12.68%, and as a result those saying there was no change dropped a little, down 1.91% to 57.14%. We continue to see the spread of more precarious employment, including gig economy jobs, zero hours contracts, and growth in low paid ancillary healthcare jobs. We also saw a significant fall in employment in the finance, construction and real estate sectors, as the property sector eases.
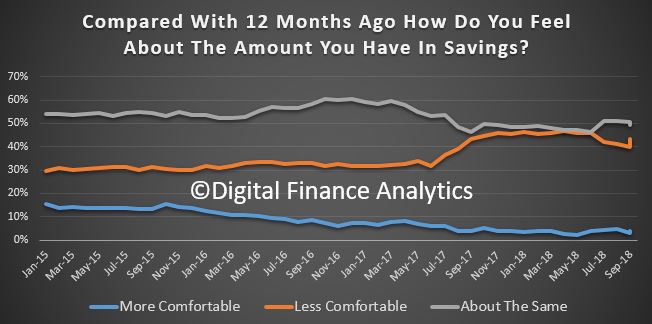
Savings have been hit by recent stock market ructions, plus lower deposit rates on call accounts. As a result, there was a 3.38% rise in those less comfortable with their savings, to 43.39%. 49.28% said there was no change.
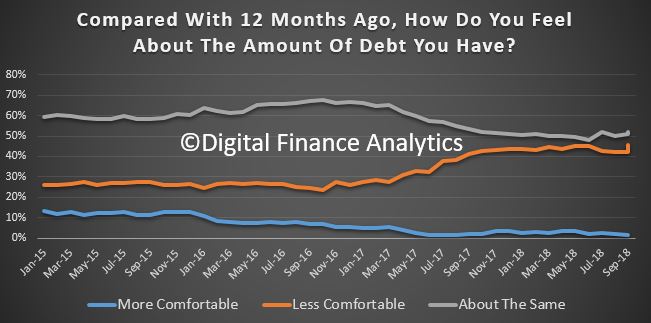
On debt, 45.47% of households were more concerned about their debt holdings, up 3.48%, thanks to some higher interest rates, rejected loan applications, and falling property values eating into equity, so reducing loan to value ratios. That said, those seeing no change stood at 51.87%, so more than half of households do not see any significant change.
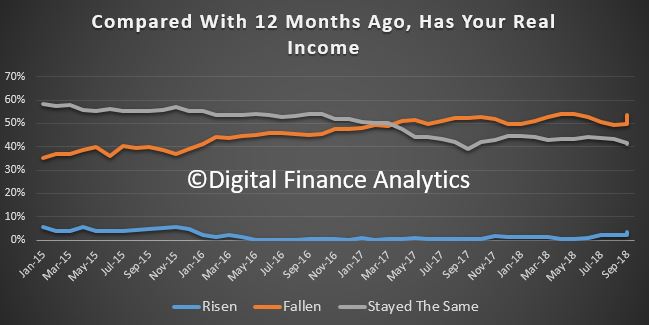
Looking at household cash flow, income growth remains anemic in real terms. Just 3.69% said they had real income growth in the past year, up 1.32%, partly thanks to recent wage awards. However, 53.71% said their incomes had fallen over the same period, up 4.01%, and 41.33% said there was no change. Those in the public sector (especially in Canberra) appear to be fairing the best.
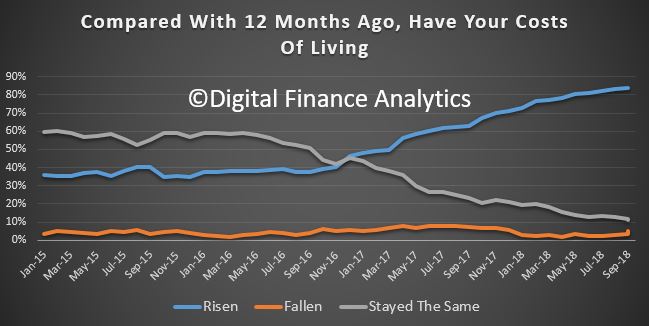
On the costs side of the equation, recent oil price falls have yet to translate into the results, so households said that overwhelmingly their costs of living has risen in the past year – at 83.66%. 4.88% said their costs had fallen, up 1.50% and 11.33% said there was no change. We see find households discussing power bills, fuel, health care costs and child care expenses, but they also highlighted recent rises in some food staples and council charges.
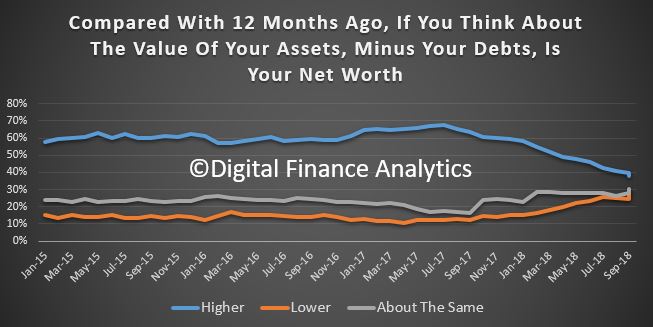
So finally, we can look at net worth (assets minus debts). Around 30% of households reported no change compared with a year ago, but 30.6% reported a net fall, up 5.27% and directly associated with the fall in property values and share values. 37.92% said their net worth was higher, down 1.89% from last month. So the fall in values is now hitting home, and as a result more households are experiencing a negative wealth effect.
This may well be deadly to household consumption (the engine of growth from the RBA’s perspective). This all goes to show that tracking employment growth as a leading indicator of the economy is not telling the whole story.
Slow wages growth, falling home prices and rising costs are combining to drag wealth and household confidence lower, and there is no end in sight. Another reason why we think the RBA will not be lifting the cash rate any time soon.

By way of background, these results are derived from our household surveys, averaged across Australia. We have 52,000 households in our sample at any one time. We include detailed questions covering various aspects of a household’s financial footprint. The index measures how households are feeling about their financial health. To calculate the index we ask questions which cover a number of different dimensions. We start by asking households how confident they are feeling about their job security, whether their real income has risen or fallen in the past year, their view on their costs of living over the same period, whether they have increased their loans and other outstanding debts including credit cards and whether they are saving more than last year. Finally we ask about their overall change in net worth over the past 12 months – by net worth we mean net assets less outstanding debts.
We will update the index next month.