Banking regulator APRA Is “dialling up” the scrutiny on banks’ commercial real estate lending after double-digit loan growth.
Charles Littrell, APRA’s executive general manager for supervisory support said the regulator was turning up the pressure amid fears of an apartment oversupply.
According to a report in The Australian, with estimates of a national oversupply of 70,000 apartments, Littrell said it was “not a bad time to be seeing banks strengthen the equity position in their balance sheet”.
Speaking at a Centre for International Finance and Regulation event yesterday, Littrell said commercial property had historically been what “goes wrong” for the banking system. Plus, there is now the added risk of becoming “so systemically concentrated”.
“In 1990 the four major banks had 40% of the banking market; now they’ve got 80%,” he told the event, The Australian has reported.
“They’re all in the same business model, they’re all hugely exposed to each other … and we don’t quite know what would happen if that business model gets whacked by external stress all at once.
“So there is a lot of conventional work at our end – focusing on sound lending and in fact now we’re dialling up our systemic supervisory focus on commercial real estate.”
Luci Ellis, the Reserve Bank head of financial stability, echoed APRA’s concerns. She told the event that commercial property and development was one area that lacked research since the global financial crisis to draw on.
“The thing that has tended to be the causal agent in a banking crisis, even though you saw something go wrong in housing prices, it was the property developers, it was the commercial real estate, these are the vectors of distress,” she said, according to The Australian.
According to Credit Suisse, total bank commercial real estate lending has boomed in the past three years, with exposures growing 10% to $214bn for the year to March, the highest rate of growth since the GFC.
Category: Economics and Banking
Latest Fed Stress Test Results Are In
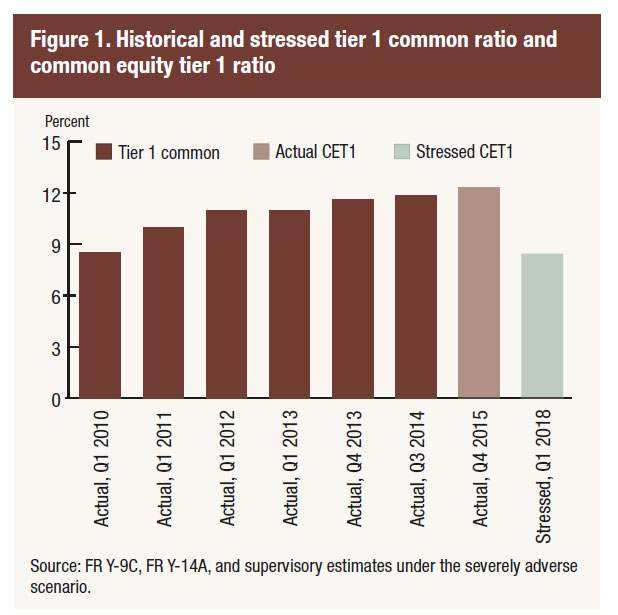
The FED has released the latest stress tests. The most severe hypothetical scenario projects that over the nine quarters of the planning horizon, aggregate losses at the 33 bank holding companies (BHCs) under the severely adverse scenario are projected to be $526 billion. This includes losses across loan portfolios, losses from credit impairment on securities held in the BHCs’ investment portfolios, trading and counterparty credit losses from a global market shock, and other losses. Projected aggregate net revenue before provisions for loan and lease losses (pre-provision net revenue, or PPNR) is $384 billion, and net income before taxes is projected to be –$195 billion. The aggregate Common Equity Tier 1 (CET1) capital ratio would fall from an actual 12.3 percent in the fourth quarter of 2015 to a post-stress level of 8.4 percent in the first quarter of 2018. Since 2009, these firms have added more than $700 billion in common equity capital.
In the adverse scenario, aggregate projected losses, PPNR, and net income before taxes are $324 billion, $475 billion, and $142 billion, respectively. The aggregate CET1 capital ratio under the adverse scenario would fall 173 basis points to its minimum over
the planning horizon of 10.5 percent in the first quarter of 2018.
This is the sixth round of stress tests led by the Federal Reserve since 2009 and the fourth round required by the Dodd-Frank Act. The 33 firms tested represent more than 80 percent of domestic banking assets. The Federal Reserve uses its own independent projections of losses and incomes for each firm.
The “severely adverse” scenario features a severe global recession with the domestic unemployment rate rising five percentage points, accompanied by a heightened period of financial stress, and negative yields for short-term U.S. Treasury securities.
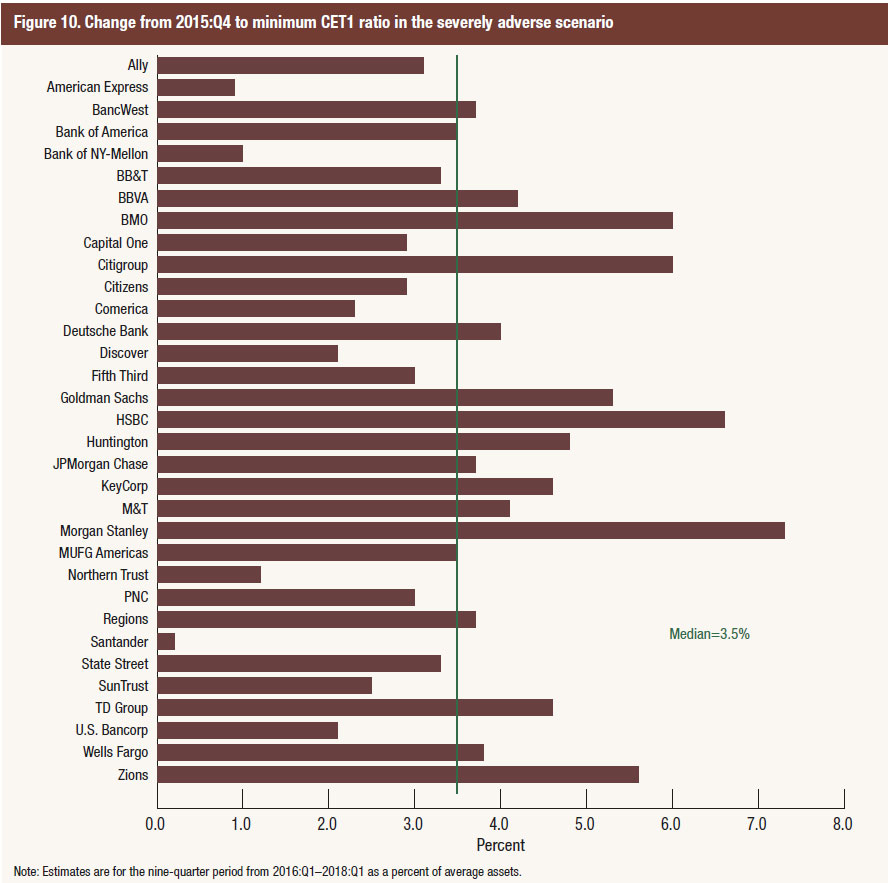
Results are provided for each individual bank. For example, the changes to CET1 ratio would vary considerably. This is much more transparent disclosure than the APRA Australian results which were aggregated and less detailed.
In addition to releasing results under the severely adverse hypothetical scenario, the Board on Thursday also released results from the “adverse” scenario, which features a moderate recession and mild deflation in the United States. In this scenario, the aggregate common equity capital ratio of the 33 firms fell from an actual 12.3 percent in the fourth quarter of 2015 to a minimum level of 10.5 percent.
The nation’s largest bank holding companies continue to build their capital levels and improve their credit quality, strengthening their ability to lend to households and businesses during a severe recession
The Board’s stress scenario estimates use deliberately stringent and conservative assessments under hypothetical economic and financial market conditions. The results are not forecasts or expected outcomes.
The Dodd-Frank Act stress tests are one component of the Federal Reserve’s analysis during the Comprehensive Capital Analysis and Review (CCAR), which is an annual exercise to evaluate the capital planning processes and capital adequacy of large bank holding companies. CCAR results will be released on Wednesday, June 29. The Federal Reserve annually assesses whether BHCs with $50 billion or more in total consolidated assets have effective capital planning processes and sufficient capital to absorb losses during stressful conditions while meeting obligations to creditors and counterparties and continuing to serve as credit intermediaries.
ASIC commences proceedings against Macquarie Investment Management
ASIC has announced it has commenced proceedings in the Supreme Court of New South Wales against Macquarie Investment Management Ltd (MIML) as the responsible entity of the van Eyk Blueprint International Shares Fund (VBI Fund). The proceedings involve investments of $30 million made by the VBI Fund in 2012 into a Cayman Islands based fund, known as Artefact Partners Global Opportunities Fund (Artefact). The VBI Fund was one of the Blueprint series of funds of which van Eyk Research Pty Limited (now in liquidation) was investment manager, and MIML was responsible entity.
MIML has admitted to five contraventions of the Corporations Act and the parties have filed an Agreed Statement of Facts.
ASIC and MIML have agreed that MIML failed to comply with its duties as a responsible entity by:
- failing to adequately address risks associated with the decision for the VBI Fund to make 3 investments into Artefact between 6 July to 30 October 2012;
- allowing members to redeem or withdraw units from the VBI Fund when it was illiquid in contravention of the Corporations Act and the scheme’s constitution between 15 June 2013 to 9 September 2013; and
- failing to make adequate and timely enquiries in relation to van Eyk’s monitoring of the VBI Fund’s investment in Artefact between 18 February 2013 and 21 July 2014 (including not making adequate and timely enquiries as to why a full redemption from Artefact had not been paid between 1 January 2014 to 21 July 2014).
The Court will hear joint submissions from ASIC and MIML as to the appropriate penalty amounts. The final penalty amount is a matter that will be determined by the Court.
On 1 August 2014, MIML suspended redemptions from the VBI Fund and three other funds due to their exposure to the VBI Fund. Between them these funds managed over $450 million.
On 15 August 2014, MIML terminated the VBI Fund, with unitholders owed around $30.9m relating to the Artefact investments. Since then, Artefact has repaid $20m to the VBI Fund. MIML recently paid the remaining approximately $10.9 million plus interest to unit holders (less fees and winding up costs) and expects to recover the majority of that amount from Artefact’s liquidator. ASIC acknowledges the efforts made by MIML to have the investors’ funds repaid.
ASIC has an ongoing investigation into van Eyk Research Pty Ltd, the entity MIML appointed as the investment manager of the VBI Fund. Van Eyk Research Pty Ltd went into liquidation in 2014.
Commissioner Greg Tanzer said, ‘The Corporations Act places important obligations on responsible entities which protect the interests of investors. Those obligations require responsible entities to have a supervisory and monitoring role in relation to funds, even where external investment managers have been appointed. ASIC will take action against responsible entities when they fail to meet their obligations.’
The proceedings will be listed for directions on Monday 27 June 2016 and the parties will request an early hearing date from the Court.
WA Mortgage Borrowers Struggling Most
The number of home loans in arrears continued to rise during the first quarter of 2016, with Western Australia topping the list. According to the Standard and Poor’s (S&P) Performance Index, the percentage of prime mortgages more than 30 days in arrears increased to 1.13 per cent in the March quarter, up by more than 7 per cent from the same period a year ago.
“At 1.13 per cent, however, the percentage of mortgages in arrears is relatively low and remains well below the historical peak of 1.69 per cent in 2012,” S&P said.
Loan arrears increased in every state and territory during the quarter, with WA recording the highest percentage at 1.77 per cent, followed by Tasmania (1.51 per cent) and Queensland (1.42 per cent). S&P noted the high arrears levels partly reflect the tougher economic conditions that these states face.
“Queensland and Tasmania have seen rises in unemployment, and Western Australia is dealing with the ongoing effects of a slowdown in mining investment,” the credit ratings agency said. “New South Wales and the Australian Capital Territory continued to have the nation’s lowest levels of mortgage stress in Q1, with both below 1 per cent.”
Australian Household Credit Card Debt Profiling
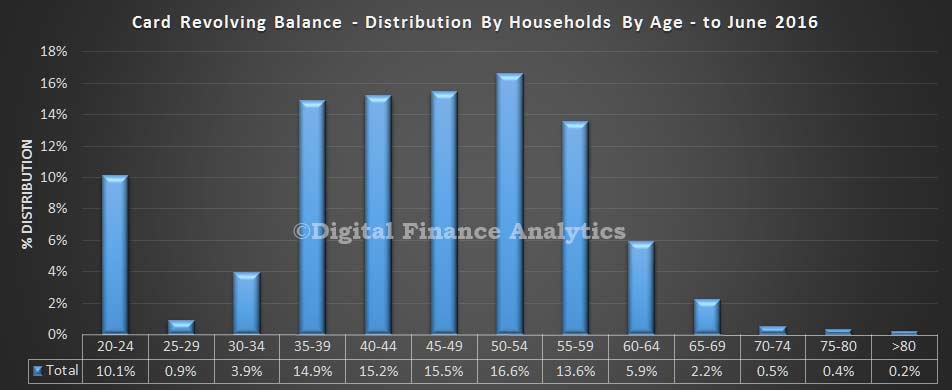
Following the US card data analysis we reported this morning, we have been looking at the situation among Australian households by using data from our household surveys. We extracted the average revolving balance data from our surveys, and mapped this first to household age bands. We find that the largest proportion of debt are found in households aged 50-54, and more generally, older households have more debt, similar to the US findings. The spike in the 20-24 age bands is explained by young households yet to own a property, and often living with parents, or in shared accommodation, with larger spending appetites.
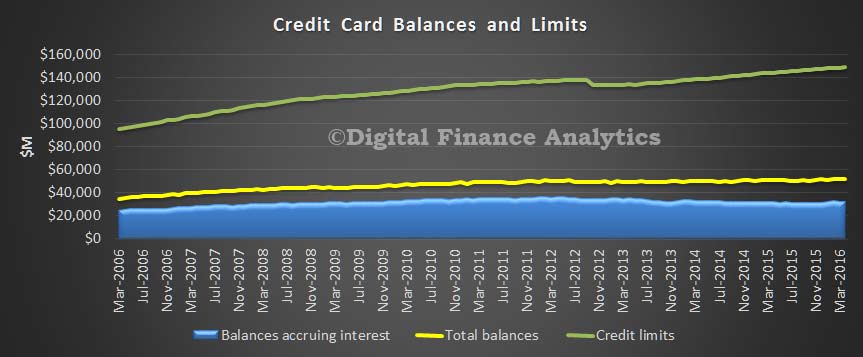
Data from the RBA also shows that nationally, whilst credit limits have steadily increased, the total balances accruing interest have not.
We also looked at households by our master segments, and found that most debt sits with our suburban households. These are relatively stable households, but not the most affluent. Stressed households, relatively, hold lower debt balances.
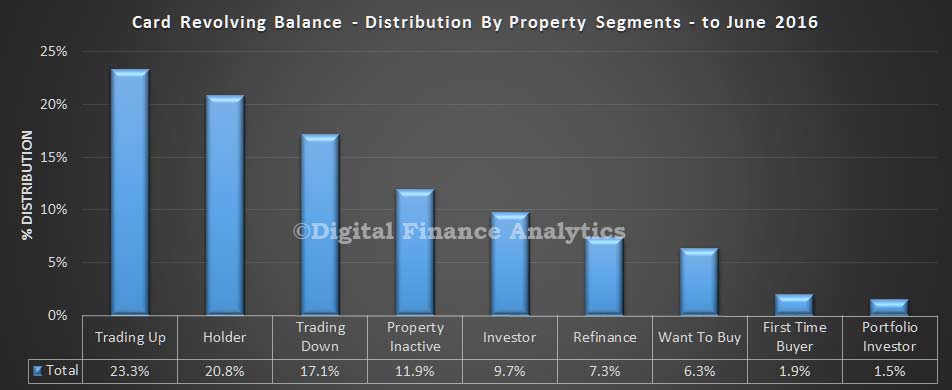
This is confirmed by looking at households by our property segmentation. The highest debt distribution is found in households looking to trade up, hold property, or trade down. These groups have significant assets behind them. Other groups, including first time buyers have lower debt balances.
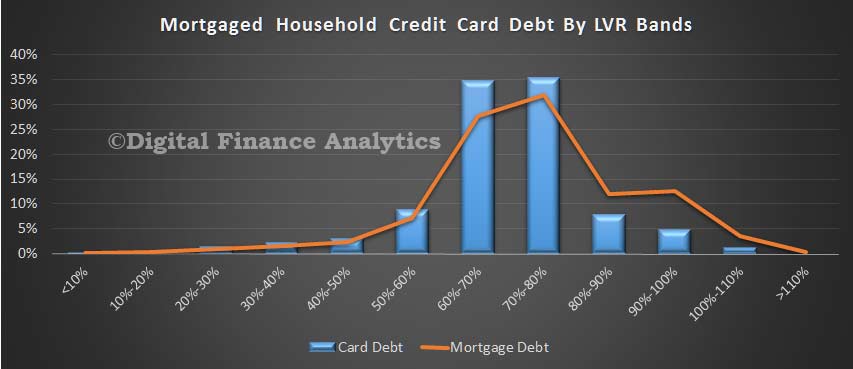
In our final piece of analysis, we looked are credit card debt distribution by the loan to value of those with mortgages. We found the largest debt levels reside in LVR bands between 60-80%, where the same is true of mortgage balances. So, we can see a correlation between LVR bands and credit card revolving debt.
So, overall we conclude that older households, especially with a mortgage hold the highest card balances, and that card lending is intrinsically connected with home lending.
The Problem With Reference Benchmark Rates
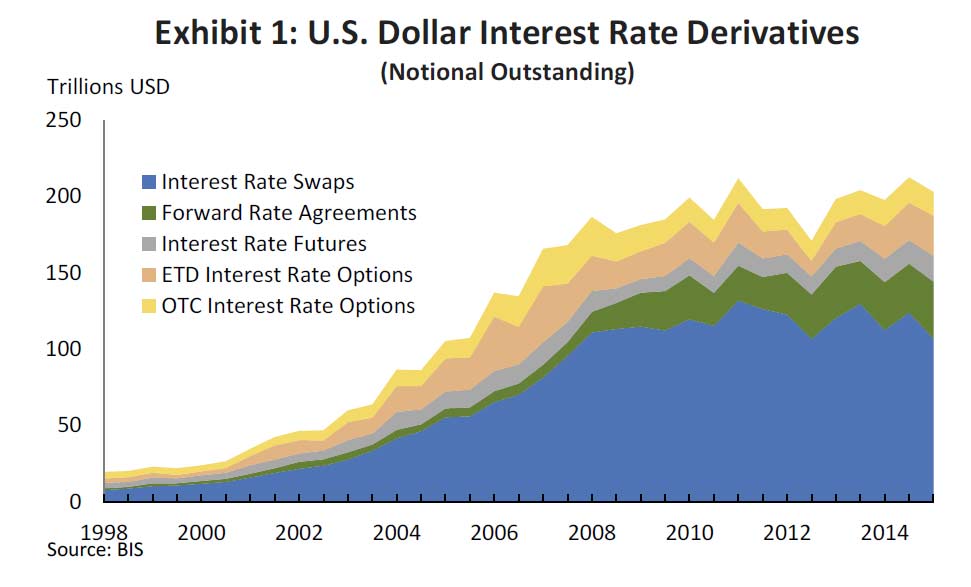
A host of factors have put critical financial market benchmark rates such as LIBOR or BBSW under the spotlight. Can we trust them? It has been suggested that some banks have been rate rigging – for example in Australia, ASIC has commenced proceedings against some of our largest banks and there is debate about an alternative and more robust benchmark. So, an interesting speech by FED Governor Jerome H. Powell at the Roundtable on the Interim Report of the Alternative Reference Rates Committee sponsored by the Federal Reserve Board and the Federal Reserve Bank of New York looking at LIBOR is highly relevant. They just issued an interim report which shows that US Dollar Interest Rate Derivatives account for about US$200 trillion, with more than half in interest rate swaps, so small tweaks to the benchmark rate can yield big profits to the industry.
I want to thank the Alternative Reference Rates Committee (ARRC) for all its work in developing its interim report. This report marks a new stage in reference rate reform.1 Reference benchmarks are a key part of the financial infrastructure. About $300 trillion dollars in contracts reference LIBOR alone. But benchmarks were not given much consideration prior to the recent scandals involving attempts to manipulate them. Since then, the official sector has thought seriously about financial benchmarks, conducting a number of investigations into charges of manipulation, publishing the International Organization of Securities Commission’s (IOSCO) Principles for Financial Benchmarks and, through the Financial Stability Board (FSB), sponsoring major reform efforts of both interest rate and foreign exchange benchmarks.2 The institutions represented on the ARRC have also had to think seriously about these issues as they have developed this interim report. Now, we need end users to begin to think more seriously about how they use benchmarks and the risks they are taking on by relying so heavily on a reference rate–in this case U.S. dollar LIBOR–that is less resilient than it needs to be.
In saying this, I want to make it clear that LIBOR has been significantly improved. ICE Benchmark Administration is in the process of making important changes to its methodology, and submissions to LIBOR are now regulated by the United Kingdom’s Financial Conduct Authority. However, the term money market borrowing by banks that underlies U.S. dollar LIBOR has experienced a secular decline. As a result, the majority of U.S. dollar LIBOR submissions must still rely on expert judgement, and even those submissions that are transaction-based may be based on relatively few actual trades. This calls into question whether LIBOR can ultimately satisfy IOSCO Principle 7 regarding data sufficiency, which requires that a benchmark be based on an active market. That Principle is a particularly important one, as it is difficult to ask banks to submit rates at which they believe they could borrow on a daily basis if they do not actually borrow very often.
That basic fact poses the risk that LIBOR could eventually be forced to stop publication entirely. Ongoing regulatory reforms and changing market structures raise questions about whether the transactions underlying LIBOR will become even scarcer in the future, particularly in periods of stress, and banks might feel little incentive to contribute to U.S. dollar LIBOR panels if transactions become less frequent. Market participants are not used to thinking about this possibility, but benchmarks sometimes come to a halt. The sudden cessation of a benchmark as heavily used as LIBOR would present significant systemic risks. It could entail substantial losses and would create substantial uncertainty, potential legal challenges, and payments disruptions for the market participants that have relied on LIBOR. These disruptions would be even greater if there were no viable alternative to U.S. dollar LIBOR that market participants could quickly move to.
These concerns led the FSB and Financial Stability Oversight Council to call for the promotion of alternatives to LIBOR, and led the Federal Reserve to convene the ARRC in cooperation with the U.S. Treasury Department, U.S. Commodity Futures Trading Commission, and Office of Financial Research. LIBOR is currently the dominant reference rate in the market because of its liquidity. We are not under any illusions that moving a significant portion of trading to an alternative rate will be simple or easy. But I believe the ARRC has provided a workable and credible plan for creating liquidity in a new rate and beginning the process of moving trading to it.
We need input from end users and others to finalize the ARRC’s plans, and I look forward to hearing the views of those in attendance. Successful implementation will require a coordinated effort from a broad set of market participants. This effort will certainly entail costs, but continued reliance on U.S. dollar LIBOR on the current scale could entail much higher costs if unsecured short-term borrowing declines further and submitting banks choose to leave the LIBOR panels, especially if there were no viable alternative rate. Simply put, this effort is something that needs to happen, and if the ARRC members, the official sector, and end users and other market participants all jointly coordinate in finalizing these plans, then a successful transition can be made with the least disruption to the market, leaving everyone in a better place.
1. See Alternative Reference Rates Committee (2016), Interim Report and Consultation (PDF) (New York: ARRC, May).
2. For more information on the IOSCO principles, see Board of the International Organization of Securities Commissions (2013), Principles for Financial Benchmarks: Final Report (PDF) (Madrid: IOSCO, July).
The Euro Zone’s Inflation Problem
Dr Jens Weidmann, President of the Deutsche Bundesbank, highlighted the low inflation expectations within the Euro Zone, predicting no more than a gradual increase in inflation to 1.6 % this year, with 1.7 % growth assumed for each of the coming two years.
The global economy is on a moderate growth path. Though its momentum is weaker now than we had expected a little over half a year ago, the fears that prevailed in the financial markets every now and then did not materialise. However, right now we are seeing a shift in the dynamics of growth. In the emerging markets, where the situation had clouded over perceptibly at the beginning of the year, the situation is stabilising to a degree. The recessionary tendencies plaguing Russia have died down, although a sustainable recovery is not yet in sight. In China, growth prospects repeatedly required downward revisions in the past. The shift in growth seen thus far, though, is consistent with China’s transition to a more services-oriented, domestically driven economic model; if we look at it that way, we have no cause for anxiety.
And those countries which derive a large proportion of their value added from commodity exports are likely to benefit from the latest recovery of commodity prices, especially the significant increase in oil prices. By contrast, the United States and United Kingdom recently saw a slight deceleration of growth, with US growth being curbed by the oil industry delaying investment, amongst other factors. Private consumption was also on the weak side in both countries.
On the other hand, the euro area got off to a good start in 2016. Gross domestic product grew by a healthy 0.6 % on the quarter. Lively domestic demand, which benefited from low oil prices and the accommodative monetary policy, was a pillar of the upturn. However, another decisive factor was the surprisingly mild weather at the start of the year, which boosted, above all, the construction sector. The strong first-quarter growth should therefore not be extrapolated to the year as a whole.
On aggregate, the euro-area economy’s growth path is still only tepid at present. The latest Eurosystem staff projection has the euro-area economy growing by 1.6 % this year, with 1.7 % growth assumed for each of the coming two years.
Economic growth in Germany is looking relatively similar, even though the situation – seen, for instance, in terms of capacity utilisation and labour market indicators – is significantly better than in the rest of the euro area. Our country did, after all, post respectable first-quarter growth of 0.7 %. However, even in Germany, aggregate economic growth will peter out somewhat as the year progresses. Bundesbank economists are expecting growth of 1.7 % this year. Owing to the difficult external environment, growth is projected to decelerate temporarily to 1.4 % for 2017 before then climbing back up to 1.6 % in 2018.
Monetary policy
For us as central bankers, macroeconomic analysis is, of course, not an end in itself. After all, our mandate is not to steer the economy but instead to maintain price stability. Economic growth, however, is one determinant of enterprises’ capacity utilisation and their scope for raising prices. It also indicates how much leeway wage bargainers have in wage negotiations.
Inflation rates have been very low for some time now in many currency areas, and the euro area is no exception. Here, inflation is even in negative territory; in May, prices were down by 0.1 % on the year. In the past two years, it was mainly the sharp fall in commodity prices, particularly oil prices, which pushed inflation down. However, the impact of a change in oil prices will automatically be washed out of the inflation rate over time. And the recent rise in oil prices is helping to speed up this process somewhat.
However, the low inflation rates in the euro area are not just an outcome of the fall in oil prices. Core inflation, i.e. the price index adjusted to exclude energy and food prices, is likewise relatively low. The muted domestic price pressures measured in this manner also show that some euro-area economies are recovering only gradually and that unemployment levels in those countries are still very high.
Seeing as the euro-area economic recovery is only tepid, the Eurosystem projections foresee no more than a gradual increase in inflation to 1.3 % next year and 1.6 % in 2018.
In view of this muted price outlook, an accommodative monetary policy is appropriate at present, though reasonable people can disagree about the specific design of the non-standard measures. There is one thing I would like to stress, though: Our definition of price stability requires the target inflation rate to be achieved over the medium term. This will give us enough time to see how the adopted monetary policy measures will impact on price movements, especially since, as I have been pointing out time and again, the Eurosystem is still something of a novice when it comes to applying non-standard monetary policy, and the risks and side-effects of the ultra-accommodative monetary policy are growing over time.
McKinsey’s Asia–Pacific Banking Review 2016
McKinsey has just released its latest banking annual report “Weathering the storm” which finds an industry facing challenges to maintain its growth, but significant opportunities remain.
Over the past decade, the Asia–Pacific region has propelled global banking. Of the industry’s $1.1 trillion global profits in 2015, some 46 percent came from the region, up from just 28 percent in 2005. The bulk of this increase was the result of growth linked to dynamic economies throughout Asia–Pacific, especially China, which accounted for about half of the region’s banking-revenue pool in 2015.
Yet our annual report, Weathering the storm: Asia–Pacific Banking Review 2016, finds that the momentum from this golden decade is already fading. Margins and returns on equity are shrinking—for instance, the Asia–Pacific banking industry’s ROE slipped to 14 percent in 2014, from 15 percent a year earlier. The region and its financial industry seem to be settling into a new era of slower growth and greater challenges in generating economic profit.
They say slowing macroeconomic growth, disruptive attackers from outside the financial-services sector and weakening balance sheets may come together in a powerful storm that could cripple ROEs by 2018. Indeed, banks already see the impact of the changing environment. Their analysis of 328 banks in the region showed that while 39 percent posted an economic profit in the period from 2003 to 2006, only 28 percent did so from 2011 to 2014.
They conclude that although the coming storm is a potent and clear threat to most banks in the Asia–Pacific region, it may also provide the kind of significant industry disruption that creates opportunities for those that recognize it. The most aggressive banks will not merely survive the turbulence but also be strengthened by it.
Income, Credit and Home Prices Out of Kilter
In this post we combine the latest data from the RBA and ABS, and our own analysis to look at the relationship, at a state level, between income growth, home price growth and credit growth. These three elements should logically be closely meshed, yet in the current environment, they are not. We think this is an important leading indicator of trouble ahead as these three factors will come back eventually to a more normal relationship, signalling potential falls in home values and credit volumes in a low income growth environment.
The latest data from the ABS shows that home prices fell slightly in the past quarter. The Residential Property Price Index (RPPI) fell 0.2 per cent in the March quarter 2016, the first fall since the September quarter 2012. Attached dwellings, such as apartments, largely drove price falls in the RPPI. The attached dwellings price index fell 0.8 per cent in the March quarter 2016. Falls were recorded in Melbourne (-1.3 per cent), Sydney (-0.6 per cent), Perth (-1.1 per cent), Canberra (-1.1 per cent) and Adelaide (-0.4 per cent). Brisbane (+0.7 per cent), Hobart (+2.3 per cent) and Darwin (+0.1 per cent) recorded rises. Established house prices for the eight capital cities was flat (0.0 per cent). The total value of Australia’s 9.7 million residential dwellings increased $15.4 billion to $5.9 trillion. The mean price of dwellings in Australia is now $613,900.
The RBA minutes also out today had a couple of interesting comments.
Dwelling investment had continued to grow strongly over the year, consistent with the substantial amount of work in the pipeline noted in previous meetings. Members observed that private residential building approvals had increased strongly in April, to be close to peaks seen earlier in 2015. Although these data are quite volatile from month to month, the trend for building approvals had been stronger than expected of late and the pipeline of residential work yet to be done had remained at high levels. This implied that growth in new dwelling investment would continue to add to the supply of housing over the next year or so, particularly in the eastern capitals.
In established housing markets, prices increased significantly in Sydney and Melbourne over April and May and, to a lesser extent, in a number of other capital cities. Auction clearance rates and the number of auctions increased in May, but remained lower than a year earlier. At the same time, the monthly data available for April showed that there had been a further easing in housing credit growth and the total value of housing loan approvals, excluding refinancing, had fallen in the month. Members noted that the divergence in the trends in housing price and credit growth was not expected to persist over a long period of time.
We already know that income growth is static.
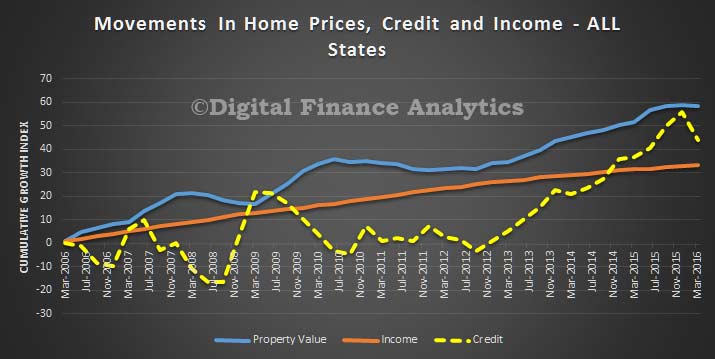
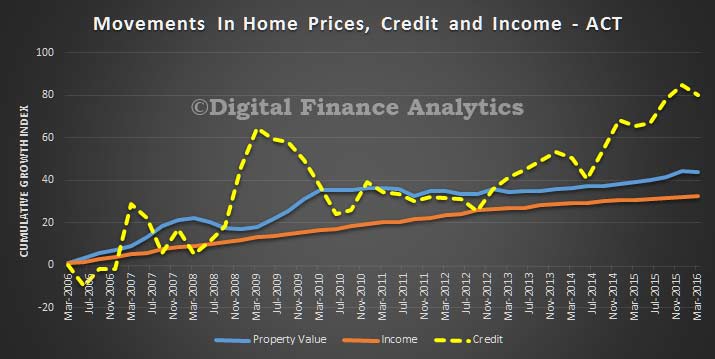
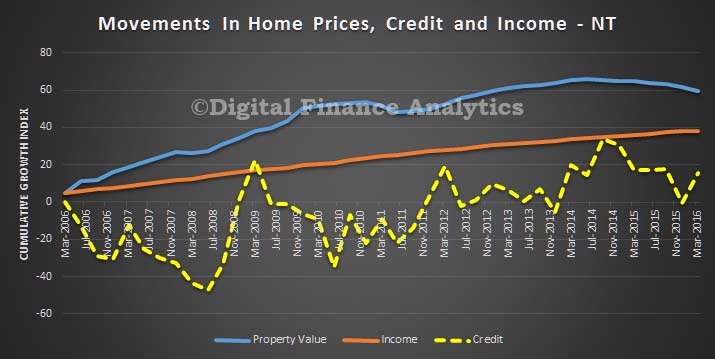
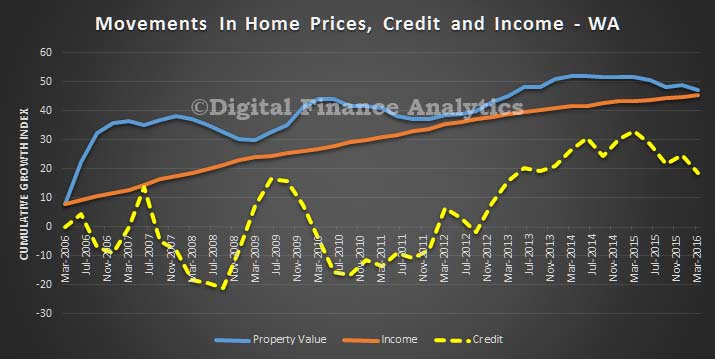
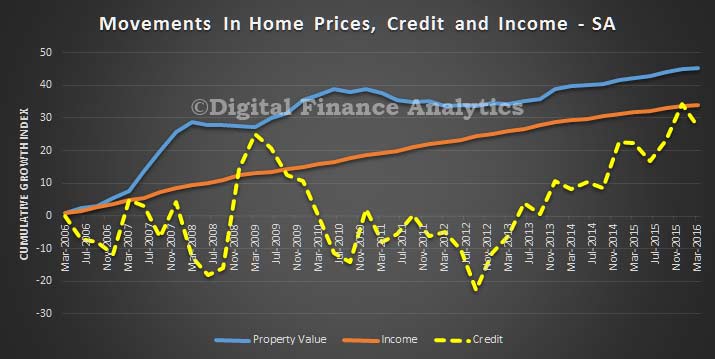
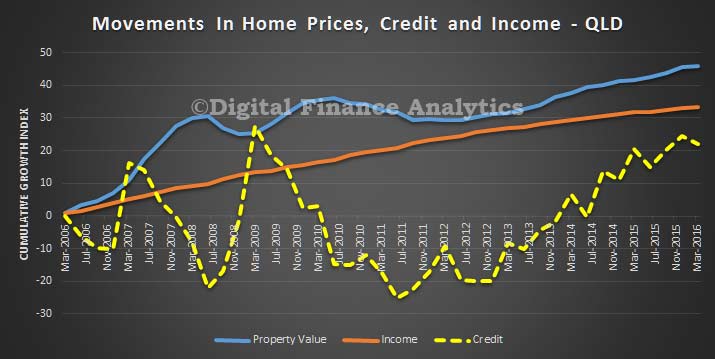
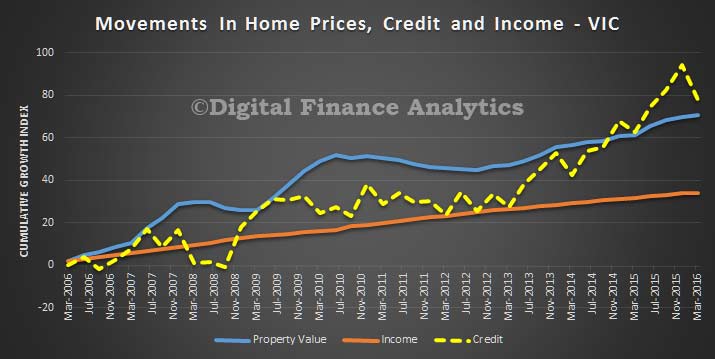
So this got us thinking about the relationship between income, home price growth and credit growth. To look at this, we drew data from our surveys, and also the ABS and RBA data-sets, to map the relative cumulative growth of average household income, home price growth and credit growth. The results are interesting. We used 2006 as a baseline and measured the relative cumulative growth since then, by state.
First, here is the average across Australia. The growth of credit since 2006 (the yellow line) is significantly stronger than home prices and income. Income is notably the slowest. This is course confirms what we know, households are more leveraged (highest in the western world), and home prices are higher relative to income, supported by credit availability and more recently low interest rates. Note also the recent slowing in credit growth.
Looking at the state variations is really insightful. In the ACT credit growth is very strong, but home prices and incomes are moving at a similar trajectory. This is partly because of the micro-economic climate supported by well paid public servants.
In NT, home price growth is higher than credit and income growth, but the growth is beginning to slow, in response to the mining slow down. Home prices are significantly extended relative to incomes.
In TAS, home prices are tracking incomes, whilst credit has been growing more slowly, thanks to lower price growth and local demographics.
In WA, we see significant home price momentum through the mining boom years, but it is now adjusting, and credit which has been strong has been easing in the past 12 months. Home price growth is now tracking income growth.
In SA, credit is quite strong now, and we are seeing home prices moving ahead of incomes, as they did in 2010, but only slightly.
In QLD, credit is growing faster now, and home prices are moving faster than incomes, there is an interesting dip in 2011-12, thanks to some “local political difficulties!”
VIC holds the award for the strongest credit growth in recent time, and as a result we see home prices moving ahead of income growth, a trend which can be traced back to before the GFC.
Finally, in NSW, we see a dramatic run up in credit and home prices, especially since 2013. Both are growing faster than incomes. Prior to this, income growth and home prices were more aligned.
So a few observations. Incomes and home prices, and credit are disconnected, significantly. This is a problem because credit has to be repaid from income, in some way, at some time. Next, there are strong correlations in some states between credit growth and home prices, in other states it is less clear. NSW and VIC have the largest gaps between income and prices. So it reconfirms the property markets are not uniform. Finally, and importantly, we think that home price and credit growth will have to come back to income growth – and as incomes will be static for some time, downward pressure on home prices and credit will build, especially if the costs of borrowing were to rise.
The Changing Face of the Non-Bank Sector
The prospective sale of Firstmac underscores the dilemma for Non-Banks operating in the current environment. Pre-GFC, most were able to work a very effective Residential Mortgage Backed Securitisation (RMBS) model where bundles of loans were packaged up and sold to investors, many of whom were offshore. Then the GFC hit. As a result the securisation markets froze and funding all but stopped. It has hardly recovered.
In this chart we compared the assets of securitised pools with the total mortgage loan growth in Australia, and it starkly shows the changes post the GFC. We used data from RBA and ABS to generate the data. As a result, the share of mortgages written by banks have lifted from 70% to well above 90%. Banks also have looked at other funding routes, (for example Bendigo Bank have moved from 20% to 6% RMBS, and this has created a capital headwind, so they will most likely focus on senior funding), because costs of securitising is still higher than before the GFC, when the Non-Banks had a significant funding advantage. Banks also are now subject to tighter capital rules for securitised pools.
Here is the latest data on issuance from Macquarie.
In addition, most deals which are done are in Australia, as the global demand for securitised paper is still well down as shown by this chart. Most deals now done to institutional investors in Australia, in long term instruments. We also see a rise in direct placements.
So, Non-Banks need alternative models to make their business work. Those who survive do so on the back of funding from investors, (which include some of the major banks, as well as retail super funds and sophisticated individuals). They also find it hard to compete in the current low interest rate environment making “meat and potato” loans, because the margins are compressed. As a result they will be looking for niche markets, such a low documentation loans, jumbo loans, investment loans, and credit impaired loans. Here they have an advantage as they are not under the APRA 10% speed limit for investment loans, and do not have to hold capital against these loans under the Basel III arrangements. They are merely answerable to ASIC.
So we expect Non-Banks to operate in niche markets, funding their business from investors. We also expect to see more sales and consolidation.