Real Estate Investment In Australia From China Doubled Last Year – FIRB

China foreign investment in real estate in Australia doubled that last year, according to the Foreign Investment Review Board (FIRB) in their annual report for the year 2014-2015. Total foreign investment approvals across all categories were worth $194.6 billion. No applications were rejected last year, though some were approved only with conditions.

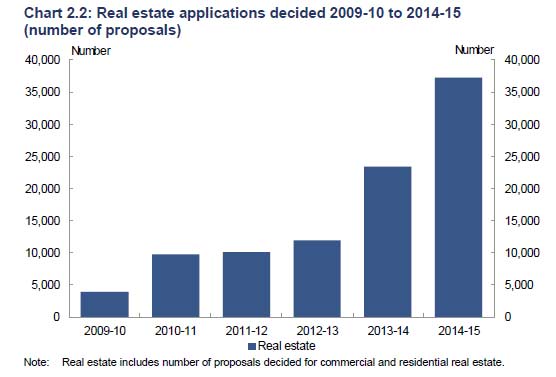
Looking at the real estate sector, we see significant growth in applications compared with previous years.

FIRB-2014-1Approved investment in real estate (comprising commercial and residential proposals) was $96.9 billion in 2014-15 (compared with $74.6 billion in 2013-14). Residential approvals rose from $34.7 billion in 2013-14 to $60.75, of which $49.25 billion were for development.

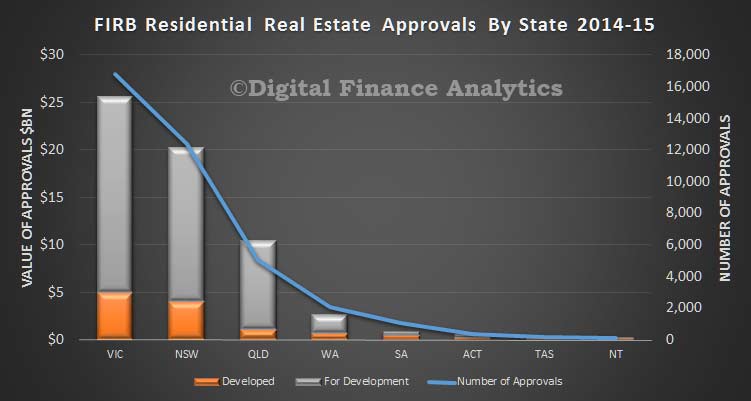
Looking at the state analysis, VIC leads the way in terms of the number and value of approvals. For example VIC had $20.6 billion of developments for approval, compared with $16.24 billion in NSW.

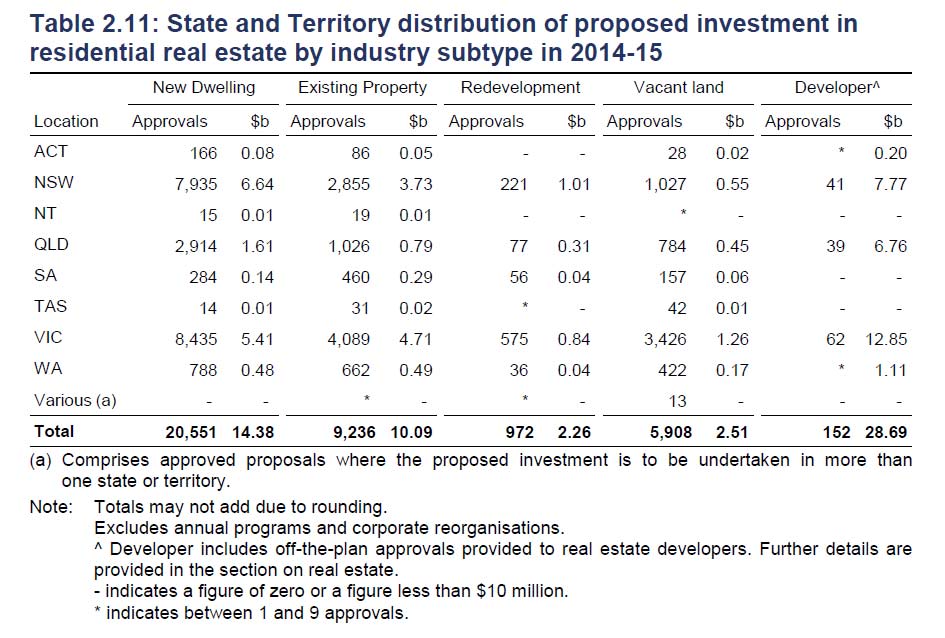
FIRB-2014-2The FIRB report includes a state analysis by type of development

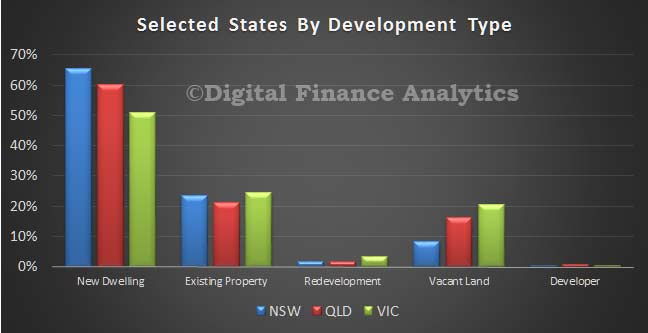
FIRB-2014-3Our analysis shows the largest proportion of new dwelling approvals in NSW, compared with VIC and QLD. On the other hand, VIC had the highest proportion of existing property and vacant land approvals.

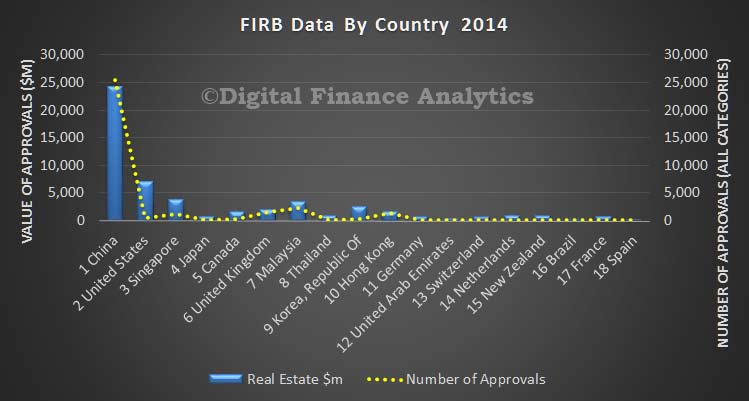
FIRB-2014-4The Country data provided by the FIRB report does not separate residential real estate from commercial property. That said, the data shows China as the largest investor, based on number of approvals and value. In the previous year, China originated 14,716 approvals, compared with 25,431 in 2014-15 overall, whilst real estate was worth $12.4 billion in 2013-14 compared with $24.3 billion in 2014-15.

FIRB-2014-5


Basel III Progress Assessment Published

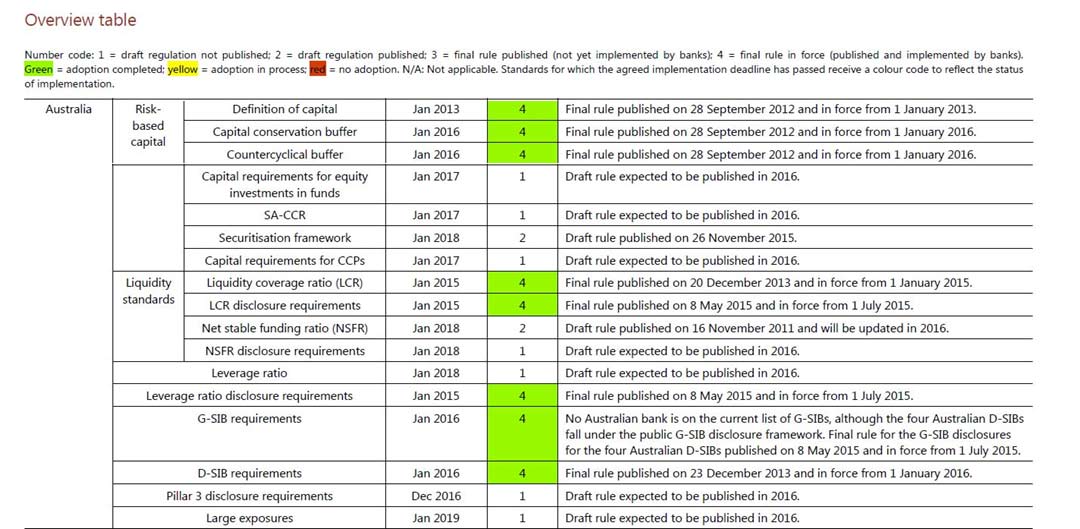
The Bank for International Settlements (BIS) has released the 10th status report on the adoption of the Basel regulatory framework. We summarise the elements within Basel III and their target dates, and the status of Basel III in Australia. The complexity of the overall approach is highlighted. It also shows the journey to Basel III is far from complete. Today the IMF Working Paper highlighted the deficiency in the approach in connection with mortgage finance.  We are not convinced more complexity is necessarily better.

As of March 2016, all 27 member jurisdictions have final risk-based capital rules, LCR regulations and capital conservation buffers in force, 24 have issued final rules for the countercyclical capital buffers and 23 have issued final or draft rules for their domestic SIBs framework. With regard to the global SIBs framework, all members that are home jurisdictions to G-SIBs have the final framework in force. Members are now turning to the implementation of other Basel III standards, including the leverage ratio and the net stable funding ratio (NSFR).

Regarding the consistency of regulatory implementation, the Committee has published its assessment reports on 24 members – Australia, Brazil, Canada, China, nine members of the European Union, Hong Kong SAR, India, Japan, Saudi Arabia, Mexico, Russia, Singapore, South Africa, Switzerland, Turkey and the United States – regarding their implementation of Basel risk-based capital regulations.

The Basel III framework builds on and enhances the regulatory framework set out under Basel II and Basel 2.5.

Basel III Capital: In December 2010, the Committee released Basel III, which set higher levels for capital requirements and introduced a new global liquidity framework. Committee members agreed to implement Basel III from 1 January 2013, subject to transitional and phase-in arrangements.

  • Capital conservation buffer: The capital conservation buffer is phased in between 1 January 2016 and year-end 2018, becoming fully effective on 1 January 2019.
  • Countercyclical buffer: The countercyclical buffer is phased in parallel to the capital conservation buffer between 1 January 2016 and year-end 2018, becoming fully effective on 1 January 2019.
  • Capital requirements for equity investment in funds: In December 2013, the Committee issued the final standard for the treatment of banks’ investments in the equity of funds that are held in the banking book, which will take effect from 1 January 2017.
  • Standardised approach for measuring counterparty credit risk exposures (SA-CCR): In March 2014, the Committee issued the final standard on SA-CCR, which will take effect from 1 January 2017. It will replace both the Current Exposure Method (CEM) and the Standardised Method (SM) in the capital adequacy framework, while the IMM (Internal Model Method) shortcut method will be eliminated from the framework.
  • Securitisation framework: The Committee issued revisions to the securitisation framework in December 2014 to strengthen the capital standards for securitisation exposures held in the banking book, which will come into effect in January 2018.
  • Capital requirements for bank exposures to central counterparties: In April 2014, the Committee issued the final standard for the capital treatment of bank exposures to central counterparties, which will come into effect on 1 January 2017.

Basel III leverage ratio: In January 2014, the Basel Committee issued the Basel III leverage ratio framework and disclosure requirements. Implementation of the leverage ratio requirements began with bank-level reporting to national supervisors until 1 January 2015, while public disclosure started on 1 January 2015. The Committee will carefully monitor the impact of these disclosure requirements. Any final adjustments to the definition and calibration of the leverage ratio will be made by 2017, with a view to migrating to a Pillar 1 (minimum capital requirements) treatment on 1 January 2018 based on appropriate review and calibration.
Basel III liquidity coverage ratio (LCR): In January 2013, the Basel Committee issued the revised LCR. It came into effect on 1 January 2015 and is subject to a transitional arrangement before reaching full implementation on 1 January 2019.7
Basel III net stable funding ratio (NSFR): In October 2014, the Basel Committee issued the final standard for the NSFR. In line with the timeline specified in the 2010 publication of the liquidity risk framework, the NSFR will become a minimum standard by 1 January 2018.
G-SIB framework: In July 2013, the Committee published an updated framework for the assessment methodology and higher loss absorbency requirements for G-SIBs. The requirements came into effect on 1 January 2016 and become fully effective on 1 January 2019. To enable their timely implementation, national jurisdictions agreed to implement by 1 January 2014 the official regulations/legislation that establish the reporting and disclosure requirements.
D-SIB framework: In October 2012, the Committee issued a set of principles on the assessment methodology and the higher loss absorbency requirement for domestic systemically important banks (D-SIBs). Given that the D-SIB framework complements the G-SIB framework, the Committee believes it would be appropriate if banks identified as D-SIBs by their national authorities were required to comply with the principles in line with the phase-in arrangements for the G-SIB framework, ie from January 2016.
Pillar 3 disclosure requirements: In January 2015, the Basel Committee issued the final standard for revised Pillar 3 disclosure requirements, which will take effect from end-2016 (ie banks will be required to publish their first Pillar 3 report under the revised framework concurrently with their year-end 2016 financial report). The standard supersedes the existing Pillar 3 disclosure requirements first issued as part of the Basel II framework in 2004 and the Basel 2.5 revisions and enhancements introduced in 2009.
Large exposures framework: In April 2014, the Committee issued the final standard that sets out a supervisory framework for measuring and controlling large exposures, which will take effect from 1 January 2019.

The structure of the attached table has been revamped (effective from October 2015) to monitor the adoption progress of all Basel III standards, which will come into effect by 2019.

Australian-Basel-2016


Trend Housing Finance Falls In February

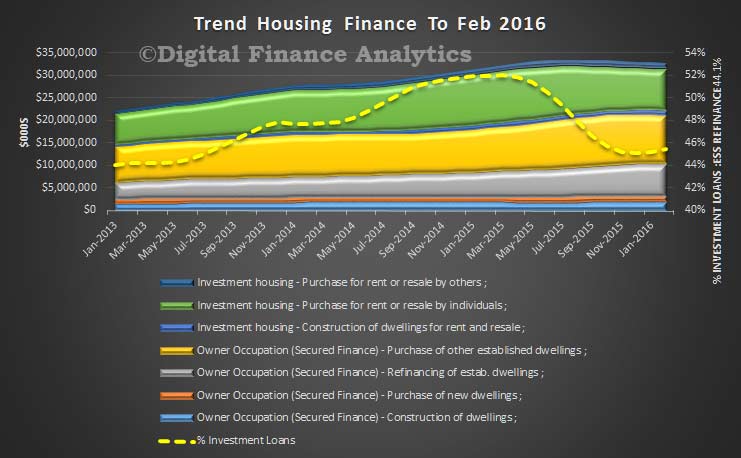
Data from the ABS today shows that the trend housing finance flows in February excluding alterations and additions fell 0.4%. Owner occupied housing commitments fell 0.6%, while investment housing commitments was flat. Owner occupied loans were worth $21 billion, and Investment loans were worth $11.5 billion. The proportion of loans for investment purposes (excluding for refinance) rebounded to 45.4%. Investment housing loans are still in demand.

Housing-Finance-Feb-2016-TrendHowever, the more dodgy seasonally adjusted data showed that the total value of dwelling finance commitments excluding alterations and additions rose 2.6%. This volatile series is often the one picked up in the press, but the ABS specifically warns about the seasonally adjusted numbers:

Market reactions to regulatory measures implemented by APRA in 2015 has resulted in increased volatility in some of the seasonally adjusted estimates included in this publication, particularly the value of finance commitments for owner occupied housing and investor housing. Care should be taken in interpreting the movements for this reference period, as the seasonally adjusted estimates may be revised in future periods.

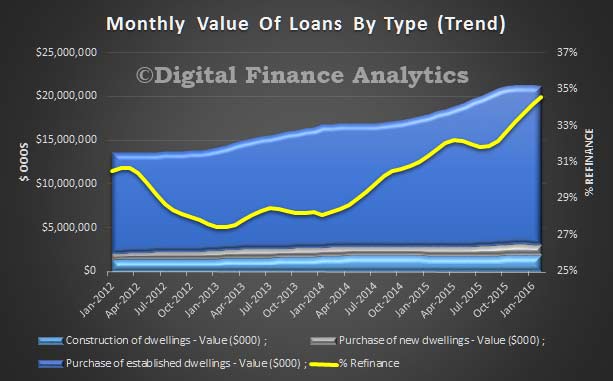
Refinancing of existing loans continues to lift as a proportion of all owner occupied loans, from 34.2% to 34.6% of all loans. This reflects the intense focus in the market on refinance by the banks, and the deep discounting on offer.  But the value of loans for the purchase of existing property fell 2.9%, whilst the value of refinanced loans fell 1.6%.

Value-By-Month-Feb-2016

In trend terms, the number of commitments for owner occupied housing finance were flat in February 2016 whilst the number of commitments for the purchase of new dwellings fell 1.5%, the number of commitments for the construction of dwellings fell 0.2%, and the number of commitments for the purchase of established dwellings rose 0.1%.

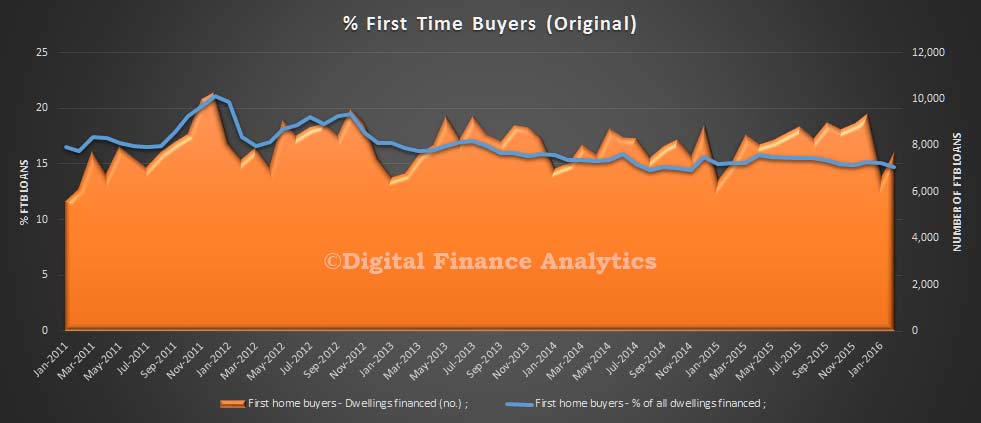
In original terms, the number of first home buyer commitments as a percentage of total owner occupied housing finance commitments fell to 14.7% in February 2016 from 15.1% in January 2016.

FTB-Feb-2016

The adjusted first time buyer data which includes a count of first time buyers going direct to the investment sector fell slightly, whilst the number of first time owner occupied buyers lifted by 16.3%, from 6,669 to 7,757. The average first time buyer loan fell again by 3.9%, from $338,000 to 327,500, reflecting tighter lending criteria. The average loan size for other borrowers also fell 4.2% from $374,300 to $358,500.

DFA-FTB-Tracker-Feb-2016

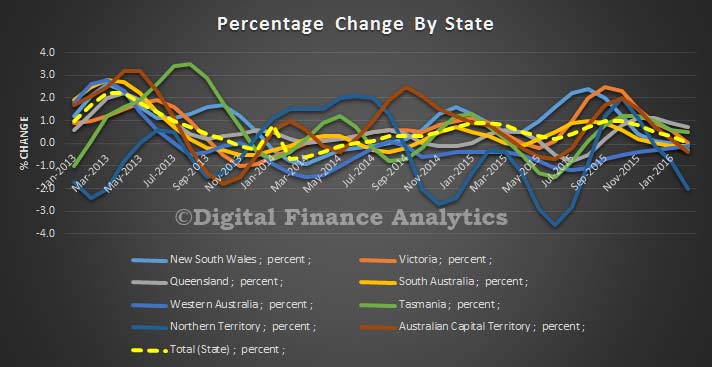
Lending momentum appears to be slowing across most states, though WA, already lower, moved up slightly.

State-Change-Feb-2016 So overall, momentum is easing a little, but demand for refinance is being stoked by the deep discounts on offer, investment property is still being purchase (including by some first time buyers), whilst the average loans values are down in response to the regulatory intervention. Lack of top line loan growth, if it continues, will have serious implications for bank profitability, and house prices. Also, consider those who hold loans currently outside today’s lending criteria, when the banks were lending more freely. Will some of those come home to roost?

Latest Edition Of The Quiet Revolution Shows Mobile First Strategy Now Essential

Digital Finance Analytics has today released the updated edition of our flagship household banking channel report, “The Quiet Revolution”, which is available free on request.

Quiet-Revolution-2016-CoverIn this report we examine the latest trends in banking channel use across our household segments. The move towards digital channels continues apace. We have reached a tipping point where “Mobile First” strategies should be the order of the day.

Digital Finance Analytics executes weekly omnibus surveys across a statistically representative set of households nationally. We collect data from 500 each week, and maintain a national database of 26,000 households. The data is then collated and analysed by segment. The channel aspects of the research look across the – search, apply, buy, transact and service – value chains. We also examine trends over time, and consumer device preferences. We rate channel preference using an algorithm which scores both what consumer has been doing in the last year, and an assessment of their desired future preference for channels and functionality.

The Quiet Revolution report contains a summary of the findings. Note that more detailed material, at a product level is available on a commercial basis.

Looking at channel usage on a segmented basis, compared with the last report from 2013-4, it is clear that online migration continues to deepen, and has spilled over into segments which traditionally were branch aligned. This is because of the rapid adoption of smart devices and “apps” which make online interaction easier. Banks are now providing a range of functionality on iOS, Android and Windows platforms. There is still a gap however between what is on offer and what is desired.

We find that younger households continue to be strongly aligned to online, whereas battlers and disadvantaged groups are more branch centric. Older wealthier groups prefer online, whereas older seniors and multicultural groups are still more branch orientated. There have been significant increases in time online between 2013 and 2016, especially among those segments will lower online penetration rates. Young consumers are connected on average for more than 110 hours each week, and nearly 85% of this time is spent with social media, video or other media and blogs. Web sites and internet banking only take a small amount of their time. Even battlers, who are spending less time online, still spend more than 75% of their time on social media and video sites.

We also examine trends across our digital segmentation, between those who are digital Natives (always used digital), Migrants (learning to use digital) and Luddites (not willing or able to use digital). The segments are distributed across the age ranges and shows the migration underway. Most younger households are natively digital, and the number of Luddites will continue to reduce, naturally. The financial footprints of these three segments are different. On average digital Natives have a  higher income than digital Migrants, who in turn have larger incomes than Luddites.

Digital Finance Analytics captures detailed financial footprint data in our surveys, and we are able to use this information to estimate a relative industry profit score by segment. We find that on average Luddites have a lower profit score compared with Natives and Migrants. Indeed, Migrants have the highest score. We found that the banking product mix varied by segment and in the report we explore the product mix in more detail.

High cost branches are being used more by lower profit customers. Given the migration underway we would expect to see a reduction in branch footprints. However, our analysis reveals this is not so for many of the major players. We conclude that so far many banks are not responding to the digital revolution by closing branches, although some have reconfigured them into smaller and more efficient units. In terms of closures, ANZ stands out as leading the way.

We also examined the prospective impact of Robo-Advice from a household perspective using data from our household surveys. We have found that currently those who have received financial advice already, and who are most digitally aware would readily consider Robo-Advice services. Our conclusion is that rather than growing and extending advice to more Australian households, the first impact of Robo-Advice will be to cannibalise existing advisor relationships.

Also, there are many different potential offerings which should be constructed on a Robo-Advice basis, as the needs of young affluent, are very different from say exclusive professionals. So effective segmentation of the offers will be essential, and different personas will need to be incorporated into the systems being developed.

So, in summary, The Quiet Revolution highlights that existing players need to be thinking about how they will deploy appropriate services through digital channels, as their customers are rapidly migrating there. We see this migration to digital more advanced amongst higher income households but momentum continues to spread. So players which are slow to catch the wave will be left with potentially less valuable customers longer term. Players need to adapt more quickly to the digital world. We are way past an omni-channel (let them choose a channel) strategy. We need to adopt a “mobile-first” strategy. Such digital migration needs to become central strategy because the winners will be those with the technical capability, customer sense and flexibility to reinvent banking in the digital age. The bank branch has limited life expectancy. Banks should be planning accordingly.

Request the report [31 pages] using the form below. You should get confirmation your message was sent immediately and you will receive an email with the report attached after a short delay.

Note this will NOT automatically send you our research updates, for that register here. You can find details of our other research programmes here.

[contact-form to=’mnorth@digitalfinanceanalytics.com’ subject=’Request The Quiet Revolution Report II – 2016′][contact-field label=’Name’ type=’name’ required=’1’/][contact-field label=’Email’ type=’email’ required=’1’/][contact-field label=’Email Me The Report’ type=’radio’ required=’1′ options=’Yes Please’/][contact-field label=’Comment if You Like’ type=’textarea’/][/contact-form]

The previous edition is still available, in which we discuss the digital branding of incumbents and challengers, using our thought experiment.

The “deadly embrance” between housing, house prices, and bank mortgages

An interesting IMF working paper “Mitigating the Deadly Embrace in Financial Cycles: Countercyclical Buffers and Loan-to-Value Limits” examines the limitations of Basel III in the home loan market, and makes the point that the risk-weighted focus, even with enhancement, does not cut the mustard especially in a rising or falling property market. Indeed, there is a “deadly embrance” between housing, house prices, and bank mortgages which naturally leads to housing boom and bust cycles, which can be very costly for the economy and difficult for central banks to manage. They find that macroprudential measures may assist, but even then the deadly embrace remains.

The financial history of the last eight centuries is replete with devastating financial crises, mostly emanating from large increases in financial leverage.  The latest example, the Global Financial Crisis of 2008-09, saw the unwinding of a calamitous run-up in leverage by banks and households associated with the housing market. As a result, the financial supervision community has acknowledged that microprudential regulations alone are insufficient to avoid a financial crisis. They need to be accompanied by appropriate macroprudential policies to avoid the build-up of systemic risk and to weaken the effects of asset price inflation on financial intermediation and the buildup of excessive leverage in the economy.

The Basel III regulations adopted in 2010 recognize for the first time the need to include a macroprudential overlay to the traditional microprudential regulations. Beyond the requirements for capital buffers, and leverage and liquidity ratios, Basel III regulations include CCBs between 0.0 and 2.5 percent of risk-weighted assets that raise capital requirements during an upswing of the business cycle and reduce them during a downturn. The rationale is to counteract procyclical-lending behavior, and hence to restrain a buildup of systemic risk that might end in a financial crisis. Basel III regulations are silent, however, about the implementation of CCBs and their cost to the economy, leaving it to the supervisory authorities to make a judgment about the appropriate timing for increasing or lowering such buffers, based on a credit-to-GDP gap measure. This measure, however, does not distinguish between good versus bad credit expansions and is irrelevant for countries with significant dollar lending, where exchange rate fluctuations can severely distort the credit-to-GDP gap measure.

One of the limitations of Basel III regulations is that they do not focus on specific, leverage-driven markets, like the housing market, that are most susceptible to an excessive build-up of systemic risk. Many of the recent financial crises have been associated with housing bubbles fueled by over-leveraged households. With hindsight, it is unlikely that CCBs alone would have been able to avoid the Global Financial Crisis, for example.

For this reason, financial supervision authorities and the IMF have looked at additional macroprudential policies. For the housing market, three additional types of macroprudential regulations have been implemented: 1) sectoral capital surcharges through higher risk weights or loss-given-default (LGD) ratios;3 2) LTV limits; and 3) caps on debt-service to income ratios (DSTI), or loan to income ratios (LTI). Use of such macroprudential regulations has mushroomed over the last few years in both advanced economies and emerging markets. At end-2014, 23 countries used sectoral capital surcharges for the housing market, and 25 countries used LTV limits. An additional 15 countries had explicit caps on DSTI or LTI caps. The experience so far has been mixed.in a sample of 119 countries over the 2000-13 period find that, while macroprudential policies can help manage financial cycles, they work less well in busts than in booms. This result is intuitive in that macroprudential regulations are generally procyclical and can therefore be counterproductive during a bust when bank credit should expand to offset the economic downturn.

Macroprudential regulations are often directed at restraining bank credit, especially to the housing market. They do not, however, take into account the tradeoffs between mitigating the risks of a financial crisis on the one side and the cost of lower financial intermediation on the other. In addition, given that these measures are generally procyclical, they can accentuate the credit crunch during busts. More generally, an analytical foundation for analyzing these tradeoffs has been lacking. MAPMOD has been designed to help fill this analytical gap and to provide insights for the design of less procyclical macroprudential regulations.

The MAPMOD Mark II model in this paper includes an explicit housing market, in which house prices are strongly correlated with banks’ credit supply. This corresponds to the experience prior and during the Global Financial Crisis. This deadly embrace between bank mortgages, household balance sheets, and house prices can be the source of financial cycles. A corollary is that the housing market is only partially constrained by LTV limits as the additional availability of credit itself boosts house prices, and thus raises LTV limits.

The starting point of the MAPMOD framework is the factual observation that, in contrast to the loanable funds model, banks do not wait for additional deposits before increasing their lending. Instead, they determine their lending to the economy based on their expectations of future profits, conditional on the economic outlook and their regulatory capital. They then fund their lending portfolio out of their existing deposit base, or by resorting to wholesale funding and debt instruments. Banks actively seek new opportunities for profitable lending independently of the size or growth of their deposit base—unless constrained by specific regulations.

In MAPMOD, Mark II, we extend the original model by introducing an explicit housing market. We use the modular features of the model to analyze partial equilibrium simulations for banks, households, and the housing market, before turning to general equilibrium results. This incremental approach sheds light on the intuition behind the model and simulation results.

The housing market is characterized by liquidity-constrained households that require financing to buy houses. A house is an asset that provides a stream of housing services to households. The value of a house to each household is the net present value of the future stream of housing services that it provides plus any capital gain/loss associated with future changes in house prices. We define the fundamental house price households are willing to pay to buy a house the price that is consistent with the expected income/productivity increases in the economy. If prices go above the fundamental house price reflecting excessive leverage, we refer to this as an inflated house price. The supply of houses for sale in the market is assumed to be fixed each period. House prices are determined by matching buyers and sellers in a recursive equilibrium with expected house prices taken as given. We abstract from many real-world complications such as neighborhood externalities, geographical location, square footage or other forms of heterogeneity.

Bank financing plays a critical role in the determination of house prices in the model. If banks provide a larger amount of mortgages on an expectation of higher household income in the future, demand for housing will go up, thus inflating house prices. Conversely, if banks reduce their loan exposure to the housing market, demand for houses in the economy will be reduced, leading to a slump in house prices. House prices therefore move with the credit cycle in MAPMOD, Mark II, just as in the real world.

Nonperforming loans and foreclosures in the housing market occur when households are faced with an idiosyncratic, or economy-wide, shock that affects their current LTV or LTI characteristics. Banks will seek to reduce the likelihood of losses by requiring a sufficiently high LTV ratio to cover the cost of foreclosure. But they will not be able to diversify away the systemic risk of a general fall in house prices in the economy. Securitization of mortgages in MAPMOD is not allowed. And even if banks were able to securitize mortgages, other agents in the economy would need to carry the systemic risk of a sharp fall in house prices. At the economy-wide level, the systemic risk associated with the housing market is therefore not diversifiable. The evidence from the Global Financial Crisis on securitization and credit default swaps confirms that this is the case, regardless of who holds mortgage-backed securities.

This paper presented a new version of MAPMOD (Mark II) to study the effectiveness of macroprudential regulations. We extend the original MAPMOD by explicitly modeling the housing market. We show how lending to the housing market, house prices, and household demand for housing are intertwined in the model in a what we call a deadly embrace. Without macroprudential policies, this naturally leads to housing boom and bust cycles. Moreover, leverage-driven cycles have historically been very costly for the economy, as shown most recently by the Global Financial Crisis of 2008–09.

Macroprudential policies have a key role to play to limit this deadly embrace. The use of LTV limits for mortgages in this regard is ineffective, as these limits are highly procyclical, and hold back the recovery in a bust. LTV limits that are based on a moving average of historical house prices can considerably reduce their procyclicality. We considered a 5 year moving average, but the length of the moving average used should probably vary based on the specific circumstances of each housing market.

CCBs may not be an effective regulatory tool against credit cycles that affect the housing market in particular, as banks may respond to higher/lower regulatory capital buffers by reducing/increasing lending to other sectors of the economy.

A combination of LTV limits based on a moving average and CCBs may effectively loosen the deadly embrace. This is because such LTV limits would attenuate the housing market credit cycle, while CCBs would moderate the overall credit cycle. Other macroprudential policies, like DSTI and LTI caps, may also be useful in this respect, depending on the specifics of the financial landscape in each country. It is, however, important to recognize that all these macroprudential policies come at a cost of dampening both good and bad credit cycles. The cost of reduced financial intermediation should be taken into account when designing macroprudential policies.

Note: IMF Working Papers describe research in progress by the author(s) and are published to elicit comments and to encourage debate. The views expressed in IMF Working Papers are those of the author(s) and do not necessarily represent the views of the IMF, its Executive Board, or IMF management.


Less Model Reliance Should Reduce Bank Ratio Variation – Fitch

The Basel Committee on Banking Supervision has proposed that banks should stop using models to calculate capital for some hard-to-model portfolios and face significant constraints on model usage for others. If adopted, this should reduce variation in capital adequacy ratios across banks, says Fitch Ratings. But this increases the need for the Committee to develop a more risk-sensitive standardised approach (SA).

The proposals, published earlier this month for consultation until 24 June, eliminate the use of Internal Ratings Based (IRB) models for low-default exposures to banks, financial institutions, and large corporates with assets in excess of EUR50bn. This means that all banks would use the revised SA for calculating risk weightings on these asset types.

Low-default portfolios are difficult to model because data is limited and historic default experience is low. Such data is needed for reliable IRB modelling. Although not included in these proposals, sovereign exposures are also regarded as low default, and we think it is likely that the Committee might adopt a similar approach for this portfolio once its sovereign risk-weight review is concluded.

The Committee’s proposals would still allow IRB modelling for exposures to smaller corporates and for retail customers, subject to restrictions to narrow the range of outcomes.

For example, proposals to increase minimum probability of default (PD) assumptions for retail mortgages to 5bp from 3bp could increase risk weights on these portfolios by 50% if all else remains equal. For corporates with revenues above EUR200m but assets below EUR50bn, models are still allowed, but loss-given default assumptions (LGD) on unsecured senior lending will be fixed at 45%. Currently, banks can use internal model estimates to calculate capital charges for these exposures that may be less conservative. The introduction of a minimum floor to the models will mean outputs are more comparable across banks.

For the first time, the Committee revealed its thoughts on the calibration of an aggregate permanent risk-weighted, asset-capital floor based on the revised SA, to be in the range of 60% to 90%. This will limit the benefit to banks from lower risk weights generated by their IRB models, compared with the revised SA weightings.

If the Committee’s proposals are adopted, the revised SA will become far more important than the IRB approach for calculating capital requirements. Reducing banks’ reliance on internal models could boost public confidence in regulatory capital ratios, and enable creditors to make better informed decisions.

Banks have developed IRB models at significant cost and we expect them to lobby hard to maintain incentives to continue to use the modelled approaches. The Committee does not intend to raise overall capital requirements for banks, but we think these proposals could lead to an increase in capital requirements for low-risk weight portfolios. Some banks might question their continued investment in internal models, although we think many might still use them for their own risk management. We think this would be useful because models can create more robust risk-management frameworks.

An earlier Basel Committee study signalled notable differences in how banks estimate key model parameters including PD and LGD for the same exposures. The review concluded that a significant source of risk-weighted asset variation was due to different modelling choices between banks, such as the definition of default, and adjustment for cyclical effects. In contrast, the SA reduces variability because it prescribes set risk weights for different risk categories.

Negative rates for 2-3 years become worry for banks – ECB’s Praet

Negative interest rates become a worry for banks’ business models if they persist for two or three years, the European Central Bank’s chief economist said on Thursday.

The ECB has charged banks for parking money overnight since June 2014, leading to complaints from lenders that their margins are being squeezed because they cannot pass on the charge to their depositors.

In his clearest acknowledgment to date of banks’ concerns, Peter Praet said: “The persistence of negative rates over time — two, three years — is something that becomes quite worrisome if you think about the implications for business models.”

In addition, Peter Praet, Member of the Executive Board of the ECB, in his speech, indicated that measures taken by the ECB, including negative interest rate policy is sizeable (again excluding the March 2016 decisions). According to their staff assessment, the policy is contributing to raise euro area GDP by around 1.5% in the period 2015-18.


BOQ lifts variable home loan interest rates

BOQ today announced it will increase interest rates on its variable home loan products by 0.12 per cent per annum for owner-occupiers and 0.25 per cent per annum for investors.

The increase will see the Bank’s Clear Path variable rate home loan lift to 4.72% per annum for owner-occupiers and 5.14% per annum for investors. The standard variable rate home loan will move to 5.86% per annum for owner-occupiers and 6.28% per annum for investors.   CEO Jon Sutton said the changes were driven by the need to balance growth, risk and margins over the longer term. “This is not a decision that was made lightly and we were very mindful of the impact on our customers even in an environment where interest rates remain at very low levels,” he said.  “However, given the fiercely competitive market and increased funding spreads and hedging costs, these increases are necessary to help us achieve the appropriate balance between growth, asset quality and profitability,” he said “We still retain very competitive products and pricing, particularly with our lead mortgage product Clear Path, which will enable us to continue to compete strongly in the segments we want to target. “Clear Path is a full-featured, low-fee product which, after these changes, still offers one of the best comparison rates in the market to our customers.”

The new rates will be effective from 15 April 2016.

Revisions to the Basel III leverage ratio framework

The Basel III framework introduced a simple, transparent, non-risk based leverage ratio to act as a credible supplementary measure to the risk-based capital requirements. The Basel Committee is of the view that a simple leverage ratio framework is critical and complementary to the risk-based capital framework and that a credible leverage ratio is one that ensures broad and adequate capture of both the on- and off-balance sheet sources of banks’ leverage.

The latest document sets out the Committee’s proposed revisions to the design and calibration of the Basel III leverage ratio framework. The proposed changes have been informed by the monitoring process in the parallel run period since 2013, by feedback from market participants and stakeholders and by the frequently asked questions process since the January 2014 release of the standard Basel III leverage ratio framework and disclosure requirements.

Among the areas subject to proposed revision in this consultative document are:

  • measurement of derivative exposures;
  • treatment of regular-way purchases and sales of financial assets;
  • treatment of provisions;
  • credit conversion factors for off-balance sheet items; and
  • additional requirements for global systemically important banks.

The final design and calibration of the proposals will be informed by a comprehensive quantitative impact study.

The Committee welcomes comments on all aspects of this consultative document and the proposed standards text. The deadline for submissions is Wednesday 6 July 2016.

APRA, Basel Committee: Another GFC is coming

From Australian Broker.

Both the global banking regulator and Australia’s banking regulator have warned another financial crisis is imminent.

Speaking at the Australian Financial Review (AFR) Banking and Wealth Summit in Sydney yesterday, Bill Coen, the secretary-general the Basel Committee on Banking Supervision, the global banking regulator, said another global financial crisis is “statistically certain”.

“As regulators, our focus is invariably on the downside risks rather than the upside. I’m an optimist by nature but maybe a pessimist by fact and experience. We know with statistical certainty there will be another financial crisis,” Coen said.

Echoing Coen’s warning, Wayne Byres, the chairman of Australian banking regulator APRA, said it is not a matter of “if” but “when”.

“When adversity arrives – and it will, it is not ‘if’, it will – to the extent possible we want the banking system to help alleviate rather than exacerbate problems. Ideally act as shock absorber not an amplifier.”

Byres said this is why it is important to build strength and resilience now.

“The main message I want to talk about today is that it is better we continue to invest in building resilience now when it can be done in an orderly manner from a position of relative strength than try to do so in more difficult times.”

Last year, the regulator announced an increase in the amount of capital required to be held by lenders against residential mortgages. This resulted in the big four banks raising more than $18 billion combined in new equity from shareholders.

APRA also enforced a limit on investment lending and warned it would be keeping a close watch on credit asessments.

Byres said capital requirements were likely to continue to move higher in 2016, amongst other regulatory work, to ensure our Australian banks are “unquestionably strong”, as recommended by the Murray Financial System Inquiry (FSI).

“Achieving this objective will involve work in four broad areas, and take the next several years to fully implement,” Byres told the summit.

“The four areas I have highlighted are: reinforcing capital strength; improving the stability of liquidity and funding profiles; enhancing both the public and private sectors’ readiness for adversity; and strengthening the risk culture within the financial system.”

According to Coen, increasing bank resilience in good times is the “most efficient and effective” way of dealing with periods of stress.

“The message here is caution against complacency,” Coen said.