Macquarie buys up mortgages in $1bn deal

From Mortgage Professional Australia.

Macquarie Group agreed to buy the rest of ING Direct’s unbranded mortgages portfolio in a $1 billion deal with the Dutch lender, The Australian reports.

This will take its mortgage book well above the pre-GFC peak of $25 billion.

In 2013, Macquarie bought a $1.5bn book of non-branded mortgages from ING Direct, then acquired a $1.6bn portfolio in 2014 and in 2015 followed with another $1.5bn deal.

Macquarie chief executive, Nicholas Moore pledged to restore the bank’s pre-GFC grip on the sector back in 2014.

The string of acquisitions from ING means this target has been far exceeded, prompting questions about where the bank’s aspirations in the market now lie.

From Global Savings Glut to Financing Infrastructure

A new IMF working paper investigates the emerging global landscape for public-private co-investments in infrastructure. The creation of the Asian Infrastructure Investment Bank and other so-called “infrastructure investment platforms” are an attempt to tap into the pool of both public and private long-term savings in order to channel the latter into much needed infrastructure projects. This paper puts these new initiatives into perspective by critically reviewing the literature and experience with public private partnerships in infrastructure. It concludes by identifying the main challenges policymakers and other actors will need to confront going forward and to turn infrastructure into an asset class of its own.

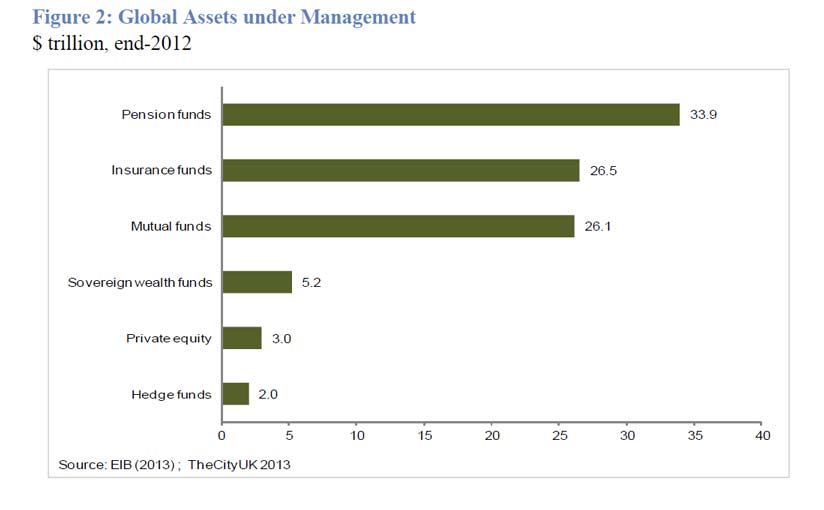
Institutional investors such as pension funds, insurance companies and mutual funds, and other investors such as sovereign wealth funds hold around $100 trillion in assets under management. One gets a clearer grasp of the enormous size of this global wealth by comparing it to US nominal GDP $18 trillion in 2015.
Global-AssetsAgainst this backdrop of a largely untapped pool of global savings, estimates suggest that the world needs to increase its investment in infrastructure by nearly 60 percent until 2030. There is a huge infrastructure investment gap in a large number of countries. The average infrastructure investment gap amounts to between $1 to 1.5 trillion per year. Infrastructure investment needs are mostly earmarked for upgrading depreciating brownfield infrastructure projects in the EU and in the US and for greenfield investments in low-income and emerging markets. The future growth in the demand for infrastructure will come increasingly from emerging economies.
There is growing recognition globally that development banks can play an important role in facilitating the preparation and financing of infrastructure projects by private long-term investors. A number of infrastructure platform initiatives have been launched very recently, most of them still at a prototype development stage. We discuss four different models that are currently at various stages of development. These platforms are all different attempts to tap into the vast pool of global long-term savings by better meeting long-term investor needs to attract them to infrastructure assets and by relaxing operating and governance constraints traditional development banks have been facing.
A first obvious lesson from an analysis of these platforms, is that the ability of development banks to leverage public money –committed capital from government contributions—by attracting private investors as co-investors in infrastructure projects is increasing the efficiency of development banks around the world. It is not just the fact that development banks are able to invest in larger-scale infrastructure projects and thus obtain a greater bang for the public buck, but also that these private investors together with development banks can achieve more efficient PPP concession contracts. Development banks are not just lead investors providing some loss absorbing capital to private investors. They also give access to their expertise and unique human capital to private investors, who would otherwise not have the capabilities to do the highly technical, time-consuming, due diligence to identify and prepare infrastructure projects. In addition, they offer a valuable taming influence on opportunistic government administrations that might be tempted to hold up a private PPP concession operator. Private investors in turn keep development banks in check and ensure that infrastructure projects are economically sound and not principally politically motivated. No wonder that this platform model is increasingly being embraced by development banks around the world.
The paper has documented that new platforms of investments have emerged. Notwithstanding, they are confronted with serious structural limitations. These platforms will certainly help on two important fronts namely on financing and origination of infrastructure projects, which this paper has focused on. Formally integrating these dimensions in models of PPP are important avenues for academic research.
Besides financing and origination, there are other important challenges to complete the broader task that lie ahead, such as in making infrastructure investment an asset class of its own. Two important directions are needed to further the agenda. First, the lack of standardization of underlying infrastructure projects is an important impediment to the scaling up of investment into infrastructure-based assets. Large physical infrastructure projects are indeed complex and can differ widely from one country to the next. In that respect, making use of securitization techniques such as collateralized bond obligations (or CBOs) or collateralized loan obligations (or CLOs) allow for better price discovery which will enhance the efficiency of the market and allow a more effective pooling of risk. It would also allow to “bulk up” the bond offering by addressing the problem of insufficient large sized bond issues. Overall, securitization will provide many advantages such as diversification for investors, lower cost of capital by allowing senior tranches to be issued with higher credit ratings, as well as higher liquidity. At the same time, securitization also creates debt instruments of variable credit risks to match the different risk appetites of investors. Second, there are important complementarities between actors participating in the “value chain” created by platforms including host countries, financial investors, guarantors and financial intermediaries. For all these reasons, the EIB has recently launched a renewable energy platform for institutional investors (REPIN) to offer repackaged renewable energy assets in standardized, liquid forms to institutional investors15. Although interest from institutional investors has been limited so far, the new carbon footprint disclosures and regulations of institutional investors that are expected be implemented after the Paris COP 21 climate summit, could nudge more pension and sovereign wealth funds to take on these securities.
Finally, host countries may put forth viable long term infrastructure projects but without the provision of guarantees to address construction, demand, exchange rate risks or without the securitization of underlying assets by financial intermediaries, those projects will not be funded, thus leaving everyone worse off. There is obviously also a need for enhanced coordination and cooperation across the various platforms in existence and for the creation of a global infrastructure investment platform. Part of the coordination should lead to risks being assumed by those best placed to hold them. Governments are the natural holders of political, regulatory and governance risks. The private sector for obvious incentive reasons should take on most of the construction risk, and demand risk should probably be shared, depending on the sector and type of project.
Note: IMF Working Papers describe research in progress by the author(s) and are published to elicit comments and to encourage debate.The views expressed in IMF Working Papers are those of the author(s) and do not necessarily represent the views of the IMF, its Executive Board,or IMF management.

CBA Profit Up 2% HY to Dec 2015

In CBA’s results, announced today, we see a well managed portfolio, with no surprises on either capital or dividends. They had the benefits of higher home loan pricing, and deposit rate management helping to offset some pressure in returns from the Institutional Banking arm. CBA’s early moves into digital banking continue to pay off, with 40% of retail banking sales now via mobile devices. Exposure to the resources sector is controlled, and the bank is well capitalised (on  a relative and absolute basis), with a lift in key ratios. Earning per share decreased a little.

Statutory net profit after tax (NPAT) for the half year ended 31 December 2015 was $4,618 million, a 2 per cent increase on the prior comparative period (‘pcp’). Cash net profit after tax increased 4 per cent to $4,804 million, 6 per cent higher on the prior half. Return on equity was 16.6% and earnings per share was 273.6 cents, a decrease of 1% on the prior comparative period.

The Board declared an interim dividend of $1.98 per share, unchanged from the 2015 interim dividend. The dividend payout ratio is 70.8 per cent of cash NPAT. The interim dividend, which will be fully franked, will be paid on 31 March 2016. The ex-dividend date is 16 February 2016. The Dividend Reinvestment Plan (DRP) will continue to operate, but no discount will be applied to shares issued under the plan for this dividend. The Group is also considering the issue of a Tier 1 capital instrument to replace PERLS III should markets be receptive.

In summary, operating income growth was solid across most businesses, relative to both the prior comparative period and prior half but operating expenses increased due to underlying inflationary pressures, the impact of foreign exchange, increased investment spend and higher amortisation, though partly offset by the incremental benefit generated from productivity initiatives. Also loan impairment expense increased mainly due to higher provisioning in Institutional Banking and Markets, Retail Banking Services, and IFS.

Group transaction balances grew 21 per cent and above-system growth was achieved in household deposits (up 10.6 per cent) and business lending (up 6.8 per cent, excluding Bankwest). A balanced approach to margin over volume in home lending produced growth of 6.5 per cent, slightly below system. ASB saw 12 per cent growth in business and rural balances.

Other banking income increased 4 per cent, due to higher profits from associates and solid growth in fees and commissions, partly offset by derivative valuation adjustments.

Growth in insurance and funds management income of 17 per cent and 6 per cent, respectively, led to a 10 per cent increase in underlying profit after tax for the Wealth Management division.

Operating expenses increased 6% to $5,216 million, including a 1% impact from the lower Australian dollar. This reflects higher staff costs from inflation-related salary increases, increased investment spend and higher amortisation. This was partly offset by the continued realisation of incremental benefits from productivity initiatives

Ongoing investment spend, inflation and unfavourable foreign exchange movements resulted in a 6.1 per cent increase in total operating expenses. On an underlying basis, expenses grew 3.8 per cent as a result of cost discipline in business units. Total investment spend increased 14 per cent, with the majority earmarked for productivity and growth initiatives.

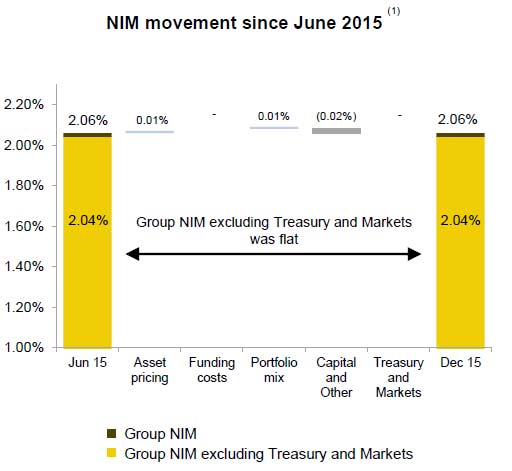
Net interest income increased 6 per cent to $8,364 million, reflecting 9 per cent growth in average interest earning assets driven by solid volume growth and revenue momentum across the business. This increase includes a 1% benefit from the lower Australian dollar. Net interest margin excluding Treasury and Markets decreased five basis points on the prior comparative period to 2.06%.
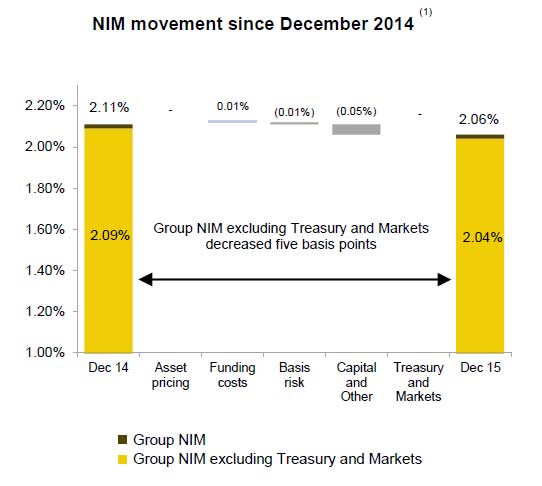
CBA-Feb-2106-1However, overall, 2.06% is the same as Jun 15 Half.  This was helped by higher home lending margins, due to investor and variable rate pricing; and stable deposit margins, driven by a benefit from a change in deposit mix, offset by the lower cash rate environment. In addition, better margins from lending to business, and lower business deposit rates contributed.  However, at BankWest, net interest margin decreased on the prior half, due to lower business lending margins and the lower cash rate impact on deposit margins, partly offset by increased home loan margins resulting from repricing.
CBA-2016-NIMLoan impairment expense increased 3 per cent on the prior half to $564 million, and the loan loss ratio remained stable at 17bpts.
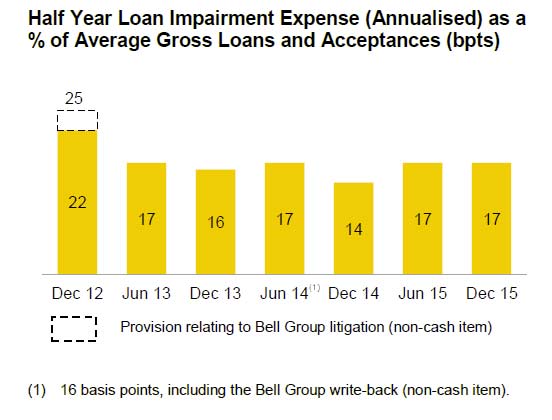
CBA-2016-3Various elements contributed to this  including higher collective provisions and a lower level of writebacks in Institutional Banking and Markets; an increase in IFS as a result of provisions in the
commercial lending portfolio; partly offset by reduced expense in Retail Banking Services driven by seasonally lower arrears across all portfolios; increased write-backs and lower collective provisions in Business and Private Banking; and decreased expense in New Zealand resulting from lower home loan impairment expense, and an increased level of write-backs in the business lending portfolio.

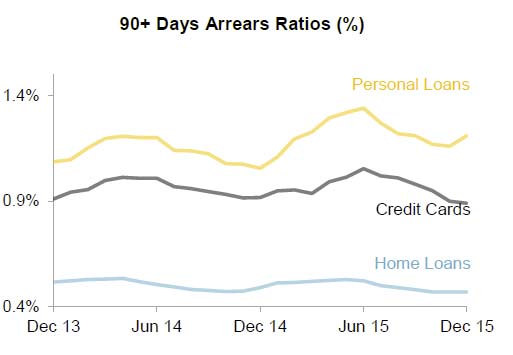
Consumer arrears were well controlled, though whilst the arrears for the home loan and credit card portfolios are relatively low, personal loan arrears remained elevated, driven primarily by Western Australia and Queensland.
CBA-2016-4Commercial troublesome assets increased 2% during the half to $3,123 million. Gross impaired assets were lower on the prior half at $2,788 million. Gross impaired assets as a proportion of GLAAs of 0.41% decreased 3 basis points on the prior half, reflecting the improving quality of the corporate portfolios.

There was no change to the economic overlay.

The Group’s balance sheet and conservative positions on capital, funding and liquidity have been strengthened in the first half. Growth in customer deposits of 9 per cent to $500 billion increased deposit funding to 64 per cent of total funding, up 1 per cent. The Group’s liquidity coverage ratio increased to 123 per cent as at 31 December 2015, up from 120 per cent at the end of the prior half, with the Group continuing to benefit from a strong position in more stable deposits.

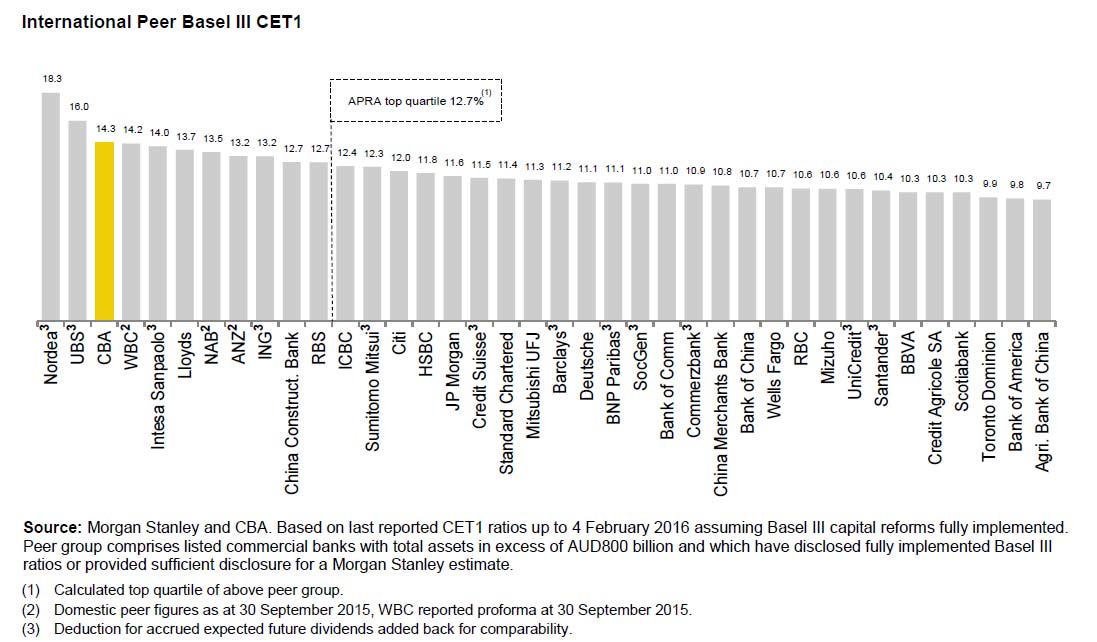
Basel III Common Equity Tier 1 (CET1) capital increased 100bpts to 10.2 per cent on an APRA basis (14.3 per cent on an internationally comparable basis), reflecting organic capital growth and the proceeds of the rights issue.
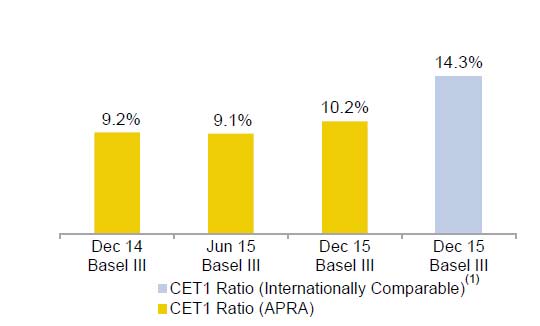
CBA-2016-5They say this puts the Group in the top quartile of banks globally for capital adequacy.
CBA-2016-6Customer satisfaction rankings continued to improve.

They reported a strong uptake of digital and mobile services in the half with  Tap & Pay card numbers  more than doubling on the prior half, Cardless Cash transactions grew 96 per cent, and the value of transactions via the CommBank app was up 27 per cent. The volume of transfers via mobile now exceeds BPAY volumes through Netbank. They are also seeing customers increasingly turn to mobile for product purchases with mobile now accounting for 40 per cent of Retail Banking Services sales.

CBA-2016-7In the half, CBA made additional future-focused investments in technology and skills. This included $10 million to help Australian researchers build the world’s first silicon-based quantum computer,  committed $1.6 million to develop a centre of expertise for cyber security education with the University of New South Wales. They also launched a series of blockchain workshops for industry and regulators, and are collaborating with other international banks on blockchain trials.

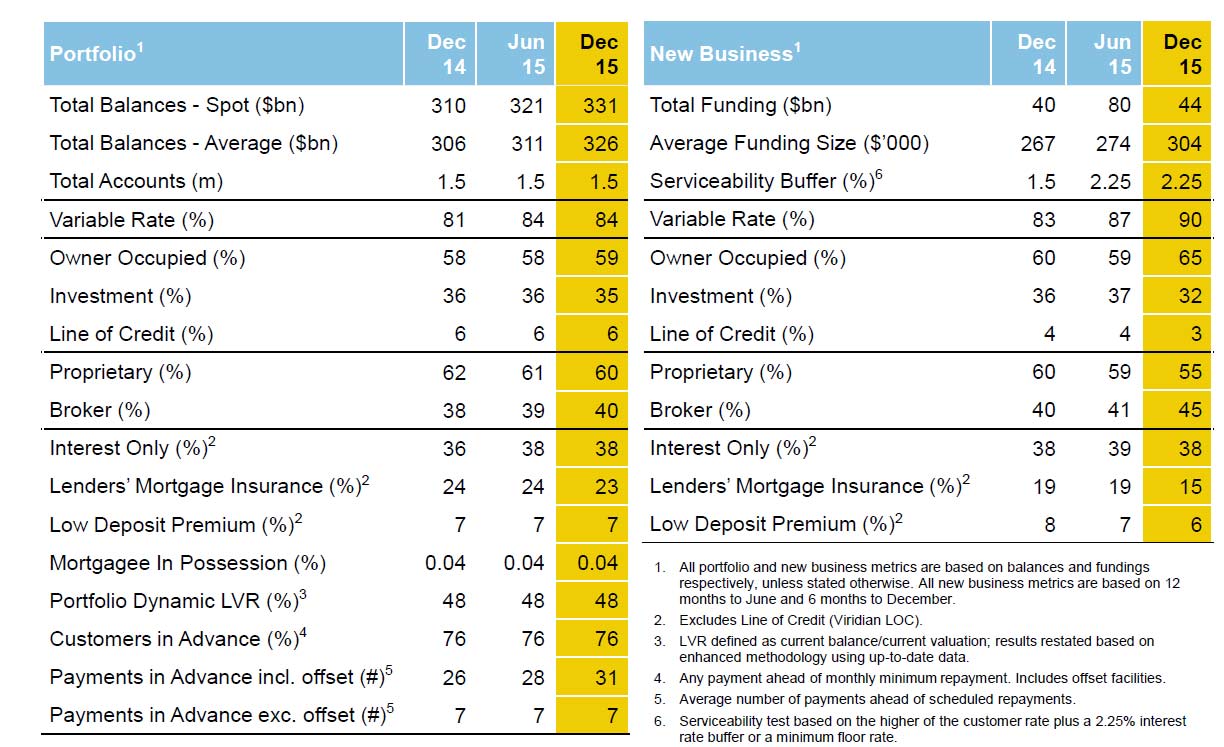
Looking in detail at home lending in Australia, CBA provided some interesting insights. For example,  looking at the core Australian Bank portfolio, 45% of new home loans are originated via brokers. 38% of new loans are interest only, and the current serviceability buffer has been lifted by 75 basis points in the past year. Those customers paying in advance, including offsets, was 76%.
CAB-2016-8They also show that 90+ arrears are growing fastest in WA.
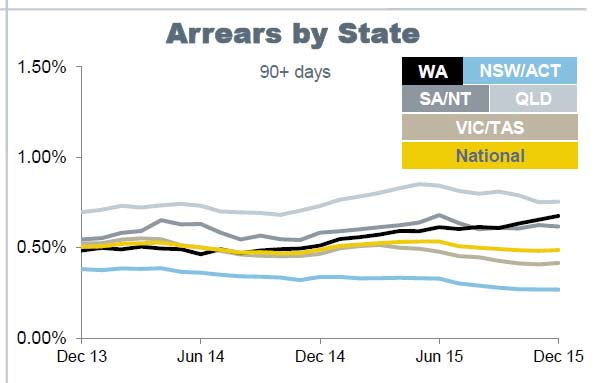
CBA-2016-9On the other hand, portfolio is much stronger in NSW and VIC.

Finally, they reported exposures to Mining, Oil and Gas at $18.9bn – or 1.8% of Group TCE. They argue much of the portfolio is investment grade. Within the portfolio, impaired assets have risen from 0.8% in Jun 15 to 1.9% in December 15.

Market manipulation – ASIC better get it right, first time

From The Conversation.

Greg Medcraft, chairman of the corporate regulator ASIC, is a distinguished banker who worked for 27 years in the obscure world of asset securitisation with the large French bank Societe Generale. He helped to set up the American Securitisation Forum (ASF) and is also chairman of the international securities industry body, IOSCO, which bills itself as “the global standard setter for securities markets regulation”.

Mr Medcraft then is probably as well placed as anyone in Australia to understand the complexities of the financial markets that gave rise to the interest rate benchmark manipulation scandals, which are grouped under the general term LIBOR but include other benchmarks such as EURIBOR, TIBOR and the local variant, BBSW (Bank Bill Swap Rate).

The fallout from these scandals rolls on but according to reporting by Adele Ferguson (a one-woman regulator) it will soon be the turn of BBSW to take the spotlight.

The reasons that manipulation of interest rate benchmarks took place are complicated, caused by an explosion of financial trading in the last 20 years, especially in so-called Interest Rate Swaps (IRS), and the failure of regulators to handle the flood of new types of securities.

[For an academic explanation of the phenomenon, see here and here and for a general overview see here.]

The initial reaction to the revelations that Australian banks just might be involved with manipulating BBSW was outrage, especially from AFMA, the investment bankers’ industry body. This stance was however undermined when, in January 2014, ASIC accepted an “enforceable undertaking” from BNP Paribas (BNP) in relation to potential misconduct involving BBSW.

Since then, however, there has been little information about other possible instances of BBSW manipulation other than ASIC’s investigations were ongoing and ongoing and ongoing.

It is strongly rumoured that ANZ will be in the firing line when ASIC eventually decides to take regulatory action, long after other jurisdictions have done so. This is, in part to do with the salacious revelations emerging from a civil case brought by ANZ traders against the bank for wrongful dismissal related to possible manipulation of BBSW.

ASIC is in the spotlight and it really has to put up or shut up.

Many of the big birds have already flown. With the recent departure of Mike Smith from ANZ, all of the CEOs of the big Australian banks who were in charge when the BBSW investigation was started have gone. ASIC’s inquires have taken so long that the chances of getting any “clawback” of bonuses if serious misconduct is proven have disappeared.

Unfortunately, Mr Medcraft is an accountant rather than a lawyer and ASIC faces a real legal quandary – whether to prosecute the individuals involved, the banks they worked for, or both. All of these paths are fraught with possible dangers.

Going after individuals is difficult. Although the UK Serious Fraud Office had a win against Tom Hayes, the Libor Mastermind, it had a spectacular loss against six brokers who had been accused of supporting Hayes. The failure to convict the brokers resulted in the ridiculous situation where Hayes was convicted but his alleged co-conspirators walked free.

A UK legal expert, Alison McHaffie noted that

“Apart from being acutely embarrassing to the SFO, these verdicts show how difficult it is to demonstrate criminal activity by individuals for this type of market misconduct

It is always easier to bring regulatory action rather than criminal prosecution.”

Which brings us to the second option, going after the banks.

If the reports are correct, ASIC may be considering prosecuting ANZ, although it is difficult to see under which statute. In the past, Mr Medcraft has pointed to Section 12.2 of the Commonwealth Criminal Code, which he argued would allow

“companies to be charged with being an accessory to a crime if the company’s culture encouraged or tolerated breaches of law.”

But that was in the days when “culture” was flavour of the moment.

It would be a brave (and probably foolhardy) regulator who would take on a single bank alone, hoping to prove conclusively in court that the bank’s culture was responsible for fraud and misconduct. That is only a bonanza for lawyers for the next decade.

So what to do?

History has shown that a single regulator can do very little on their own, especially one whose mandate is so diffuse and its staff so overstretched.

Overseas experience has shown that when multiple regulators get together, share information, skills and most importantly purpose they can succeed in jointly fining multiple banks. Singly, regulators can get picked off – as a pack they can be successful.

In the Australian context, what this means is that, while ASIC might be the spearhead, the real firepower should be provided by the Council of Financial Regulators, comprising ASIC, APRA and the RBA. When ASIC finally decides to prosecute someone for manipulating the market, the other members of the CFR should not only come out in unequivocal support of ASIC but also announce how they will use their powers to support ASIC, such as, for example in the case of APRA, additional operational risk capital charges for misconduct.

The curtain is about to go up on the second act of the BBSW tragedy (or is it farce), and we await the entry of the villain(s) with keen expectancy. But will the show close on its first night, with no prospect of a revival?

Author: Pat McConnell, Honorary Fellow, Macquarie University Applied Finance Centre, Macquarie University

What Is Behind the Weakness in Global Investment?

A newly released Bank of Canada Staff Discussion Paper explores why the recovery in private business investment globally remains extremely weak more than seven years after the financial crisis.

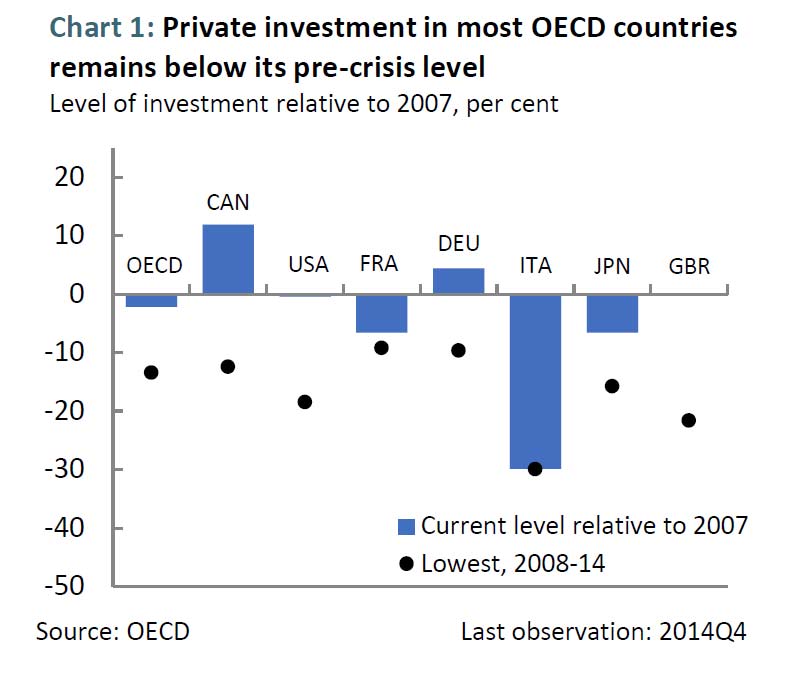
The global financial crisis resulted in a broad-based collapse of business investment, with the level of investment falling well over 10 per cent in most member countries of the Organisation for Economic Co-operation and Development (OECD).

Investment---CanadaAn uneven recovery followed, led by oil-exporting regions, which benefited from a rebound in energy prices. The post-crisis recovery in business investment has been underwhelming. Annual investment growth in OECD countries averaged a mere 2.2 per cent between 2010 and 2014, compared to around 3.5 per cent in the decade leading up to the financial crisis.

The bulk of this weakness was unexpected, and has resulted in investment consistently underperforming relative to forecasts of both public and private forecasters. Over the past few years, several institutions, including the OECD, the International Monetary Fund (IMF), the Bank for International Settlements and the Banque de France, have investigated this “investment puzzle” to identify some of the factors that standard models might fail to capture.

This paper contributes to the ongoing policy debate on the factors behind this weakness by analyzing the role of growth prospects and uncertainty in explaining developments in non-residential private business investment in large advanced economies since the crisis. Augmenting the traditional models of investment with measures of growth expectations for output and uncertainty about global demand improves considerably the ability to explain investment growth.

Our results suggest that the main driver behind the weakness in global investment in recent years is primarily a pessimistic outlook on the part of firms regarding the strength of future demand. Lower levels of uncertainty have supported investment growth modestly over 2013–14. Similarly, diminishing credit constraints, lower borrowing costs and relatively stronger corporate profits have also supported the recovery in business investment from 2010 onward.

Our findings have two important implications for the global outlook for investment. First, the expected improvements in global growth should support a recovery in investment; however, a slowdown in growth in emerging-market economies or further growth disappointment in advanced economies could restrain this recovery. Second, the ongoing recovery in investment remains vulnerable to uncertainty shocks.

Note: Bank of Canada staff discussion papers are completed staff research studies on a wide variety of subjects relevant to central bank policy, produced independently from the Bank’s Governing Council. This research may support or challenge prevailing policy orthodoxy. Therefore, the views expressed in this paper are solely those of the authors and may differ from official Bank of Canada views. No responsibility for them should be attributed to the Bank.

Federal Reserve Board announced a $131m penalty against HSBC North America

The Federal Reserve Board on Friday announced a $131 million penalty against HSBC North America Holdings, Inc. and HSBC Finance Corporation for deficiencies in residential mortgage loan servicing and foreclosure processing. The penalty is being assessed in conjunction with an agreement involving similar deficiencies that HSBC announced Friday with the U.S. Department of Justice, other federal agencies, and the state attorneys general.

The penalty assessed by the Board is the maximum amount allowed under the law, taking into account the circumstances of HSBC’s unsafe and unsound practices and foreclosure activities. The penalty may be satisfied by providing borrower assistance or remediation in conjunction with the Department of Justice settlement, or by providing funding for nonprofit housing counseling organizations. If HSBC does not satisfy the full penalty amount within two years, the remaining amount must be paid to the U.S. Department of Treasury. The Board will closely monitor compliance by HSBC with the requirements of the order.

The terms of the monetary assessment against HSBC are similar to those that were part of the penalties issued by the Board in February 2012 and July 2014 against six other mortgage servicing organizations that reached similar agreements with the U.S. Department of Justice and the state attorneys general.

The Board previously issued an enforcement action in April 2011 requiring HSBC to correct its servicing and foreclosure-related deficiencies. That action was among 14 corrective actions issued against Board-supervised mortgage servicers or their parent holding companies for unsafe and unsound practices in residential mortgage loan servicing and foreclosure processing.

General guide to account opening updated

The Basel Committee on Banking Supervision has revised the General guide to account opening, first published in 2003.

The Basel Committee issues this guide as an annex to the guidelines on the Sound management of risks related to money laundering and financing of terrorism, which was first published in January 2014. These guidelines revised, updated and merged two previous publications of the Basel Committee, issued in 2001 and 2004.

Most bank-customer relationships start with an account-opening procedure. The customer information collected and verified at this stage is crucial to the bank in order for it to fulfil its AML/CFT obligations, both at the inception of the customer relationship and thereafter, but it is also useful in protecting it against potential abuses, such as fraud or identity theft. The policies and procedures for account opening that all banks need to establish must reflect AML/CFT obligations.

The revised version of the General guide to account opening and customer identification takes into account the significant enhancements to the Financial Action Task Force (FATF) Recommendations and related guidance. In particular, it builds on the FATF Recommendations, as well as on two supplementary FATF publications specifically relevant for this guide: Guidance for a risk-based approach: The banking sector and Transparency and beneficial ownership, both issued in October 2014.

As for the remainder of the guidelines, the content of the proposed guide is in no way intended to strengthen, weaken or otherwise modify the FATF standards. Rather, it aims to support banks in implementing the FATF standards and guidance, which requires the adoption of specific policies and procedures, in particular on account opening.

A consultative version was issued in July 2015. The Basel Committee wishes to thank all those who took the trouble to express their views during the consultation process.

Revised Model-Based Market Risk Rules Costly for Banks – Fitch

The overhaul of the internal models approach – used by most banks with large trading books to calculate market risk capital requirements – will be costly, says Fitch Ratings. The Basel Committee on Banking Supervision’s revised market risk framework, published in January and effective from 2019, fundamentally changes the approach.

The model revisions should improve risk assessment capabilities, lead to higher capital charges for hard-to-model trading positions and make it easier to compare banks’ results. But the model approval process and governance are being thoroughly revised and implementing the changes will require considerable investment in technology and risk management.

Banks will need to obtain approval for internal models desk by desk, rather than bank-wide. This will make it easier for supervisors to decline approval for a particular trading desk, if, for example, the desk is unable to satisfy model validation criteria due to back-testing failures or an inability to properly attribute profits and losses across products. But Fitch thinks costs associated with building and running the more sophisticated models will be high.

Instead of running a single bank-wide model for a range of stressed and unstressed risk factors, multiple new models will need to be built, validated and run daily. This will multiply the number of model reviews and operational runs and add to subsequent data analysis and reporting procedures. Additional risk personnel will be required for review, oversight, and reporting purposes.

The amount of regulatory capital models-based banks will need to cover potential market risks following the revisions is uncertain. The Basel Committee’s latest studies show that, for a sample of 12 internationally active banks with large trading books, all of which provided high-quality data, market risk capital charges under the revised approach were 28% higher. But for a broader sample of 44 banks using internal models, the median market risk capital requirements fell by 3% under the revised models.

Fitch thinks the result for the 12 banks could reflect greater concentrations of less liquid credit positions that require more capital, or larger trading positions lacking observable transaction prices, which are subject to a stressed capital add-on. Banks facing higher charges under the regime may re-assess whether certain activities remain profitable.

The new internal models approach replaces value at risk (VaR) with an expected shortfall (ES) measure. VaR does not capture the tail risk of loss distribution, which can arise during significant market stress. The use of ES models for regulatory capital is positive for bank creditors because they could lead to better capitalisation of tail-risk loss events and might motivate risk managers to limit trading portfolios that could lead to outsized losses.

When calculating ES measures, banks will have to use variable market liquidity horizons – to a maximum of 120 days for complex credit products, against the current fixed 10-day period. We think model inputs will be more realistic, by acknowledging that some instruments take longer to sell or hedge without affecting prices. ES will also constrain recognition of diversification and hedging benefits, extensively used in VaR models to reduce capital charges. We think this will make model outputs more prudent and force banks to better capitalise potential trading losses.

Structural flaws in the way banks calculated capital charges for market risk were exposed during severe market stresses in 2008-2009. The Basel Committee subsequently undertook a fundamental review of the trading book. The original proposals were watered down, but we think the final revised minimum capital standards for model-driven market risk are positive for creditors because improved model standards and more prudent methods employed to capture risk should mean trading risks are more accurately capitalised.

RBA’s Latest Statement Raises Two Interesting Questions

The latest Statement of Monetary Policy, released today, continues to tell the now well rehearsed story. Resources down, China under pressure, local growth slowish, and transitioning from mining, sort of working, whilst home lending continues to grow at above 7% annually. But they kick around two interesting issues. First, why is the unemployment rate so good when growth is sluggish, and second why is the household savings ratio lower now?

Looking at employment first:

…strong employment growth has also been supported by a protracted period of low wage growth which, along with the exchange rate depreciation, may have encouraged firms to employ more people than otherwise. At the same time, growth in the supply of labour has increased through a rise in the participation rate, notwithstanding lower population growth. The unemployment rate declined to around 5¾ per cent in late 2015, having been within a range between 6 and 6¼ per cent since mid 2014. Nevertheless, there is evidence of spare capacity in the labour market, as the unemployment rate is still above recent lows, the participation rate remains below its previous peak and wage growth continues to be low.

Also, the low growth of wages is likely to have encouraged businesses to employ more people than otherwise. Measures of job vacancies and advertisements point to further growth in employment over the coming months. In response to this flow of data, the forecast for the unemployment rate has been revised lower. The fact that the improvement in labour market conditions has occurred against the backdrop of below-average GDP growth raises some uncertainty about the economic outlook. It is possible that the strength in the labour market data contains information about the economy not apparent in the national accounts data, or that the strong growth in employment of late will be followed by a period of weaker employment growth. Alternatively, the strength in labour market conditions relative to output growth may reflect a rebalancing of the pattern of growth towards labour intensive sectors and away from capital intensive sectors.

DFA is of the view that the growth in lower-paid non-wealth producing jobs at the expense of productive jobs is the key – more are now working in the healthcare and services sector (in response to growing demand thanks to demographic shifts), but it just moves the dollar around the system, and does not create new dollars. There is difference between being busy, and being productively (economically speaking) busy.

Turning to the savings ratio:

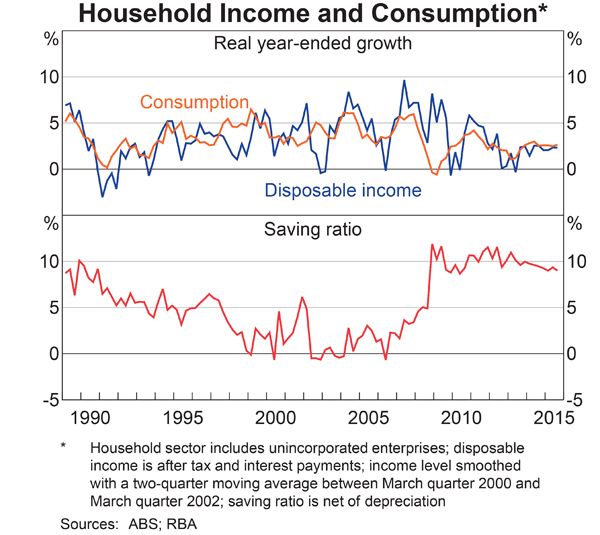
… after falling for more than two decades, the aggregate household saving ratio in Australia increased sharply in the latter half of the 2000s. While it has since remained close to 10 per cent – which implies that, collectively, households have been saving about 10 per cent of their incomes – the saving ratio has declined modestly over the past three years or so.

5tr-hhinconJan2016Understanding developments in the saving ratio is important because changes in household saving behaviour can have implications for the outlook for aggregate consumption. Trends in the household saving ratio in Australia over recent years are likely to reflect a range of factors, including the effect of the boom in commodity prices and mining investment on household incomes, behavioural changes stemming from the global financial crisis, and the current low level of interest rates. Longer-term factors such as financial deregulation and population ageing have also played a role. Households’ expectations about future income growth and asset valuations, and the uncertainty around those expectations, are also relevant to their saving decisions. Many households accumulate precautionary savings to insure against an unanticipated loss of future income or unexpected expenditure (such as on a medical procedure). At the macroeconomic level, precautionary saving is likely to be particularly important if households are very risk averse or constrained in their ability to borrow to fund consumption when their incomes are temporarily low. For example, the financial crisis is likely to have made households more uncertain about their future employment or income growth and/or led them to reassess their tolerance for risk, which would have encouraged them to increase their rate of saving. Surveys at that time showed an increase in the share of households nominating bank deposits or paying down debt as the ‘wisest place for saving’, although this may have also reflected lower expected rates of return on other financial assets following the financial crisis.

The level of interest rates can also influence the saving ratio. On the one hand, the current low level of interest rates reduces both the return to saving and the cost of borrowing, which encourages households to bring forward consumption; this might explain some of the recent decline in the aggregate household saving ratio. Low interest rates also support the value of household assets, which increases the amount of collateral households can borrow against, and potentially reduces the incentives for households to save. On the other hand, the household sector in aggregate holds more debt than interest-earning assets, so cyclically low interest rates provide a temporary boost to disposable income through a reduction in net interest payments, some of which may be saved. Households also need to save more to achieve a given target level of savings when interest rates are low.

Structural changes to the Australian financial system have been important longer-term drivers of changes in household saving behaviour. Financial deregulation in the 1980s and a structural shift to low inflation and low interest rates in the 1990s allowed households that were previously credit constrained to accumulate higher levels of debt for a given level of income. This rise in indebtedness was accompanied by strong growth in housing prices and a reduction in the household saving ratio to unusually low levels. In this way households were able to support consumption via the withdrawal of housing equity.  Innovation in financial products – such as credit cards and home-equity loans – also gave households much better access to finance. The adjustment to these structural changes in the financial system appears to have largely run its course by the mid 2000s.

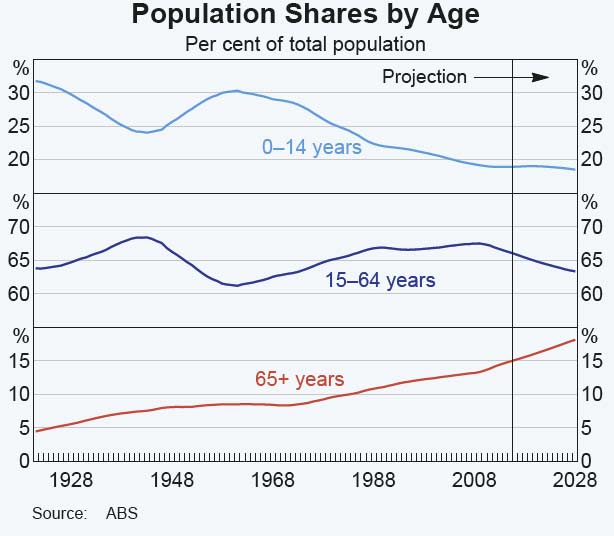
The ageing of the population is another longer-term influence on the saving ratio. If shares of younger and older households in the population were constant over time, the different saving behaviours of these households would not affect the aggregate saving ratio. However, Australia’s baby-boomer generation is a larger share of the population now and has been entering the retirement phase since around 2010. Because households save less in their later years, this is expected to have a gradual but long-lasting downward influence on the aggregate household saving ratio. However, a potentially offsetting influence is rising longevity, which may lead households to save more during their working years to finance a longer period of retirement.

Pop-By-AGe-BandsThe amount that each of these drivers have contributed to recent trends in the aggregate household saving ratio is unclear. It is also uncertain how they will evolve over the next few years, although the Bank’s central forecast embodies a further modest decline in the saving ratio, that reflects, in part, the unwinding of the impact on saving from the earlier boom in commodity prices and mining investment.

Using data from the DFA household surveys, we note three factors in play. First, household confidence levels still below long term trends, so we would expect households to continue to save, if they can, against perceived future risks. Second, older households hold the bulk of the savings, and they are indeed growing as a proportion of the total, so again we would expect to see a rise, not a fall in the ratio. But, the third factor, is in our view, the most significant.  That is that many are relying on income from savings, and as deposit interest rates have fallen (and alternative investment options become more risky), some have switched savings into investment property and others are having to eat into capital to survive.  The RBA’s policy settings of low interest rates, and high house prices are being reflected back in lower savings ratios.

DFA Comments On Keen Mortgage Pricing, For Some

DFA contributed to a piece on ABC RN Breakfast which discussed the deep discounting currently available for selected mortgage borrowers, reflecting heightened competition, more difficult funding and changes in demand. You can listen to the segment, which also included Sally Tindall, Money Editor, RateCity and Alan Oster, Chief Economist, National Australia Bank. The reporter was Sheryle Bagwell, Business Editor.