IMF Report On Australia Shows Work Is Needed

The IMF released their latest review of Australia. They expect growth to remain under trend to 2.8% in 2020, house prices to remain high along with household debt, household savings to fall, and the cash rate to fall before rising later. Mining investment will continue to fall, and non mining investment to rise, with a slow fall in unemployment to 5.5% by 2020. They supported the FSI recommendations for banks to hold more capital. They cautioned that if investor lending and house price inflation do not slow appreciably, these policies may need to be intensified.

On September 14, the Executive Board of the International Monetary Fund (IMF) concluded the 2015 Article IV consultation1 with Australia.

Australia has enjoyed exceptionally strong income growth for the past two decades, supported by the boom in global demand for Australia’s natural resources and strong policy frameworks. However, the economy is now facing a large transition as the mining investment boom winds down and the terms of trade has fallen back. Growth has been below trend for two years. Annualized GDP growth was around 2.2 percent in the first half of 2015, with particularly weak final domestic demand, and declining public and private investment. Capacity utilization and a soft labor market point to a sizeable output gap. Nominal wage growth is weak, contributing to low inflation.

The terms of trade has fallen sharply over the past year. Iron ore prices have fallen by more than a third and Australia’s commodities prices are down by around a quarter since mid-2014. The exchange rate has depreciated further in recent months following news about economic and financial market developments in China. This has significantly reduced the likely degree of exchange rate overvaluation and should help support activity. Although the current account deficit narrowed to 2.8 percent of GDP in 2014 as mining-related imports declined, it is expected to widen somewhat in 2015.

With subdued inflation pressure, and a weaker outlook, the Reserve Bank of Australia (RBA) cut its policy rate by a further 50bps in the first half of 2015 to 2 percent. While housing investment has picked up strongly, consumer confidence indicators and investment expectations remain muted. Consumption growth has also been moderate reflecting weak income growth. But low interest rates have pushed up asset prices. Overall house price inflation is close to 10 percent, but is around 18 percent in Sydney. Buoyant housing investor lending has recently prompted regulatory action to reinforce sound residential mortgage lending practices.

Fiscal consolidation has become more difficult and public debt is rising, albeit from a low level. Lower export prices and weak wage growth are denting nominal tax revenues; unemployment is adding to expenditures. The national fiscal deficit remained at 3 percent in fiscal year

(FY, July–June) 2014/15, broadly unchanged from the previous year. The FY 2015/16 Budget projects a return to surplus in 2019–20. The combination of tightening by the States and the commonwealth implies an improvement in the national cyclically-adjusted balance by some 0.7 of a percent of GDP on average over the next three years.

Executive Board Assessment

Executive Directors commended Australia’s strong economic performance over the past two decades, which has been underpinned by sound policies, the flexible exchange rate regime, earlier structural reforms, and a boom in the global demand for resources. They noted, however, that declining investment in mining and a sharp fall in the terms of trade are posing macroeconomic challenges, while potential growth is likely to slow in the period ahead. Accordingly, Directors agreed that continued efforts to support aggregate demand and raise productivity will be critical in transitioning to a broader-based and high growth path.

Directors noted that a supportive policy mix is needed to facilitate the structural changes underway. With a still sizeable output gap and subdued inflation, most Directors agreed that monetary policy is appropriately accommodative and could be eased further if the cyclical rebound disappoints, provided financial risks remain contained. Directors also noted that the floating exchange rate provides an important buffer for the economy.

Directors broadly agreed that a small surplus should remain a longer-term anchor of fiscal policy. In this regard, many Directors supported the authorities’ planned pace of adjustment, which they viewed as striking the right balance between supporting near-term activity and addressing longer-term spending commitments. Some Directors, however, considered that consolidation could be somewhat less frontloaded, given ample fiscal space. Directors broadly concurred that boosting public investment would support demand, take pressure off monetary policy, and insure against downside risks. In this context, they welcomed the authorities’ continuing to establish a pipeline of high-quality projects.

Directors highlighted that maintaining income growth at past rates and boosting potential growth would require higher productivity growth. They expressed confidence that this could be achieved, given Australia’s strong institutions, flexible economy, track record of undertaking comprehensive structural reforms, and the opportunities created by Asia’s rapid growth. Nonetheless, further reforms in a variety of areas will be required. In this regard, Directors noted the findings of the Competition Policy Review and looked forward to their implementation. Furthermore, addressing infrastructure needs will relieve bottlenecks and housing supply constraints. Directors also encouraged a shift toward more efficient taxes, while ensuring fairness.

Directors supported the recommendations of the Financial System Inquiry. They noted that while banks are sound and profitable, significantly higher capital would be needed in a severe adverse scenario to ensure a fully-functioning system. Accordingly, they welcomed the authorities’ commitment to make banks’ capital “unquestionably strong” over time. To address risks in the housing market, Directors supported targeted action by the regulator. They cautioned that if investor lending and house price inflation do not slow appreciably, these policies may need to be intensified.
Almost 1 in 10 loans would fail underwriting standards: report

From MortgageBusiness.

A new report examining the impact of regulatory changes on the Australian mortgage market has concluded that nine per cent of home loans written so far this year would now fail current underwriting standards.

Released this week, The Property Imperative Report V report from Digital Finance Analytics (DFA), applied the typical underwriting criteria being used today to the 26,000 households surveyed in the DFA Household Finance Confidence index.

The modelling assumed that, as a result of regulatory changes, all mortgages written today will be assessed on a serviceability hurdle rate of 7.5 per cent, interest-only loans require a repayments path, and real spending must be used rather than a standard ratio.

“Given the tighter criteria in play now, we were not surprised to discover that some loans would now not be approved without an override – meaning they were outside current norms,” DFA principal Martin North said.

“Overall about four per cent of loans in the national portfolio would now fail underwriting standards and two-thirds were for investment purposes,” Mr North said.

The report found that the majority of loans fell in the $500,000 to 750,000 range, predominately in NSW (six per cent) and Victoria. The loans were most likely to have been written in 2014 or 2015.

“Nine per cent of loans written so far this year would now fail current underwriting standards,” Mr North said.

“We expect underwriting criteria to continue to tighten, so more loans will fall outside current underwriting standards, representing some potential downstream portfolio risks.”

The report also found that there is almost no difference now between an interest-only loan and a principal- and-interest repayment loan.

“This is a significant change, highlighting the fact that the previous affordability benefit for an interest-only proposition has dissipated,” Mr North said.

The DFA report examined banks, non-banks and the mutual sector.


What Does The Latest Credit Data Really Tell Us?

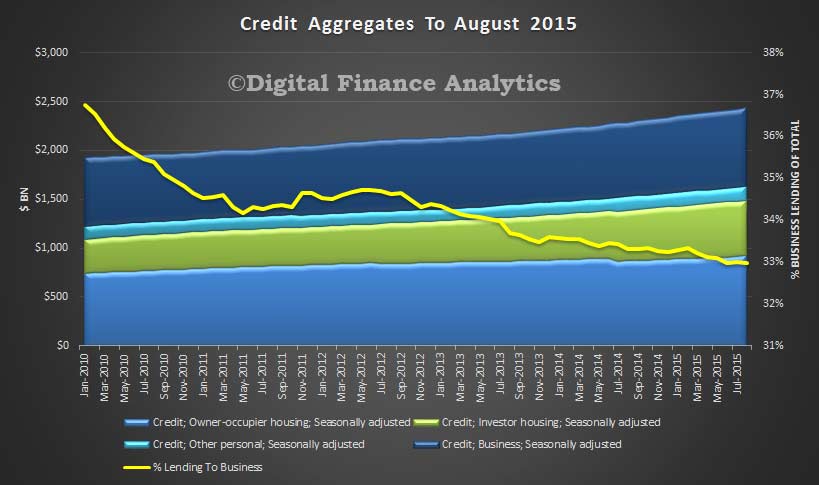
Today we got the RBA Credit Aggregates and APRA Monthly Banking Statistics to August 2015.  Whilst the overall trends may superficially appear clear, actually, they are are clouded in uncertainty, thanks to significant reclassification between owner occupied and investment loans. As a result, any statement about “investment loans slowing” may be misleading. Total housing lending rose 0.63% seasonally adjusted to a new record of $1.49 trillion, of which $1.38 trillion sits with the banks, the rest is from the non-bank sector.

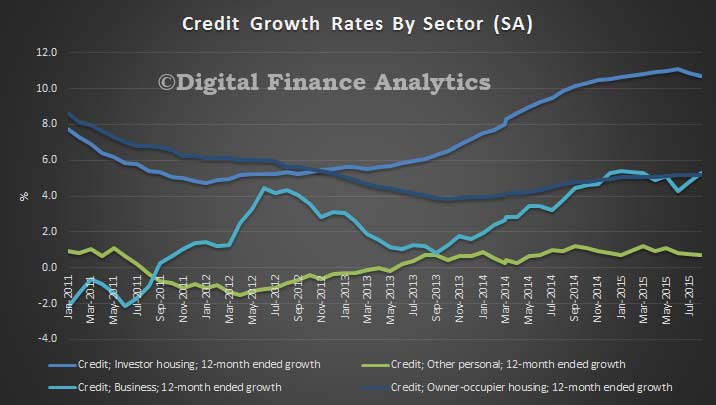
Starting with the RBA data (table D1),  overall housing growth for the month was 0.6%, and 7.5% for the 12 months (both seasonally adjusted). Owner occupied lending grew by 0.6% in the month, and 5.6% for the 12 months, whilst investment lending grew 0.7% for the month, and 10.7% for the year – still above the APRA speed limit. The chart below show the 12 month movements. It also shows business lending at 0.5% in the month, and 5.3% in the 12 months, and personal credit 0.1% in the month and 0.7% in the 12 months. It is fair to say from these aggregates that investment lending fell a little, and we think it is likely to continue to fall as lending criteria are tightened, but there is still momentum, and as we showed in our surveys demand, though tempered by tighter lending criteria.

RBA-Aggregates-Credit-Growth-PC-August-2015However, and this is where it starts to get confusing, the RBA says “Growth rates for owner-occupier and investor housing credit reported in RBA Statistical Table D1 have been adjusted to take into account the fact that the purpose of a large number of loans was reported to have changed in August, mainly from investment to owner-occupation. Similar adjustments are likely to be required in coming months. However, the stocks of owner-occupier and investor housing credit reported in RBA Statistical Table D2 have not been adjusted. The total stock of housing credit and its rate of growth are unaffected by this change.”

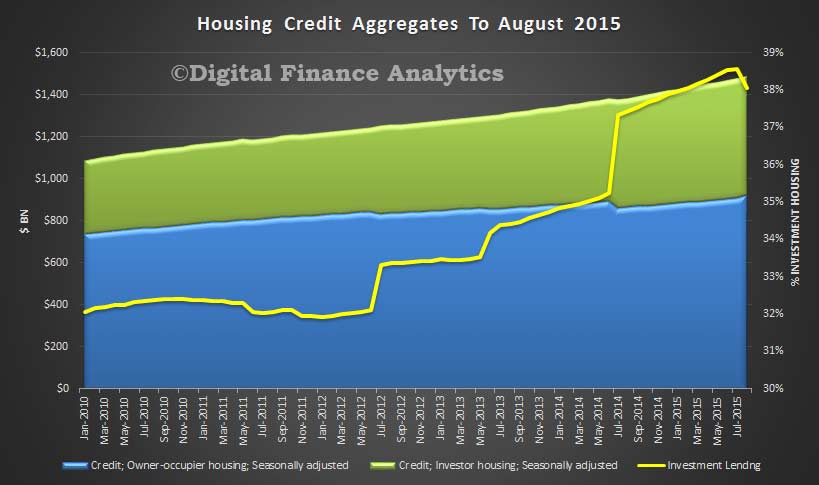
So, the data in D2 shows a significant fall in the stock of investment loans, and because of the adjustments not being made to these numbers (RBA please explain why you are using two different basis for the data) we need to be careful. On these numbers, owner occupied loans rise 1.5% in the month and investment lending fell 0.7%. The 12 month movements would be for owner occupied loans 6% and investment loans 8.3%.

RBA-Housing-Credit-Aggregates-Aug-2015What we can see is that the proportion of lending to business is still at a very low 33%, and this highlights that the banks are still focusing on home lending, with an intense competitive focus on the owner occupied refinance sector, and much work behind the scenes to push as much lending into the owner occupied bucket as possible. Remember that some banks had previously identified loans which should have been in the investment category, so more than 3% of loans were switched, lifting the proportion of investment loans above 38%.

RBA-Credit-Aggregates-Aug-2015The APRA credit aggregates which focus on the ADI’s shows that the stock of home loans was $1.378 trillion, up from $1.367 trillion in July, or 0.8%. Within that, investment loans fell from $539.5 bn to $535.5 bn, down 0.7%, whilst owner occupied loans rose from $827 bn to $843 bn, up 1.9%, thanks to the ongoing reclassification.  Looking at the movements by banks, the average market movement for investment loans over 12 months (and using the APRA monthly movements as a baseline) was 9.92%, just below the speed limit, and we see some of the major banks below the speed limit now, whilst other lenders remain above. These numbers have become so volatile however, that the regulators really do not know what the true score is, and the banks have proved their ability to recast their data in a more favorable light.

APRA-Investment-Loans-By-Lender-August-2015It is unlikely the “fog of war” will abate any time soon, so we caution that the numbers being generated by the regulators need to be handled carefully.

We will be looking at the individual portfolio movements as reported by APRA in a later post. We like a challenge!

Lending to tighten as banks look to avoid mortgage risk

From Mortgage Professional Australia.

Lending to tighten as banks look to avoid mortgage risk​
Specific postcodes or suburbs won’t be denied home loans, but one financial analyst believes Australia’s big banks are moving to a path of more restrictive lending.

Martin North, the principal of Digital Finance Analytics, believes major lenders will soon be introducing different lending criteria and stricter servicing requirements as they look to reduce the amount of risk they carry on their mortgage books.

“I think what we’re seeing is a general drift towards the end of the more sporty loans we were seeing, the dial has been turned up in terms of the capital requirements banks are facing and the risk dial has been turned up as APRA says these are the things we want to see happen,” North said.

“We’re not going to see ghettos were you can’t get a loan, but LVRs are going to be dialled back, it’s going to be harder to get interest only loans and there could be changes to terms and conditions so we see things such as risk premiums on loans for certain areas,” he said.

North’s comments come after Fairfax media revealed earlier this week that NAB has two groups totalling more than 80 Australian postcodes identified as either being “areas where significant deterioration in credit risk has been observed” (Group A postcodes) or “areas which are exhibiting characteristics which may indicate future deterioration in credit risk” (Group B postcodes).

There are 40 Group A postcodes, which are predominantly located in areas affected by the downturn in the resource and manufacturing industries, with 22 Western Australian and 11 Queensland postcodes in the group.

The remaining seven postcodes are found in South Australia, Northern Territory and Tasmania. The Group A postcodes are now subject to a 70% LVR.

The bank has classified 43 postcodes in Group B, with 34 of them located in Sydney, while five are found in Melbourne and suburbs in this group are now subject to an LVR of 80%.

According to North, the identified postcodes present risks due to a number of different reasons.

“The first reason is the probability of default, which is tied to economic and employment conditions, and would apply to places in Western Australia or Queensland where the mining boom has deteriorated or areas like South Australia where the manufacturing industry has been hit,” he said.

“There are also concentration risks where you have a location that has been popular and a bank has a lot of people in that area with loans and they’ll then look to throttle back on lending to there.

“The final one is overvaluation, where a bank thinks the value of properties in the area are extended and they’re concerned that in a corrective market they’ll be worth less than what the loan. These are usually areas that have seen rapid growth and an area like inner Sydney would be a good example of that.”

While banks such as NAB may be introducing measures to reduce the level of risk they take on in the future, North said the current risk position of their mortgage portfolios may not yet truly be known.

“If you look back at the loans that were written over the last 12 – 18 months when lenders were being more aggressive, then I would estimate that about 8 – 9% wouldn’t meet today’s lending criteria.

“There’s some implicit risk there and most mortgage trouble start in the first two or three years, so in the near future we’ll see whether that leads to an increase in defaults.”

ING DIRECT Increases Rates for Property Investors

ING Direct has announced they are increasing variable rates on existing investment property loans by 0.37%pa effective 5 November 2015. They had previously tightened investment loan criteria.

Existing customers who hold both owner-occupied and residential investment loans with ING Direct will not be subject to this interest rate change.

The current rates for new investment property borrowers remain unchanged.  ING Direct Orange Advantage is priced at 4.84%pa (5.03%pa comparison rate) for investors.

The bank has $38 billion in mortgages on book, of which about one third are investment loans, according to recent APRA data.

Fed Still Expecting To Lift Rates

In a wide-ranging speech, at the Philip Gamble Memorial Lecture, Fed Chair Yellen discussed inflation in the US and monetary policy. The net summary is that the more prudent strategy is to begin tightening in a timely fashion and at a gradual pace, adjusting policy as needed in light of incoming data.

Consistent with the inflation framework I have outlined, the medians of the projections provided by FOMC participants at our recent meeting show inflation gradually moving back to 2 percent, accompanied by a temporary decline in unemployment slightly below the median estimate of the rate expected to prevail in the longer run. These projections embody two key judgments regarding the projected relationship between real activity and interest rates. First, the real federal funds rate is currently somewhat below the level that would be consistent with real GDP expanding in line with potential, which implies that the unemployment rate is likely to continue to fall in the absence of some tightening. Second, participants implicitly expect that the various headwinds to economic growth that I mentioned earlier will continue to fade, thereby boosting the economy’s underlying strength. Combined, these two judgments imply that the real interest rate consistent with achieving and then maintaining full employment in the medium run should rise gradually over time. This expectation, coupled with inherent lags in the response of real activity and inflation to changes in monetary policy, are the key reasons that most of my colleagues and I anticipate that it will likely be appropriate to raise the target range for the federal funds rate sometime later this year and to continue boosting short-term rates at a gradual pace thereafter as the labor market improves further and inflation moves back to our 2 percent objective.

By itself, the precise timing of the first increase in our target for the federal funds rate should have only minor implications for financial conditions and the general economy. What matters for overall financial conditions is the entire trajectory of short-term interest rates that is anticipated by markets and the public. As I noted, most of my colleagues and I anticipate that economic conditions are likely to warrant raising short-term interest rates at a quite gradual pace over the next few years. It’s important to emphasize, however, that both the timing of the first rate increase and any subsequent adjustments to our federal funds rate target will depend on how developments in the economy influence the Committee’s outlook for progress toward maximum employment and 2 percent inflation.

The economic outlook, of course, is highly uncertain and it is conceivable, for example, that inflation could remain appreciably below our 2 percent target despite the apparent anchoring of inflation expectations. Here, Japan’s recent history may be instructive, survey measures of longer-term expected inflation in that country remained positive and stable even as that country experienced many years of persistent, mild deflation. The explanation for the persistent divergence between actual and expected inflation in Japan is not clear, but I believe that it illustrates a problem faced by all central banks: Economists’ understanding of the dynamics of inflation is far from perfect. Reflecting that limited understanding, the predictions of our models often err, sometimes significantly so. Accordingly, inflation may rise more slowly or rapidly than the Committee currently anticipates; should such a development occur, we would need to adjust the stance of policy in response.

Considerable uncertainties also surround the outlook for economic activity. For example, we cannot be certain about the pace at which the headwinds still restraining the domestic economy will continue to fade. Moreover, net exports have served as a significant drag on growth over the past year and recent global economic and financial developments highlight the risk that a slowdown in foreign growth might restrain U.S. economic activity somewhat further. The Committee is monitoring developments abroad, but we do not currently anticipate that the effects of these recent developments on the U.S. economy will prove to be large enough to have a significant effect on the path for policy. That said, in response to surprises affecting the outlook for economic activity, as with those affecting inflation, the FOMC would need to adjust the stance of policy so that our actions remain consistent with inflation returning to our 2 percent objective over the medium term in the context of maximum employment.

Given the highly uncertain nature of the outlook, one might ask: Why not hold off raising the federal funds rate until the economy has reached full employment and inflation is actually back at 2 percent? The difficulty with this strategy is that monetary policy affects real activity and inflation with a substantial lag. If the FOMC were to delay the start of the policy normalization process for too long, we would likely end up having to tighten policy relatively abruptly to keep the economy from significantly overshooting both of our goals. Such an abrupt tightening would risk disrupting financial markets and perhaps even inadvertently push the economy into recession. In addition, continuing to hold short-term interest rates near zero well after real activity has returned to normal and headwinds have faded could encourage excessive leverage and other forms of inappropriate risk-taking that might undermine financial stability. For these reasons, the more prudent strategy is to begin tightening in a timely fashion and at a gradual pace, adjusting policy as needed in light of incoming data.

Fixing the global financial safety net: lessons from central banking

In a speech to the David Hume Institute in Edinburgh, Minouche Shafik, Bank of England Deputy Governor for Markets and Banking, describes the global safety net for dealing with sovereign debt crises as “more of a patchwork than a safety net.” The need to fix the safety net has been brought into sharper focus by the challenges facing emerging markets: lower growth, falling commodity prices and potential spillovers from the possible exit of exceptional monetary policy in advanced economies. Drawing on lessons from central banks’ response to banks’ liquidity needs during the financial crisis, she identifies policy reforms that could reduce the systemic implications of sovereign debt crises and allow nations to cope with shocks.

“The benefits of free trade are now well established. Similarly, economic theory provides compelling arguments for the potential advantages of integrated global capital markets based on the efficient allocation of resources. But, in practice, cross-border capital flows can be fickle and flighty, with destructive effects on the real economy.” They leave nations exposed to a ‘capital stop’, in much the same way that banks can experience a run on their deposits.

Minouche concludes that the current safety net – a mix of national foreign exchange reserves, regional financing arrangements, central bank swap lines and the International Monetary Fund (IMF) – is suboptimal: fragile, fragmented, and inefficient. If we are to continue to benefit from global financial integration then we need a system that can effectively and efficiently provide liquidity insurance to fundamentally sound sovereigns in order to contain spillovers to other parts of the globe.

Drawing on the experience of central banks, she notes that more reliable provision of liquidity support has been made possible by the fact that supervision is tougher on capital and liquidity requirements, banks undergo regular stress testing, and credible resolution tools are being put in place. What would the equivalent enablers be for sovereigns? Minouche suggests:

• Better surveillance, and particularly of the vulnerabilities to sudden stops;
• Stress testing countries’ balance sheets through better debt sustainability assessments; and
• Better mechanisms for dealing with debt restructuring and reducing the risk of disorderly spillovers.

Given the “complex and messy process whereby markets and the official sector deal with sovereign debt restructurings”, how might the risk of disorderly spillovers be reduced? Three preliminary ideas are suggested:

• Using state-contingent bonds to increase risk-sharing with private sector creditors, for example GDP-linked bonds.
• Facilitating agreements on a debt restructuring in bond contracts by expanding the use of new style collective action clauses so that decisions can be taken by a majority of creditors across all bond issuances, without the need for an issuance-by-issuance vote.
• Reducing international spillovers by reviewing the preferential treatment that cross-border sovereign exposures receive in prudential regulation.

At the heart of the global safety net, Minouche suggests, needs to be a more reliably resourced IMF that has well defined arrangements for collaborating with regional financing arrangements. Unless improvements are made, it will be difficult to achieve and sustain the benefits of integrated global capital markets.

Households Still Want Property, But Its Becoming More Challenging

Contained in the latest edition  of the Property Imperative, released today is an update on households and their attitude towards property. Over the next few days we will post some specific findings from the report. Today we look at aggregate demand.

To understand the current dynamics of the residential housing market we need to examine the behaviours of different household segments, because generic averaging across these diverse segments hides important differences. There are about 8.98 million households in Australia , and using analysis from the Australian Bureau of Statistics, and our own survey, we have segmented these households looking specifically at their property owning behaviour.

First we split the households into those which are property inactive, and those who are property active. Property inactive households were defined as those who currently rent, live with parents, or are homeless, with no plans to enter the market.

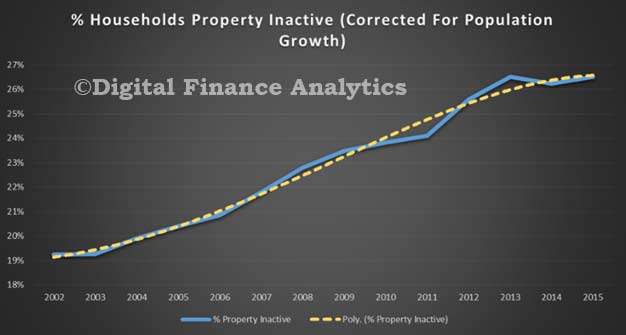
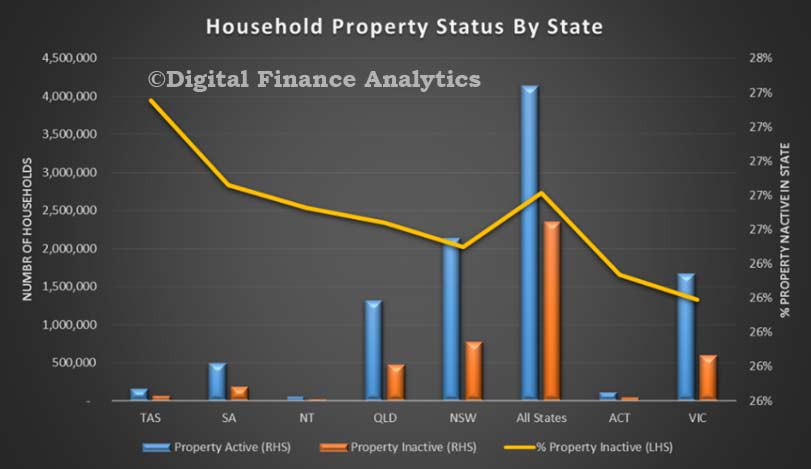
Property active households are those who own, or actively desire to own property, either as an owner occupier, or as an investor, and either own the property outright, have a mortgage or are actively looking. The analysis shows that about 26.1% percent of households are property inactive, which equates to about 2.35 million households. Examining past data, and applying the same analysis, we discovered that even correcting for population growth and migration, the property inactive proportion of the household population has been steadily increasing.

DFA-Sept-InactiveA similar fall in home ownership rates have been confirmed by others and it is suggested that the main reason for this trend is that house prices have simply grown faster than average incomes, thus making it harder to buy into the market.

DFA-Inactive-StatesThis signals an important underlying social issue, and is not being adequately addressed. Actually, we are seeing more households becoming tenants of the growing band of property investors, whilst many younger Australians are unable to buy for themselves, or are becoming property investors first. We note that in New Zealand, the Reserve Bank is consulting on changing the capital ratios for investment loans.

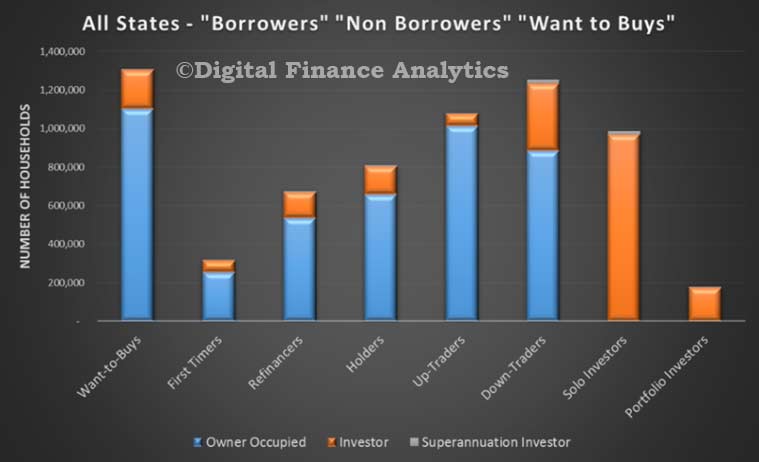
However, we will focus our attention on the property active household segments. To assist in our analysis we have segmented the property active segments by motivation and type. Below we outline our segments, and how they are defined.

  1. Want-to-Buys Household    s who want to buy a property, are saving, but have not yet committed
  2. First Timers Households who are buying, or have bought for the first time
  3. Refinancers Households who are restructuring their finances, but not moving house
  4. Holders Households with no plans to move or refinance
  5. Up-Traders Households looking to buy a larger place
  6. Down-Traders Households looking to buy a smaller place
  7. Solo Investors Households with a single investment property
  8. Portfolio Investors Households with a portfolio of investment property

In our survey, we also mapped these segments across owner occupied and investment property types. The chart below shows the current number of households by segment distribution, as at September 2015 .

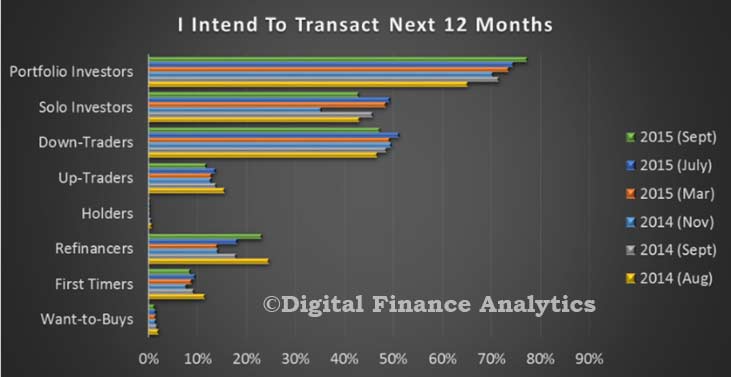
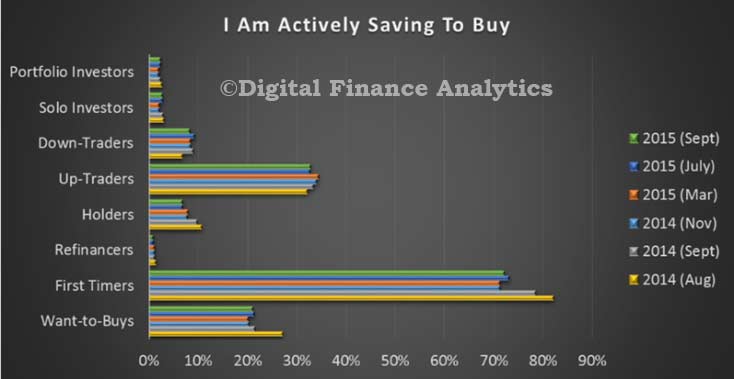
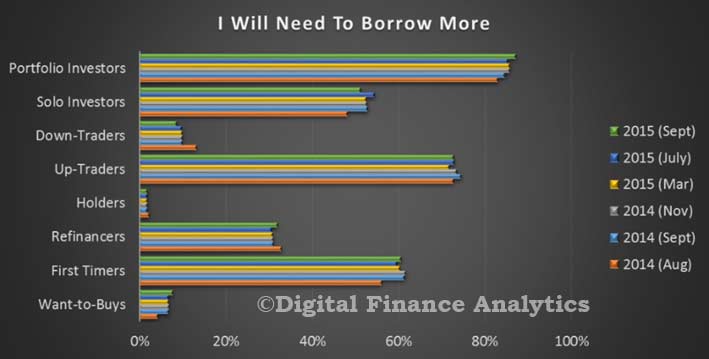
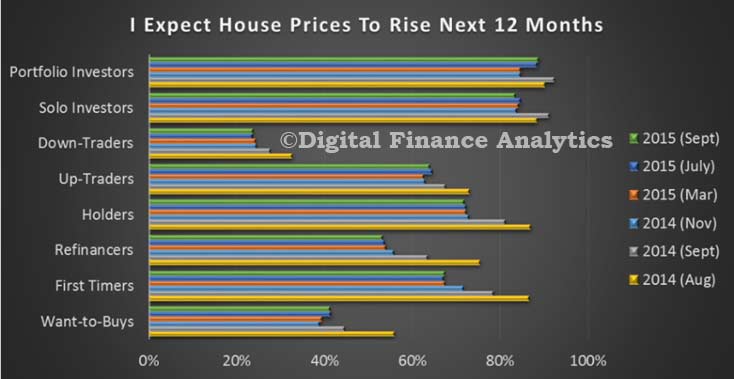
DFA-Sept-SegmentsIn our surveys, we looked across a number of dimensions, within the segments. This included whether they were actively saving to buy, intending to transact, borrowing needs and house price expectations. We will outline findings from each of these.
Portfolio Investors are more likely to transact in the next 12 months (over 77%), then solo investors (43%), then down traders (47%) and refinancers (23%). First time buyers (9%) and want to buys were least likely to transact (9%). Overall demand for property is still very strong, but headwinds are slowing momentum.

DFA-Sept-TransactThat said, first time buyers are saving the hardest (72%), although want to buys (21%) and up traders (32%) are also saving.

DFA-Sept-SavingTurning to borrowing expectations, portfolio investors are most likely to borrow more (87%), up traders (73%), first time buyers (60%) and sole investors (51%) are also in the market.

DFA-Sept-BorrowMost segments are bullish on house prices over the next 12 months, with down traders being the least excited (24%). Investors have the strongest view of potential future growth, whilst the trends across other segments suggests a weakening of expectation, at the margin.

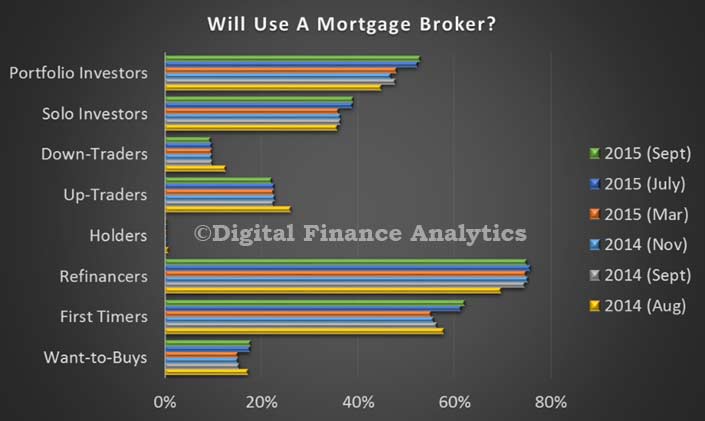
DFA-Sept-Huose-PricesSome segments are more likely to use a mortgage broker than others, with refinancers mostly likely to (75%), then first time buyers (55%) then investors (36%).

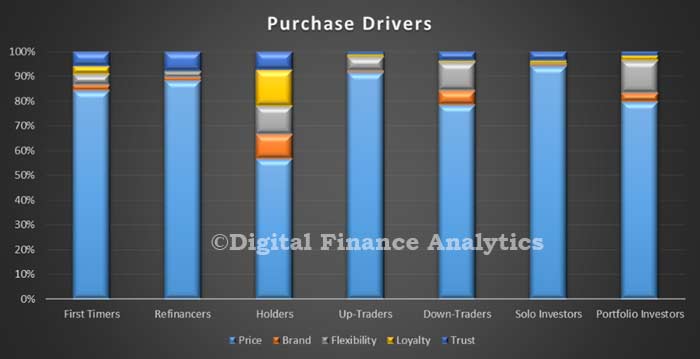
DFA-Sept-BrokerOne of the interesting aspects of the research is how consumers select a lender. More than ever, households do initial research online, using comparison sites, or social media before making a choice, either via a broker (who are doing well just now ), or direct with lenders. However these traditional business models are now at significant risk from digital disruption.  The key selection criteria is price, price and then price. Below is segmented data, showing the relative importance of price, brand, flexibility, loyalty and trust. Apart for holders, who are not in the market currently, on average 80% of purchasers will make their final decision on the price of the deal. Brand is largely irrelevant.

DFA-Sept-Purchase-DriversThe average new loan has grown again, to over $428,000 for a NSW non-first time buyer, according to the ABS data to July 2015 . The growth in loan size is running more slowly than house price growth (circa 13% in NSW), but significantly above average income growth.

About 10% of loans have a fixed rate (thanks to the current low RBA cash rate and expectation of lower rates to come).

The proportion of interest only loans written continues to grow, according to APRA data. The latest data to June 2015 indicates that more than 40% of new loans are interest only.

Next time we will look in more detail at some of the segment specific data.


Nab Offers Mortgage Via Brokers Frequent Flyer Point Incentive

In a sign of the highly competitive nature of home loans, NAB has announced a major frequent flyer offer for broker-introduced clients targetting owner occupied loans. Broker customers can apply between 21 September and 31 December 2015 for 250,000 NAB Velocity Frequent Flyer Points as an alternative to a $1500 cash back offer, provide they switch their main banking to NAB.

In the latest edition of the Property Imperative, released today we highlighted the intense focus on owner occupied loans as opposed to investment loans, and the various discounts and incentives on offer. The mortgage wars just stepped up another gear!

The Federal Reserve is losing credibility by not raising rates now

From The Conversation.

So the results are in: the Federal reserve decided to keep interest rates at around zero, delaying any increase in its target for at least six more weeks.

The move did not come as a surprise to Wall Street – which was betting 3-to-1 against the hike. But that’s not because investors didn’t think the US economy was ready for a rates “liftoff.” Rather, it shows that markets did not believe the Fed has the will and power to raise rates for the first time since June 2006.

Unfortunately, they guessed right.

The economy is ready if not eager for a liftoff and a return to a normal rates environment. Investors and businesses know this. It’s time the Fed recognized this too.

Ready for liftoff

The data clearly show that the US economy hasn’t looked stronger in a very long time – a sharp improvement from earlier this year when I wrote that it wasn’t ready for an increase in interest rates.

While the labor market may not have experienced strong growth in wages yet, joblessness has plunged to 5.1%, reaching what is known as the “natural rate” of unemployment (also called “full employment”). That’s significant because achieving maximum employment is one of the Fed’s two primary mandates, and anything below the natural rate risks fueling inflation.

And inflation, its other main policy goal, is also in range of its target of 2%. Indexes of consumer prices, both including and excluding volatile energy prices, and personal spending are forecast to be right in that sweet spot of 1.5% to 2% next quarter.

Furthermore, the US economy grew a stronger-than-forecast 3.7% in the second quarter, much better than the previous three-month period and signaling the recovery is on a pretty sound footing.

The output gap – or difference between what an economy is producing and what it is capable of – remains negative at about 3%, and deflation is still a threat.

But regardless of what the Fed does now and in coming months, its target short-term rate will remain well below the long-term “normal” level of about 4% for years to come, so there is little risk a small increase will drag down growth.

Why the Fed didn’t act

According to the Federal Open Market Committee statement, the main factors that persuaded the Fed to delay liftoff are the weakening global economy, “soft” net exports and subdued inflation.

Granted, developing economies, especially China and Russia, are indeed weak as are global financial markets and that could spill over into the US. And the devaluation of the yuan in China and the recession in Canada (the US’ two largest individual trading partners) – coupled with loose monetary policy in Europe – are causing the dollar to appreciate, making US exports decline and imports rise.

It is important to understand that all of these factors except inflation are outside the Fed’s jurisdiction and its dual mandate of maintaining full employment and stable prices. If these factors matter at all to US monetary policymakers, it should only be through their effects on the US economy, in terms of inflation, labor markets and GDP.

And while an appreciating dollar and low oil prices can indeed create deflationary pressures (and reduce US GDP), the data indicate that US prices nevertheless continue to rise, if slowly.

Furthermore, a higher interest rate and stronger dollar make US assets even more attractive to global investors, thus spurring more investment, while low oil prices stimulate consumer spending. Both of these factors boost economic activity and at least partially offset any decline due to lower net exports caused by a strong dollar.

What’s at stake

What’s more important is that the impact of a small rate hike has been with us for some time. Capital is already fleeing developing economies, and the dollar has been strong for a while. Hence, the direct marginal economic effects of a 0.25 percentage point increase in the target rate on the US economy would be negligible at best.

What was really at stake was repairing the Fed’s credibility in terms of successfully shaping US monetary policy and sending a powerful signal that the US economy is in strong shape.

Hoping to avoid previous bungled attempts to adjust monetary policy in recent years that led to significant market volatility, this time the Fed spent at least half of the year updating the language in its statements and gradually preparing the world for a hike. And since it did not deliver, this tells the world that the Fed is unable or unwilling to go against market expectations.

As a result, the central bank will have to either delay the liftoff until the next meeting, slowly reshaping market expectations to be consistent with a hike at that point, or risk a financial panic if it decides on an unexpected policy shift sooner. Delaying the timing further would mean losing precious time in normalizing monetary policy, necessary so that the Fed again has the tools it needs to fight future economic downturns. There’s also the increased risk that the economy will overheat and cause inflation to spiral out of control.

There is never a perfect time to start down this path; it is always possible to find reasons to delay. But each postponement requires even stronger data to justify an eventual liftoff the next time. The problem is that with the hesitant Fed sending mixed signals to the economy, that imaginary perfect day might not ever come.

Author: Alex Nikolsko-Rzhevskyy, Associate Professor of Economics, Lehigh University