
Today we got the RBA Credit Aggregates and APRA Monthly Banking Statistics to August 2015. Whilst the overall trends may superficially appear clear, actually, they are are clouded in uncertainty, thanks to significant reclassification between owner occupied and investment loans. As a result, any statement about “investment loans slowing” may be misleading. Total housing lending rose 0.63% seasonally adjusted to a new record of $1.49 trillion, of which $1.38 trillion sits with the banks, the rest is from the non-bank sector.
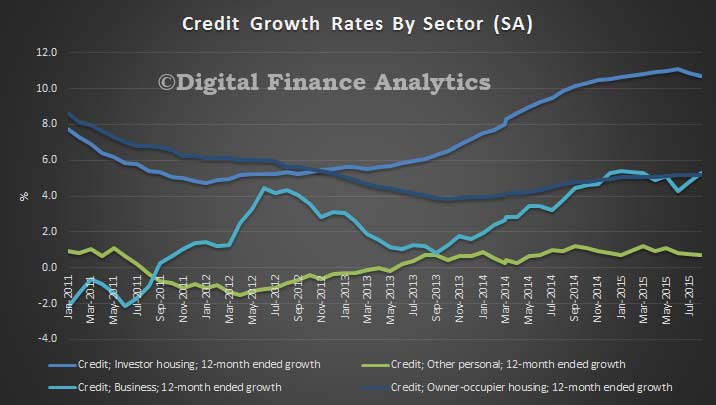
Starting with the RBA data (table D1), overall housing growth for the month was 0.6%, and 7.5% for the 12 months (both seasonally adjusted). Owner occupied lending grew by 0.6% in the month, and 5.6% for the 12 months, whilst investment lending grew 0.7% for the month, and 10.7% for the year – still above the APRA speed limit. The chart below show the 12 month movements. It also shows business lending at 0.5% in the month, and 5.3% in the 12 months, and personal credit 0.1% in the month and 0.7% in the 12 months. It is fair to say from these aggregates that investment lending fell a little, and we think it is likely to continue to fall as lending criteria are tightened, but there is still momentum, and as we showed in our surveys demand, though tempered by tighter lending criteria.
 However, and this is where it starts to get confusing, the RBA says “Growth rates for owner-occupier and investor housing credit reported in RBA Statistical Table D1 have been adjusted to take into account the fact that the purpose of a large number of loans was reported to have changed in August, mainly from investment to owner-occupation. Similar adjustments are likely to be required in coming months. However, the stocks of owner-occupier and investor housing credit reported in RBA Statistical Table D2 have not been adjusted. The total stock of housing credit and its rate of growth are unaffected by this change.”
So, the data in D2 shows a significant fall in the stock of investment loans, and because of the adjustments not being made to these numbers (RBA please explain why you are using two different basis for the data) we need to be careful. On these numbers, owner occupied loans rise 1.5% in the month and investment lending fell 0.7%. The 12 month movements would be for owner occupied loans 6% and investment loans 8.3%.
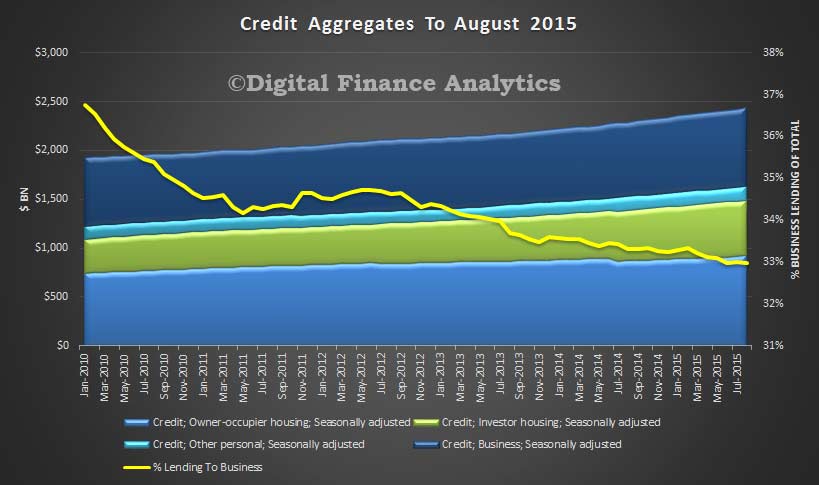
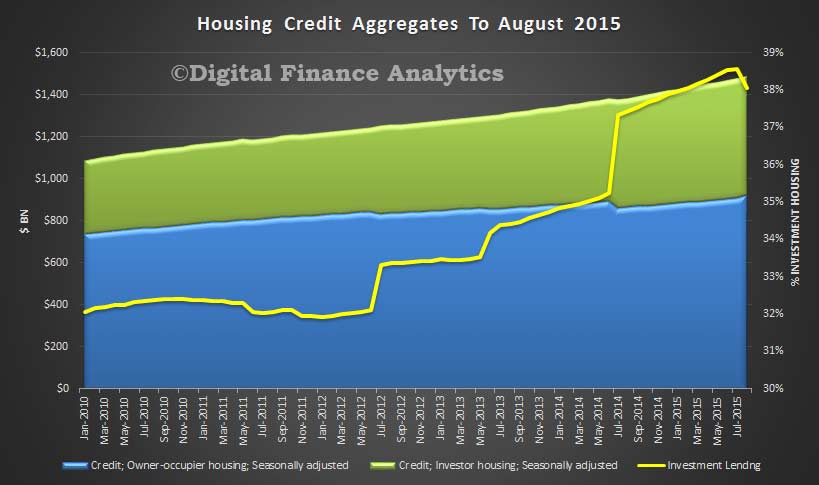 What we can see is that the proportion of lending to business is still at a very low 33%, and this highlights that the banks are still focusing on home lending, with an intense competitive focus on the owner occupied refinance sector, and much work behind the scenes to push as much lending into the owner occupied bucket as possible. Remember that some banks had previously identified loans which should have been in the investment category, so more than 3% of loans were switched, lifting the proportion of investment loans above 38%.
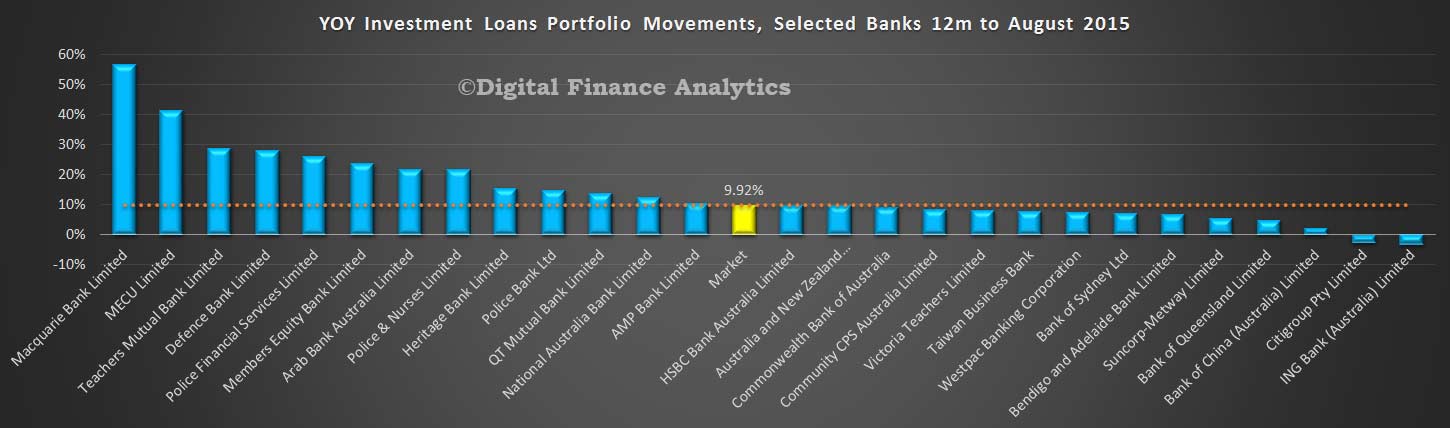
 The APRA credit aggregates which focus on the ADI’s shows that the stock of home loans was $1.378 trillion, up from $1.367 trillion in July, or 0.8%. Within that, investment loans fell from $539.5 bn to $535.5 bn, down 0.7%, whilst owner occupied loans rose from $827 bn to $843 bn, up 1.9%, thanks to the ongoing reclassification. Looking at the movements by banks, the average market movement for investment loans over 12 months (and using the APRA monthly movements as a baseline) was 9.92%, just below the speed limit, and we see some of the major banks below the speed limit now, whilst other lenders remain above. These numbers have become so volatile however, that the regulators really do not know what the true score is, and the banks have proved their ability to recast their data in a more favorable light.
 It is unlikely the “fog of war” will abate any time soon, so we caution that the numbers being generated by the regulators need to be handled carefully.
We will be looking at the individual portfolio movements as reported by APRA in a later post. We like a challenge!
2 thoughts on “What Does The Latest Credit Data Really Tell Us?”