Financial stability and property markets are inextricably linked. It’s an important topic, and yet there is still so much to learn.
In many respects I am reminded of the early 1990s and monetary policy. Inflation targeting was fairly new. Around the world there was important foundational work on how this new approach to monetary policy should operate. Some of that work took place at the Reserve Bank. We learned a lot along the way – the concept of an output gap, the appropriate definition of the target, goal versus instrument independence (Debelle and Fischer 1994), as well as the appropriate forecast horizon (de Brouwer and Ellis 1998). Of course there were some intellectual dead ends, too – the idea of sticking to a fixed interest rate rule or a monetary conditions index being an example.
I often feel that we are at a similar point now in financial stability policy world as we were back then on monetary policy. We are seeing a flourishing of work – sometimes it is hard to keep up with the flow of new, interesting papers! Like the early 1990s work on monetary policy, it is the central banks and policy institutions leading much of the research. Academia is contributing, but it is not the dominant voice. And as for that earlier work, there will inevitably be some dead ends in all this new research.
Policymakers and academics alike were interested in financial stability issues long before the crisis, but the crisis has certainly ramped up the scale of that interest. And because of the crisis, much of the research work being done has a tendency to leap very quickly to the policy conclusion. That’s a natural temptation when the stakes are so high. But the policy imperatives inspiring the work make it even more important to be scientific in our approach. By scientific, I mean the idea that the celebrated physicist Richard Feynman talked about in a much-cited university commencement address (Feynman 1974).
Details that could throw doubt on your interpretation must be given, if you know them. You must do the best you can – if you know anything at all wrong, or possibly wrong – to explain it. If you make a theory, for example, and advertise it, or put it out, then you must also put down all the facts that disagree with it, as well as those that agree with it.It’s an argument for nuance, for being rigorous about your approach and for being prepared to admit you might be wrong. But I don’t want to understate the challenges this poses in a policy institution. Putting the necessary caveats on our work comes naturally to a cautious central banker: that’s not the problem! Once published, though, those carefully drafted caveats are either ignored, or treated as the ‘real’ finding. Sometimes the headline on the reporting is the exact opposite of the real conclusion of the paper.
Despite these difficulties, I think it’s fair to say that we already know quite a bit about property markets and financial stability. Some of the things we know are old lessons, while others have been reinforced by recent events. There is still a lot we don’t know; yet sadly, some lessons we already know risk being forgotten. I will touch on each of these categories today. If there is a common thread to all of them, it is the need to respect the physical realities of the subject.
What We Already Know
For property, the physical reality is that it endures for a long time and is fixed in place.
The reality of property as place
Because property endures, price is determined by demand and supply for a stock of property. The flow of new supply is generally small compared with the stock. This is not a new point; I have made it many times before. The first implication of this relevant to financial stability is that property is prone to ‘hog cycles’ and ultimately to overhangs of excess supply.
The second implication is that acquiring a particular property and the housing or commercial accommodation services it provides is a large upfront cost. Accordingly it makes sense to make that acquisition with some leverage. We’ve known since before the crisis that busts in asset prices of themselves need not be problematic for financial stability (Borio and Lowe 2002). It is the leverage against those assets that matters more. And the highest leverage can be obtained when borrowing is secured against property. I shall turn to the question of leverage in more detail in a moment.
Even more important than its endurance, to my mind, is that property is fixed in place. The Deputy Governor recently talked about the general fascination with land. It is true that if you take the price of land as being the difference between the total price of the property less the replacement cost of the building, it is land prices that have risen relative to incomes (Lowe 2015). But land is two things: it is both space and place. Many have observed that Australia has plenty of the former. But I think the lesson of past booms as well as recent times is that it’s place – location – that really matters. If we think back to boom–bust episodes of the past, whether in land for new development, railways or prime office buildings, in every case you can see people trying to get their hands on the best locations, to take advantage of whatever future economic outcomes they expect.[1]
The same holds true for more recent times, and for residential property. Prior work at the Reserve Bank has shown that location explains far more of the variation in individual property prices than block size (Hansen 2006). Yes, some people like a bigger garden, for privacy or to enjoy in other ways. But being in the ‘right’ kind of neighbourhood with the best amenities, close to commercial centres and other services, is more important to most people, if their willingness to pay for it is any guide.
The physical reality is that the supply of good locations is more or less fixed in the short term. So any sizeable boost to demand cannot be fully absorbed by more supply. The newly built property is simply not the same as the existing stock, because it’s somewhere else. We should therefore not be surprised that strong demand for property does not just change the general price level for that asset, but also its distribution. We can see this in the increase in prices of inner-ring properties relative to those further out, especially in Sydney (Graph 1).
Graph 1

We can also see this in the wedge between growth rates of prices of apartments versus detached houses, as the rising share of apartments in new construction serves to make existing detached houses relatively scarcer (Graph 2).
Graph 2

Over the much longer term, the set of good locations does change. Improving transport infrastructure can certainly help here; the process of gentrification is probably even more important. To give a few examples, in the space of a few decades, suburbs like Paddington, Newtown and Balmain in Sydney or Fitzroy and Northcote in Melbourne went from ‘scary’, to edgy, to trendy, to pricey. The housing stock was also renovated in this process, but most of the price action can probably be explained by the rising relative price of those locations.
Taking all these physical elements together, we have a set of related assets – land for development, existing housing and the various segments of commercial property – that will inherently experience strong, but perhaps temporary, price increases in the face of increases in demand. Irrational exuberance and speculative bubbles aren’t even necessary to get that result, though it’s fair to say that they’d exacerbate it. Simultaneous boom–bust episodes in both prices and rents have been endemic to commercial property markets, and evident in every mining town during every mining boom known to history. Some fundamentals themselves have a boom–bust shape; the inherently sluggish supply of location strengthens this dynamic.
The importance of leverage
I’d like to turn back now to the question of leverage. Like property, the physical reality of debt cannot be ignored. Three aspects are particularly relevant to financial stability and its connections with (leveraged) property.
The first aspect is that debt is almost always a nominal contract. The rate of price inflation in the economy matters enormously for the incentives to take on debt. Negative price inflation – deflation – has long been known to be problematic for borrowers, including otherwise sound ones.[2] More generally, different average rates of inflation involve different average nominal interest rates and different rates of decline in the burden of a fixed-repayment mortgage. The housing literature sometimes calls this ‘mortgage tilt’. Different nominal interest rates also translate the same repayment into a different allowable loan size. The Bank has explained on many occasions that this fact implies that a permanent disinflation has macro implications for debt, asset values, and the distribution of both of them (Ellis and Andrews (2001), RBA (2003), RBA (2014)).
The second aspect is that there is only imperfect information on borrowers’ ability and willingness to pay. Even the borrowers themselves do not know for sure, because they do not know what will happen to their capacity to pay in the future. So some borrowers end up defaulting on their debts, and lenders cannot perfectly predict who will default or even the probability of default. There is of course an enormous literature on credit risk that tries to get a better read on those probabilities. The main point to bear in mind for our purposes, though, is that credit constraints are pervasive and take a range of forms. In financial stability analysis and policy, we often talk about the importance of maintaining lending standards. All we really mean by that is that the credit constraints that exist should be designed well and for the right purpose – to manage credit risk. It will never be possible or desirable to eliminate credit constraints entirely.
The third aspect is that legal definitions of liability differ, and those differences matter to the interplay between debt, property and financial stability. The most relevant difference is that companies have limited liability and individuals do not. This in turn affects the recovery lenders might expect from a borrower who defaults, and therefore the credit risk posed by different kinds of borrowers. This need have nothing to do with the borrower’s intent. It is simply recognising that a bankrupt individual can continue to earn income afterwards, while a company that defaults, goes bankrupt and is wound up ceases to exist.[3] The kinds of property owned by companies might therefore pose different credit risks to those owned by individuals. This is not the only difference between commercial real estate and owner-occupied housing relevant to financial stability, but it is a fundamental one.
The nature of the liability and the claim also helps explain why, as I mentioned earlier, property is permitted to be leveraged more than other assets such as equities. I am not aware of any literature that sets this out clearly. The leveraged asset is not directly the means by which the borrower pays the loan down. Rather, there is an income stream servicing the debt, which might be the rental income on the property, or the labour and other income of a homeowner. The property is the security, the collateral that can be claimed if the borrower does default. Contrast this with an equity claim on a company, such as collateralises a margin loan. The market value of that claim is generally more volatile in the short term than the price of property, which is one reason why a lender might want to limit leverage more. More importantly, the residual claim is against the assets of the business and their ability to produce future income. But business assets – the equipment and other realisable assets of the business – depreciate more quickly than property. That is partly because their rates of wear and tear differ, but it is mostly because the land component of property – the location value – does not physically depreciate.[4]
What this means for systemic risk
So we know that sluggish supply can create boom–bust dynamics in a property market. And we know that these asset classes are particularly amenable to leverage. Is this enough to create systemic risk to financial stability? To answer that, we can turn to a simple framework that the Bank uses to think about what might pose systemic risk (see RBA (2014), Chapter 4). The features we see as posing systemic risk are: size, interconnection, correlation and procyclicality.[5]
The size aspect is obvious. Something can pose systemic risk even if it is not that risky in and of itself, because its impact on the system is large. That is certainly the case for the housing market. In most countries, existing residential housing is not that risky, and neither is the mortgage book. But the housing market is large: housing is a large fraction of household wealth; the housing services provided by the housing stock represent more than 20 per cent of household consumption, much of it implicit in home ownership; and mortgage debt is in many countries a large fraction of the assets of banks and other financial intermediaries. A large enough downturn in housing prices would harm output through its effect on household spending, even if it did not spark a financial crisis through loan losses. This effect was surely at play in the United Kingdom in the early 1990s and the Netherlands in the early 2000s. Consumption weakened, but the increase in non-performing mortgage loans didn’t push the banks into distress. Major losses on home mortgage portfolios are rare, and usually driven by high unemployment. That is to say, they are more often the consequence of a downturn than its cause. The US meltdown was an exception, enabled by gaps in the regulatory system, such that it could not prevent an extreme easing in lending standards (Ellis 2010). But if the mortgage book is large enough relative to the rest of the financial system, even moderate losses would exacerbate an initial downturn that started somewhere else.
Commercial real estate is usually a smaller part of the total stock of property than housing. Yet it is an important part of the capital stock. For example, it is around one-quarter of fixed assets in the United States, that is, excluding the land values The figure for Australia is not quite comparable, but our best estimate is that it is even higher than that. The importance of property to business should be no surprise. Businesses need buildings: offices to work in; retail space to sell from; factories and workshops to make products in; and warehouses to store them.
The sheer size of these asset classes helps explain their interconnection with the financial system, another aspect of their systemic risk. Property is not just a large part of household and business balance sheets. Property-related exposures of various kinds are often large parts of bank balance sheets (Graph 3). In some countries, pension funds are also heavily exposed. Some recent literature has suggested that connections on their own aren’t the real issue – it is the pattern of those connections that matters (Acemoglu et al 2012). And since the financial sector touches every other in some way, the sectors that matter to the financial sector will have disproportionate ultimate effects on the rest of the economy.
Graph 3

At this point we must distinguish between loans financing the purchase of property and loans financing the construction and development of property. At least some existing property is owned outright, not leveraged at all. Financial institutions are not exposed to these properties. Development projects, by contrast, almost always seem to involve at least some debt, usually intermediated debt from banks and similar institutions. This means that banks’ exposures to construction and development of property are usually out of proportion to the flow of new construction relative to the stock of existing property. Given the relative risk profile of the two types of exposure, this strengthens the interconnection between construction activity and the financial sector. This is especially so for the United States, where commercial real estate exposure is not that much smaller than housing exposures. The same would be true in any country where the government intervenes, as it has for many years in the United States, to boost securitisation markets and make it easier for banks to get (low-risk) residential mortgages off their balance sheets.
Direct interconnections are one channel of contagion that creates systemic risk. Correlation, without direct connections, is another. Every property is different in at least some respects. Features, layout, internal fittings and location: all differ across individual properties. So you might think that property is not particularly correlated within the asset class. And you might expect that market participants’ decisions to buy or sell would not be that correlated – that is, that they would not act as a herd. Unlike financial markets, a lot of property is owner-occupied, held for the services it provides. Unlike financial returns, those services do not suddenly deteriorate just because the price of the asset has fallen. So unless the owner is distressed, they have no particular reason to sell just because prices have fallen. They do not have short-term return benchmarks to meet on their property holdings, unlike many fund managers investing in financial assets. And if property prices have fallen, they have generally fallen relative to rents. So selling an owner-occupied property and renting instead actually becomes less attractive.
And yet property markets are thoroughly correlated. Sure, every property is different. So the level of prices differs across individual properties. And yes, there is some idiosyncratic noise in returns, especially if someone falls in love with a property, pays too much and later discovers that the rest of the market does not share their valuation. Still, much of what drives the change in property prices is common to all – interest rates, incomes, lending standards, supply responses. The relative values of particular property features vary rather less over short periods than these macro drivers do.
But if there is one aspect of systemic risk that makes property markets especially important for financial stability, it is procyclicality. The physical realities of property I described earlier, and the fact that it can be leveraged to such an extent drive that procyclicality.
In saying that, I think it’s important to be clear about what we mean by procyclicality. Something could be regarded as procyclical because the amplitude of its cycle is bigger than that in output. This is certainly true of asset prices and credit (Graph 4), as well as many other variables such as investment and corporate profits. But it is not the relevant definition from the perspective of financial stability.
Graph 4

For something to be procyclical in a way that matters to financial stability, its dynamics should be causal for the overall dynamics of economic output and wellbeing. Some variable might well be correlated with the cycle, even predictive of future distress, but if it is not actually causal, leaning on it will not produce the desired outcome of promoting financial stability. I shall have more to say about this point in a moment.
What many people implicitly have in mind when they talk about procyclicality is something even more specific: positive feedback. This is when a movement of a variable in one direction fosters further moves in the same direction, often until a new equilibrium is reached. Such self-reinforcing dynamics and ‘tipping points’ are seen in many complex systems – for example they are well known in certain ecological contexts[6] – so it seems reasonable to believe that they can also occur in economic-financial systems, including in property. An example would be if investors sell an asset after its price falls, inducing further sales and falls in the price. It probably hardly needs pointing out that positive feedback involving plants and rain, or algae and plankton, doesn’t need speculative motives or irrationality, just the right kind of nonlinearity. It might well be that certain kinds of expectations produce that nonlinearity in an economic system, but perhaps we should not assume that is the only way to get it.
What We Do Not Yet Know
So we know a lot: that property booms and busts, partly because of its physical realities; and that it can be highly leveraged, which can sometimes be dangerous for economic and financial stability. There is certainly a lot of evidence, or at least some strong indications, that property has something to do with the boom-bust episodes that so often engender financial instability and crisis. What we don’t yet know in all this is what the mechanism behind these connections really is. This comes back to the point I made just before about needing a causal link if something is to warrant a policy response.
We do know that there are strong correlations between strong upswings in credit, measured in a variety of ways, strong growth in property prices, and subsequent bad events. What isn’t yet settled is whether the credit causes the prices, the property markets drive the credit, or whether either of these is the decisive factor in generating economic downturns or financial distress. There is some interesting recent literature that tries to tease out these relationships (e.g. Geanokoplos and Fostel (2008) and Geanokoplos (2009)) but I don’t think the profession has reached a consensus on this as yet.
I’ve heard it said that paying attention to these correlations is still worthwhile, because you don’t have to know what causes a typhoon to know that it is dangerous. But in that situation, there is nothing to stop you from believing that the typhoons are a punishment from the weather gods and that the appropriate policy is a program of sacrifices to placate them.[7] You don’t need to know the causes of a crisis – or a typhoon – to encourage a bit more resilience to their effects. More capital and faster debt amortisation are two good examples of increasing financial resilience. As soon as you start to talk about preventative policy, though, you should at least have a good theory about the mechanism, and some evidence to back it up. Otherwise, how can you distinguish what is really causal, from what is merely a correlation?
Another issue that I do not consider to be settled is whether we should regard these boom-bust dynamics as a cycle, and if so, whether it represents a credit cycle that is somehow independent of the business cycle. Certainly there have been many papers asserting the existence of a credit or financial cycle that has a longer frequency than the conventional business cycle frequency, which is usually assumed to be much less than a decade.
I would be wary of assuming too readily that property finance really is the driver of the cycle in the way some literature has claimed. It might well be, but some recently released empirical analysis suggests that, for the United States at least, it is unsecured corporate borrowing that drove the cyclicality in business credit in recent decades, not (commercial) mortgages and other secured credit, which seems more or less acyclical (Azariadis, Kaas and Wen 2015). Much of the work that claims to find mortgage-driven credit cycles rest heavily on pre-war data (Jordá, Schularick and Taylor 2014). I do not wish to take away from the achievement of the compilation of these data sets. Rather, I simply want to inject a note of caution against jumping to strong policy conclusions on the basis of data that might not be the most relevant.
In calling for that caution, I am if anything harking back to even longer-run evidence on the causes and effects of numerous boom-bust episodes. Kindleberger noted in his magisterial analysis of these episodes that every mania started with a ‘displacement’ (Kindleberger and Aliber 2000). That is, something real happened, something that would endure even after the panic and crash. His and other historical analyses of these episodes point to a range of one-offs as triggers for the booms: new products, political change, financial deregulation all being mentioned in many cases. If that’s right, perhaps we should not speak of a cycle, but rather, simply a parade of stuff happening.[8]
Since many of these boom-bust episodes were common across countries, we should also remember that many financial institutions reach across borders, and that many institutional and regulatory changes do as well. There has probably not been enough recognition of the role of international institutions and peer effects amongst policymakers in creating correlated institutional change across countries. One example is the wave of financial deregulation in the 1970s and 1980s that culminated in financial crises in Japan, the Nordic countries and (almost) Australia in the late 1980s and early 1990s.
The relatively better performance of these countries in the subsequent global financial crisis has sometimes been attributed to a kind of scarring effect – or scaring effect, if you like. According to this narrative, the people who went through the early 1990s crises or near-crises were still in charge in the lead-up to the more recent crisis, and their earlier experience made them more cautious. There is probably something to this story and, if so, it raises the question of how to pass that realistic approach to risk down to future generations of bankers and policymakers. But there is an alternative interpretation of events, which is simply that the financial sector can only be deregulated once from its post-war restrictions. The resulting over-exuberance, borne of inexperience, could only re-occur if something else came along that resulted in a similar transition period of fast credit growth, at the same time as we somehow forgot everything we have learned since about credit risk management.
The Things We Risk Forgetting
I don’t want to sound flippant about this, because history does tell us that it is possible to forget good credit risk management. One of the things we risk forgetting about property markets and financial stability, and about risk more generally, is that it is possible to forget. As we get further away from the peak of the crisis, increasingly we will hear points of view questioning what the fuss was all about. If there is indeed a trade-off between growth and financial stability – and that’s by no means settled – policymakers must balance both considerations. In doing so, they must not forget the full costs of financial instability and the distress it can cause.
In particular, it is possible to forget how to do good credit risk management. The body of knowledge about best practice in this area has certainly expanded over the past quarter century, but that doesn’t mean it is always practiced. It is all too tempting to ease standards over time. It is like one of those humorous verb conjugations: ‘I am just responding to strong competition; you have relaxed your standards; he is being imprudent’.
We saw a kind of forgetting about credit risk management in the US mortgage market, because often it was new (non-bank) firms doing the lending. Without an existing corporate culture about risk, often without a prudential supervisor to enforce those standards and practices, without ‘skin in the game’ in the form of their own balance sheet absorbing that risk, the new wave of US mortgage lenders slid inexorably into a stance of utter imprudence.
Another thing we risk forgetting is that property markets are not just about households’ mortgages. Property development, including for residential property, and commercial lending related to property more generally, should also receive sufficient attention from risk managers, policymakers and academic researchers. It is these segments of lending that tend to grow in importance in the late stages of a boom, and to account for a disproportionate share of loan losses in a bust (Graph 5).
Graph 5

And if we are looking for surges in credit growth as precursors to painful downturns, we should bear in mind that, historically, these surges have been evident in business credit far more than in housing credit. That is certainly what we see in the Australian data (Graph 6).
Graph 6

We don’t only risk forgetting that property is not just about home mortgages. We also risk forgetting that these different market segments are not all the same as each other, or across countries. Institutional settings and public policies affect credit risk greatly, sometimes in ways that are not obvious. There are clear connections between financial stability outcomes and the mandate, powers and culture of the prudential supervisor, or the form and coverage of consumer protection regulation around credit. But it is perhaps less obvious that labour market institutions, for example, or the way health care is paid for, can affect the idiosyncratic risks households face, and thus the credit risk they pose to lenders.
Though the profession has clearly learned that leverage matters, we risk forgetting that credit is not an amorphous blob. It embeds an agreed flow of payments, certainly, but also a complex set of contract terms. These contract terms touch on the resulting credit risk at many points: not just the collateral posted and how it is valued, but the assumptions about serviceability, the length and flexibility of the loan term, the rate of amortisation required or allowed and so on. In other words, lending standards are multidimensional. Excessive focus on one dimension to the exclusion of others could in some cases be counterproductive.
One final thing I do not want us to forget: that while policy institutions such as central banks will do much of the running on policy-relevant research, we need sound contributions from academia to keep us honest and keep us smart. Good academic work such as the ones I have cited today can provide us with both tools and insights that we might not have come up with ourselves. Researchers at policy institutions generally try very hard to follow the evidence where it leads, even if it isn’t consistent with the previously stated positions of the institution; parallel contributions from academia are valuable information to test whether we are doing well enough in that regard. And the scientific project of explaining something new, the core academic value of working out the implications of your assumptions or your theory and testing those implications, remains the standard we all aspire to. Richard Feynman put it well in the same address that I quoted earlier.
* Thanks to Kerry Hudson for assistance in preparing this speech, and to Penny Smith, Fiona Price and participants at a workshop on the same topic at the Banco Central de Chile on 25 April 2014 for helpful comments and discussion.
Acemoglu D, VM Carvalho, A Ozdaglar and A Tahbaz-Salehi (2012), ‘The Network Origins of Aggregate Fluctuations’, Econometrica, 80(5), pp 1977–2016.
Azariadis C, L Kaas and Y Wen (2015), ‘Self-Fulfilling Credit Cycles’, Federal Reserve Bank of St Louis Working Paper 2015-005A.
Borio CEV and PW Lowe (2002), ‘Asset Prices, Financial and Monetary Stability: Exploring the Nexus’, BIS Working Paper 114.
Borio CEV (2012), ‘The Financial Cycle and Macroeconomics: What Have We Learnt?’, BIS Working Paper 395.
Debelle G and S Fischer (1994), ‘How Independent Should a Central Bank Be?’, in J Fuhrer (ed), Goals, Guidelines, and Constraints Facing Monetary Policymakers, Federal Reserve Bank of Boston, Boston.
Ellis L (2010), ‘The Housing Meltdown: Why did it Happen in the United States?’, International Real Estate Review, 13(3), pp 351–394.
Feynman R (1974), ‘Cargo Cult Science’, Commencement Address, Caltech University, Pasadena, CA. Available at <http://neurotheory.columbia.edu/~ken/cargo_cult.html>.
Fisher C and C Kent (1999), ‘Two Depressions, One Banking Collapse’, RBA Research Discussion Paper No 1999-06.
Geanokoplos J (2009), ‘The Leverage Cycle’, in D Acemoglu, K Rogoff and M Woodford (eds), NBER Macroeconomics Annual, Volume 24, University of Chicago Press, Chicago, pp 1–65.
Jordá Ò, M Schularick and AM Taylor (2014), ‘The Great Mortgaging: Housing Finance, Crises, and Business Cycles’, NBER Working Paper 20501.
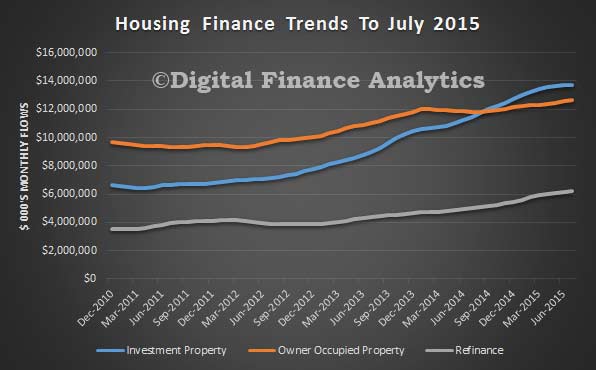 Investment housing was $13.72 bn, (up from $13.69 bn last month), and other commercial lending was $22.22 bn, (down from $22.26 bn last month). Personal finance was $7.48 bn (down from $7.51 bn in June).
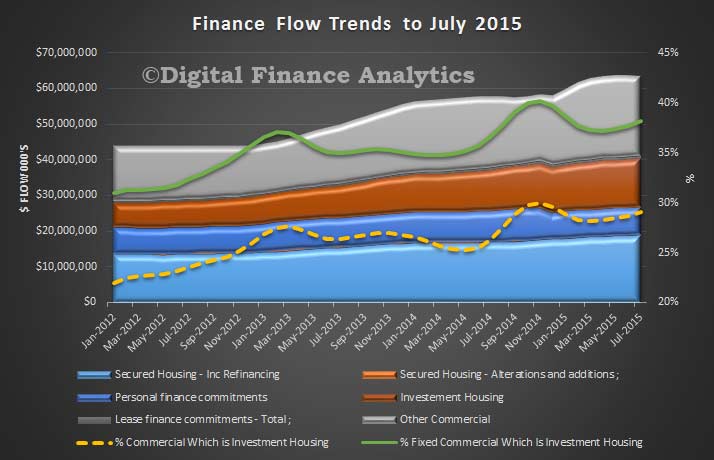 The total value of owner occupied housing commitments excluding alterations and additions rose 0.8% in trend terms, and the seasonally adjusted series rose 2.2%.


