Another lender, ME has announced changes to its variable and fixed home loan interest rates for investor and selected owner occupied loans. Keeps the consistency in pattern, with higher rates for existing and new investment loans, and a cut to attract new owner occupied lending. This is in line with our expectations. Again we make the point, that ME bank is not subject to the APRA changes for advanced IRB banks, once again their pricing is more about competitive dynamics, than directly connected with the 10% speed limit on investor loans.
Effective 15 September 2015 ME’s Basic Variable home loan interest rate for new investor borrowers will rise by 0.40% to 4.69% p.a.* (comparison rate 4.70#) and its Flexible home loan with member package^ interest rate for new investor borrowers will increase by 0.36% to 4.89% p.a.* (comparison rate 5.28#). Rates across existing investor loans will also rise by 0.41%.
Fixed rates for new owner occupied borrowers will fall between 0.09% and 0.50% across its 3 to 7 year terms, including our 3-year fixed rate falling 0.09% to 4.19% p.a.* (comparison rate 4.71#).
ME CEO, Jamie McPhee, said the changes have been precipitated by a major changes in the banking industry which have forced banks including ME to review their lending practices and pricing.
APRA introduced new regulatory measures to reinforce sound residential lending practices last December, including actions to restrict investor lending growth to no more than 10% p.a.
“The changes we have announced today will advantage owner occupied borrowers particularly those seeking to buy their first home,” McPhee said.
“The decision to increase investment rates was a difficult one, but after careful consideration we believe that combined with rate cuts across selected owner occupied home loans it strikes the right balance across our portfolio.”
Another non-major lender, AMP Bank has reduced interest rates across variable and fixed home loans for new customers making them some of the most competitive in the market.
The AMP Essential Home Loan will be reduced to 4.09 per cent per annum, down from 4.20 per cent.
The Basic variable will be reduced to 4.19 per cent per annum, down from 4.50 per cent.
In addition, the Basic two year fixed rate loan will be reduced to 4.18 per cent, down from 4.55 per cent.
The changes to the Basic variable and fixed loans provide an attractive option for customers who may wish to split their loan and pay a portion fixed and a portion variable.
The rate changes are in line with AMP Bank’s commitment to help more Australians own their own homes.
The changes are effective Sunday 30 August for fixed and Monday 31 August for variable rates and are available for new loan applications.
The closer one looks at the government’s recent decision to levy a deposit tax against Australia’s Big Four banks, the more it seems like a revenue grab. Nothing more, nothing less.
An inspection of the legislation reveals that in the event of the failure of an Australian bank, there is no need for a levy to fund a depositor bailout. That means this proposal is not a deposit levy. It is simply another tax, with little to do with protecting depositors in the event of a bank failure.
Three crucial factors substantiate this assertion: the Banking Act, the levels of retained capital, and hypothecation (the practice of pledging collateral against debt).
We’ll explain why.
First, to the Banking Act of 1959, in particular s 13A, which provides that in the event of insolvency, an Australian bank (referred to as an authorised deposit taking institution, or ADI) is required to reimburse Australian “protected” depositors before settling claims by international creditors or offshore depositors.
Section 4 of the Act defines a protected account as:
An account, or covered financial product, that is kept under an agreement between the account-holder and the ADI requiring the ADI to pay the account-holder, on demand by the account-holder or at a time agreed by them, the net credit balance of the account or covered financial product at the time of the demand or the agreed time (as appropriate).
Effectively therefore, protected accounts are all demand deposits. That is to say, deposits where the owner of the funds can withdraw their funds at any time.
The University of Melbourne’s Professor Kevin Davis has run the numbers, and his findings are that in the event of insolvency, no Australian bank would be so bankrupt that it would not, at least, be able to reimburse Australian depositors.
If Australian depositors are protected as preferential creditors (which they are), and if at current capital adequacy levels no Australian bank would be unable to refund domestic depositors, then the obvious question is why do we need this levy?
Secondly, the notion that this is some kind of “user pays” scheme is disingenuous. Today in Australia it is almost impossible to exist, in any meaningful economic sense, without a bank account.
That means any deposit into an account in any of the big four – drawing a wage or conducting any kind of business – will be covered by this levy. So as revenue grabs go, this one catches in the net something like 80% of all deposits.
In theory, the monies collected by the levy will be held in (that is, hypothecated to) a new entity, the Financial Stability Fund (FSF). Other than its name, little is known about this new fund. It is obviously meant to be a long-term mechanism as it will take many years – the exact timing being dependent on the levy rate chosen – before the fund will cover even a small percentage of potential pay-outs to depositors.
However, the fund is not designed to cover all pay-outs to depositors in the event of a bank failing, but only any amounts not recovered by other means. Calculating the size of the levy is problematic and must then take account of other measures, particularly the amount of capital that banks hold.
In suggesting that a so-called “ex-ante” levy be introduced to promote financial stability, the IMFalso recommended that additional capital, in the form of so-called Higher Loss Absorbency (HLA), be required for “systemic” banks (which in the case of Australia would be the Four Pillars).
This recommendation has been accepted by banking regulator APRA and, from January 2016, the big four banks will be required to hold an additional 1% HLA capital buffer. This additional 1% capital, which APRA admits is at the low end of international levels, must be met through so-called Tier 1 Equity capital, which helps to explain the current capital raising efforts of the banks and the negative impact on their share-prices.
Since it is expected that a bank’s capital should be sufficient to withstand all but the most severe shocks, it is a moot point whether the belt-and-braces approach of collecting an additional levy would add much towards ensuring financial stability. As it is not yet known how much of a buffer the new levy will actually provide over time and no mechanism has as yet been created to manage the monies collected, the decision to go ahead with the levy appears to be a path of least resistance (blame it on the previous government) rather than well-considered public policy.
In particular, the use of a fixed levy (of the order of 0.05% of deposits) is not in line with international experience, where a risk-adjusted fee is often used, and may be more appropriate to the Australian banking system.
The Murray inquiry went so far as to reject the idea of a deposit levy in favour of requiring Australian banks to be “unquestionably strong” and in the top tier of international banks as regards capital. It appears that by cherry picking recommendations from the IMF and the Murray inquiry, the government may be in danger of increasing the costs of banking in Australia without improving the stability of the system. Who would have guessed?
Authors: Andrew Schmulo, Principal, Clarity Prudential Regulatory Consulting Pty Ltd. Visiting Researcher, Oliver Schreiner School of Law, University of the Witwatersrand, Johannesburg. at University of Melbourne; Pat McConnel, Honorary Fellow, Macquarie University Applied Finance Centre at Macquarie University
Bendigo Bank has announced it will increase its residential investment standard variable interest rate by 0.20% p.a. to address recent industry-wide concerns regarding residential investment lending.
The residential investment package variable rate will also increase by 0.20% p.a. for new business and most existing investor variable rate loans.
Bendigo and Adelaide Bank Managing Director Mike Hirst said implementing this measure supports the Bank’s prudent management by appropriately pricing for risk and assists restraining investor mortgage book growth to less than 10 percent per month as required by the Australian Prudential Regulatory Authority (APRA).
“When it comes to setting interest rates, our Bank takes into account a wide range of factors and carefully consider its key stakeholders including borrowers, depositors, staff, shareholders, partners and the wider community,” Mr Hirst said.
“We believe this approach considers the needs of our stakeholders while continuing to provide customers with market competitive rates,” he said.
The adjustment is effective 1 September for new business and 1 October 2015 for existing residential investment loans.
APRA today released the Quarterly Authorised Deposit-taking Institution Performance publication for the June 2015 quarter. This publication contains information on ADIs’ financial performance, financial position, capital adequacy and asset quality. There were 160 ADIs operating in Australia as at 30 June 2015, compared to 165 at 31 March 2015. There were eight changes were mainly to some credit unions having their licences revoked.
Over the year ending 30 June 2015, ADIs recorded net profit after tax of $38.0 billion. This is an increase of $5.7 billion (17.6 per cent) on the year ending 30 June 2014.
As at 30 June 2015, the total assets of ADIs were $4.4 trillion, an increase of $376.4 billion (9.3 per cent) over the year. The total capital base of ADIs was $238.1 billion at 30 June 2015 and risk-weighted assets were $1.8 trillion at that date. The aggregate capital adequacy ratio for all ADIs was 13.2 per cent.
Impaired assets and past due items were $26.7 billion, a decrease of $5.4 billion (16.8 per cent) over the year. Total provisions were $13.4 billion, a decrease of $5.2 billion (27.9 per cent) over the year.
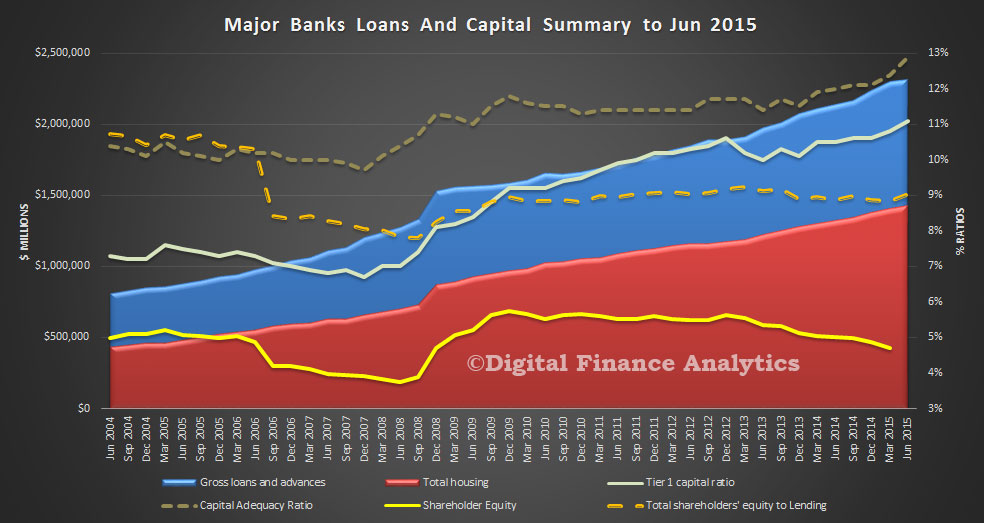
Looking in detail at the average of the four majors, we have plotted loans, housing loans and capital ratios again, to June 2015. We see the growth in lending, and the ongoing rise of housing lending. We also see the capital adequacy ratio and tier 1 ratios rising. However, the ratio of loans to shareholder equity is just 4.7% now. This should rise a bit in the next quarter reflecting recent capital raisings, but this ratio is LOWER than in 2009. This is a reflection of the greater proportion of home lending, and the more generous risk weightings which are applied under APRA’s regulatory framework. It also shows how leveraged the majors are, and that the bulk of the risk in the system sits with borrowers, including mortgage holders. No surprise then that capital ratios are being tweaked by the regulator, better late then never.
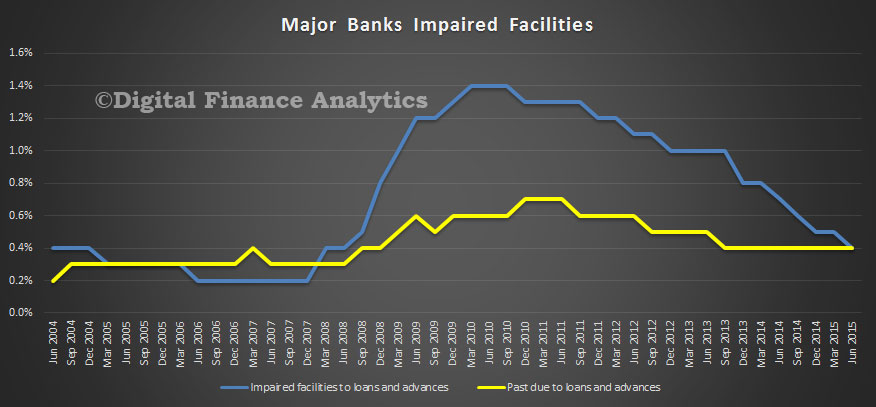
At the moment impairments are low, this of course may change if economic momentum slows, unemployment or interest rates rise, or house prices slip. Other risks include external shocks, like China and the impact of rates in the US rising.
RBA Assistant Governor (Financial System) Malcolm Edey’s Opening Statement to the Senate Economics References Committee Inquiry into Matters Relating to Credit Card Interest Rates touches on some important points. The RBA’s full submission is one of 23 made, and is worth reading. The terms of reference for the inquiry are wide ranging. Borrowings on cards are worth more than $41bn.
The economic effect of matters including the difference between cash rates and credit card interest rates, with particular reference to:
the Reserve Bank of Australia‘s cash rate announcement and associated changes in credit card interest rates;
the costs to banks, credit providers, and payments systems, including those related to:
borrowings,
credit risk and default rates, and credit risk pricing,
various credit card loyalty programs, and
consumer protection measures, including reforms introduced following the global financial crisis,
transaction costs, including interchange fees, on the payments industry;
the costs to consumers, including those related to:
how and when interest is applied,
minimum monthly payment levels,
various credit card loyalty programs of other users, and
card fees, including ATM and POS fees;
what impact competition and price signals have on the credit card market;
how the enforcement of responsible lending laws and the national consumer credit regime affect consumer costs;
how consumer choice of credit card products can be improved, with reference to practices in other jurisdictions; and
any other related matters.
The RBA has also made a number of comments on the cards industry in its recent paper. Now, here are today’s opening comments.
I know the Committee is interested in a number of different aspects of credit card pricing and regulation, and we’ve tried to address those aspects that come within our field of expertise and responsibility in our submission.
As we explain in the submission, credit cards have both a payment and a credit function. The regulatory powers and mandate of the Reserve Bank Payments System Board relate to the payment function. The Board has a mandate to use its powers to promote efficiency and competition in payment systems, consistent with overall stability of the financial system. To that end, the Board has for a number of years regulated card payment systems by setting standards in relation to such matters as interchange fees, surcharging and access.
As you know, the Board is currently undertaking a comprehensive review of those aspects of card payments regulation. I’ll be happy to answer any questions you might have today about how that review is proceeding.
I know the Committee is also very interested in the credit function, and particularly the interest rates on credit cards. That is not something that we regulate, but we have set out in our submission an overview of some of the key facts.
If I may, I’ll just make a few high-level observations about that before we go to questions.
Credit card products vary a lot in the interest rates that they charge. Some of those rates are very high. They’re higher than I think can be easily explained.
Interest rates of the order of 20 per cent on credit cards are not uncommon. The average rate for borrowers who incur interest on credit cards is currently about 17 per cent. After deducting banks’ cost of funds and the cost of credit losses, that would equate to an interest rate margin of more than 10 percentage points.
My advice if you’re in that situation is to shop around. Despite the prevalence of high-rate cards, this is a market where there is some significant competition. There are a lot of card products that offer lower rates and special deals for balance transfers. In many cases, card holders should be able to lower their interest rates by taking advantage of those offers, if they are willing to shop around.
That of course raises questions about why more cardholders don’t take advantage of the lower rates that are on offer, whether there are obstacles to competition and whether there might be some role for regulatory action.
Some cardholders might be unable to switch, for example if they have poor credit histories. That is something that can be looked into, along with the related question of whether there are unreasonable obstacles to switching. Other cardholders might not be aware of the options available, or might have other reasons for not pursuing them. We discuss some of those issues in our submission.
The answers to these questions are not necessarily straightforward, and I think these are areas where the financial regulators can usefully do further work. When I appeared at this Committee in June I indicated that the Bank would consult with other regulators in this area, and we have begun doing that. We will be continuing those discussions at a more senior level at the next meeting of the Council of Financial Regulators next month.
I don’t want to pre-empt what might come out of those discussions, but some of the questions that might be considered are: whether there is a case for improved disclosure in this area; whether there is a need for stronger risk assessment requirements for credit card lending; and to what extent any actions in these areas would fall within the regulators’ existing powers and mandates.
DFA last year highlighted the flows of value within the credit card system, and our analysis suggested that card interest rates ARE too high. Actually the credit card business relies on those who continue to revolve to maintain the value of business. We think that unbundling the payment mechanism from the credit mechanism, and the loyalty element is critical to get to grips with what is going on. We also hope the inquiry considers alternative payment mechanisms as part of the review.
Fitch Ratings says that Sydney’s mortgage performance has benefitted the most from the rise in house prices. Metropolitan regions, including those historically worst performing ones in western Sydney, have not experienced the usual deterioration in mortgage delinquency rates caused by Christmas spending.
Budgewoi (2262), on New South Wales’ (NSW) Central Coast, has topped the list for the second time as Australia’s worst performing postcode in terms of missing housing loan repayments. With a 30+ days delinquency rate of 3.2%, Budgewoi has appeared 11 out of 14 times in Fitch’s previous mortgage delinquency reports.
This year, Tasmania replaced Queensland (QLD) as the worst performing state in Australia for mortgage repayments with a delinquency rate of 1.33%. This figure reflects Tasmania’s high unemployment rate and low house appreciation over the past three years.
On average, the delinquency rate across Australia increased 9bp to 0.99% at end-March 2015, up from 0.90% at end-September 2014. The strong house-price appreciation and lower interest rates slightly offset the negative impact of seasonal Christmas overspending, as arrears are 36bp lower than 12 months ago.
Over the past two years, local unemployment and the housing market have been the major drivers in regional mortgage performance, particularly in the current low-interest rate environment.
Most of the 20 worst-performing postcodes were in metropolitan regions, with the only exception being Laidley and Mount Isa in QLD. However, metropolitan regions overall performed better than non-metropolitan areas, especially in Western Australia, Queensland and Northern Territory where the slowdown and job cuts in the mining industry have been detrimental to mortgage performance.
Christmas spending and the general cost-of-living affected the mortgage performance of regions in states that showed strong sensitivity to mortgage rates – such as the north-west of Melbourne and south-west of Brisbane – due to socio-economic factors like high unemployment.
For the first time, Mackay (QLD) became the worst-performing region in Australia by dollar value, replacing Hume City (Victoria, VIC), following a 59bp worsening in 30+days arrears. Mackay’s performance deteriorated the most in the six months to end-March 2015.
The best performing regions in their respective states by value are: Lower Northern Sydney (New South Wales, NSW); Inner Melbourne (VIC); Inner Brisbane (QLD); and Central Metropolitan Perth (West Australia, WA).
Fitch continues to monitor regional mortgage performance as there is still a clear distinction between best- and worst-performing regions in a given time frame, and trends vary with local economic cycles.
Fitch Ratings says that the investment loan reclassification process announced by National Australia Bank Limited will not result in a withdrawal or downgrade of Fitch’s ratings on the National RMBS Trust notes and outstanding issuance under NAB’s mortgage covered bond programme. The reclassification process has been initiated following a review of NAB’s housing loan purpose data which found misclassifications between ‘owner occupied’ and ‘investment’. The full list of ratings follows at the end of this commentary.
Fitch believes that investment-property loans will have a higher probability of default in an economic downturn, as borrowers will fight harder to protect their primary residence. The agency applies a 25% higher base default probability in the case of a mortgage collateralised by an investment property, compared with an owner-occupied property.
However, Fitch has tested the sensitivity of the ratings to an increase in the proportion of loans collateralised by investment properties. The analysis found that the RMBS notes’ and mortgage covered bond ratings are not impacted by an increase in expected foreclosure frequency following the increase of loans classified as investment loans in each of the rated transactions. The levels of credit enhancement (CE) available to each rated note issued under the National RMBS transactions would still be above Fitch’s adjusted break-even CE levels. The transactions are performing within expectations with low levels of arrears and losses.
The change of the proportion of investment loans in the cover pool would not impact Fitch’s ‘AAA’ break-even asset percentage (AP) of 89.5% on NAB’s mortgage covered bond programme. The ‘AAA’ break-even AP calculated by Fitch is mainly driven by the programme’s refinancing needs as a result of significant maturity mismatches and the agency’s refinancing assumptions.
NAB has stated that new procedures are being implemented and that identified gaps in data capturing have been rectified. This work forms part of an ongoing review to improve its statistical reporting process. Fitch has and will adjust its analysis assumptions on the National RMBS transactions and the NAB mortgage covered bond programme to reflect the ongoing work.
The affected RMBS transactions are securitisations of first-ranking Australian residential mortgages originated by Advantedge Financial Services Pty Limited and Challenger Mortgage Management Pty Limited: National 2011-1, National 2012-1 and National 2012-2; and National Australia Bank Limited: National 2011-2 and National 2015-1.
Wayne Byres, Chairman APRA, “Banking On Housing“, speech today, portrayed the current state of play with regards to supervision of housing lending. He started by noting that housing lending now accounts for around 40 per cent of banking industry assets, and a little under two-thirds of the aggregate loan portfolio. With such a concentration in a single business line, we are all banking on housing lending remaining ‘as safe as houses’.
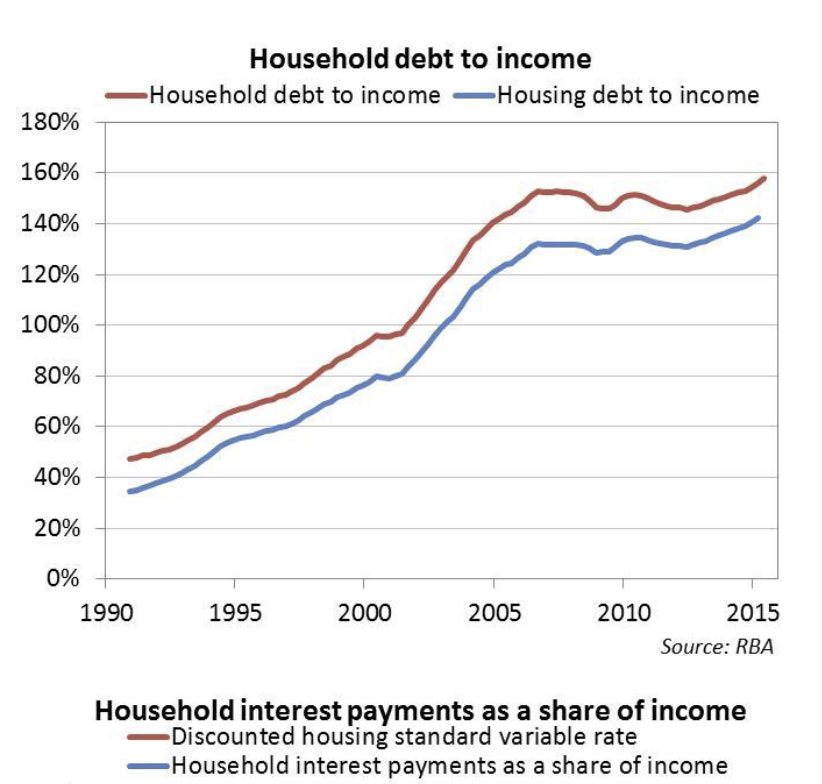
Supervision is important, he say’s given the high household debt involved. As with housing prices, these debt levels are at the higher end of the spectrum. Furthermore, after plateauing for much of the past decade, the household debt-to-income ratio has begun drifting upwards again. Households still have a significant (and growing) net worth, as housing assets are increasing in value faster than debt. Nevertheless, the trends in overall level of debt bear watching.He acknowledges the change in mix of loans, with the growth of investor loans.
Turning to the composition of loan portfolios, a notable change has been the well-publicised growth in lending to investors. In terms of the outstanding stock of housing lending, investors account for more than one-third; of the current flow of approvals, investors now account for more than 40 per cent. For comparison, in the mid-1990’s both those proportions were around half today’s levels.
A key question is: does this compositional shift change portfolio risk profiles? Australian data suggests that there has been little difference in the propensity of investor loans to become impaired, vis-à-vis those to owner-occupiers. However, caution is needed given the lack of any period of severe household stress over the past two decades: evidence from other countries suggests we should be wary of extrapolating the current Australian experience into more stressful scenarios.
Of course, it is not just the nature of the borrower, but also the growth in lending, that acts as a warning sign for supervisors. When we wrote to ADIs in December 2014, we flagged a benchmark for investor lending growth of 10 per cent, or higher, as a sign of increased risk. We highlighted investor lending because it was an area of accelerating credit growth and strong competition: a combination in which the temptation to compete and protect market share could drive a weakening of credit standards. By moderating growth aspirations, we are reducing the tendency for ADIs to whittle away lending standards in the name of ‘matching our competitors’ – when it comes to lower standards, it’s always the other guy’s fault.
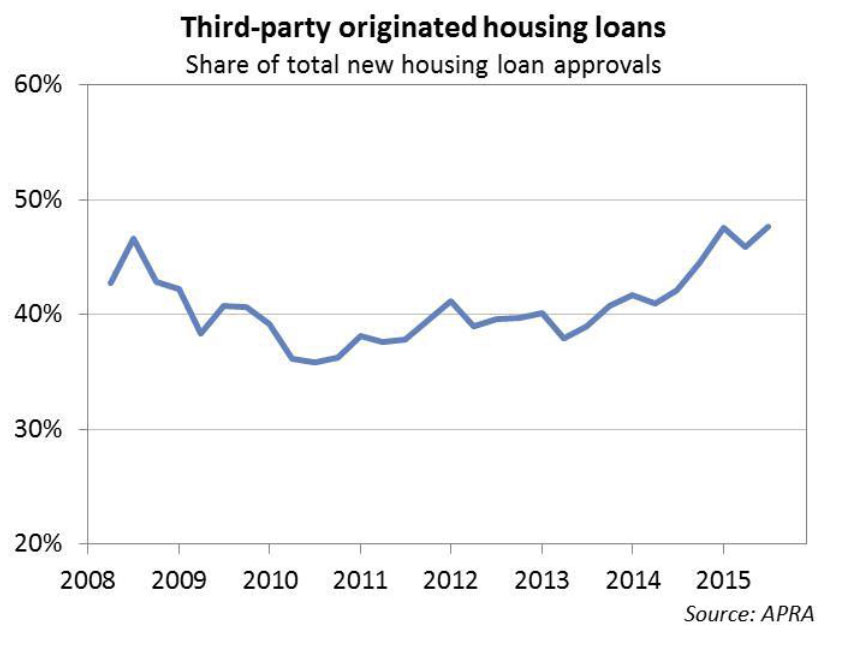
He highlighted the rising share of loans originated via brokers.
Another feature of the home lending market has been the increasing use of third-party distribution channels. There are potentially significant advantages from such an approach: for example, allowing smaller lenders or new entrants to compete more readily against the established branch networks of the bigger players. On the other hand, third-party-originated loans tend to have a materially higher default rate compared to loans originated through proprietary channels. This does not mean third-party channels have lower underwriting standards, but simply that the new business that flows through these channels appears to be of higher risk, and must be managed with appropriate care.
The final layer of analysis has been our detailed review of lending standards at individual lenders. We published some conclusions from this in May,6 and highlighted a few areas where standards were not what they could or should be. Examples included, generous interpretations of the stability and reliability of borrowers’ incomes; borrowers assumed to have very meagre living expenses; and/or a reliance on interest rates not rising very much, or (more puzzlingly) rising on new debts but not existing ones.
ASIC’s recently announced review of interest-only home lending made similar findings.
The industry has responded with improved practices in the past few months. For example, it is now commonplace for lenders to apply a haircut to unstable sources of income, and to assume a minimum interest rate of around 7.25 per cent – well above rates currently being paid – when assessing a borrower’s ability to service a loan. These steps should give greater comfort about the quality of new business now being written.
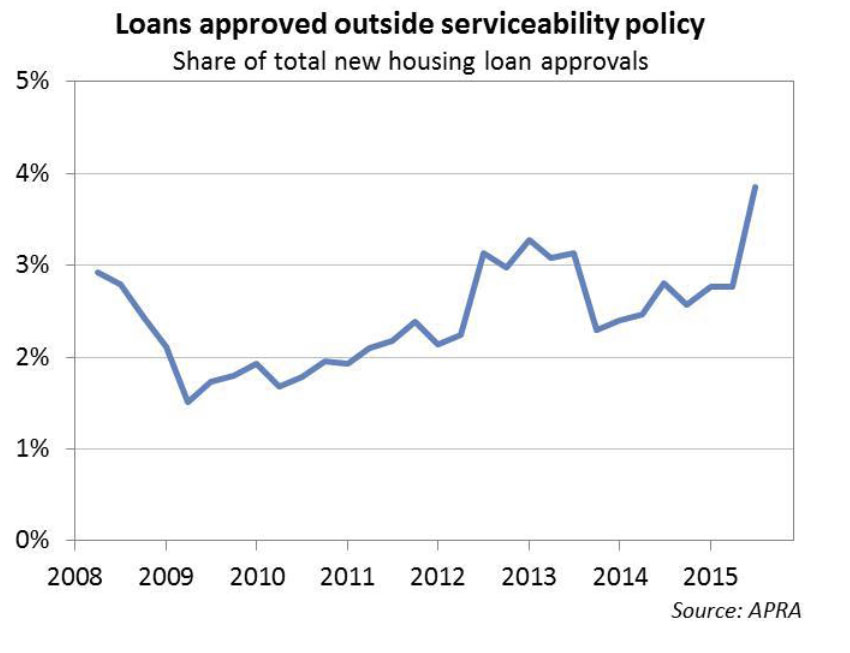
However, a close eye will need to kept on policy overrides – in other words, the extent to which lenders approve loans outside their standard policy parameters. There are some definitional issues that mean care is needed with this data, but the rising trend for loans to be approved outside policy needs to be watched: as lenders strengthen their lending policies, it’s important to make sure this good intent isn’t being undone by an increasing number of policy exceptions.
Before I wrap up, I’d like to comment on the potential for further action by APRA, including targeted measures that, it has been suggested, we should employ to specifically respond to rising housing prices in Sydney and Melbourne. In response, I would make three points:
First, our mandate is to preserve the resilience of the banking system, not to influence prices in particular regions; second, the broader environmental factors I outlined at the start of my remarks – high housing prices, high debt levels, low interest rates and subdued income growth – are not present only in our two largest cities; and
third, sound lending standards – prudently estimating borrower income and expenses, and not assuming interest rates will stay low forever – are just as important (and maybe even more so) in an environment where price growth is subdued as they are in markets where prices are rising quickly.
That is not to say that geographic measures would never be contemplated. Parallels are often drawn with New Zealand, where specific measures have been directed at the rapid price appreciation in Auckland. In comparing the respective actions on both sides of the ditch, it’s important to note the Reserve Bank of New Zealand (RBNZ) initiated measures for Auckland only after first instituting a range of measures that applied New Zealand-wide. In other words, more targeted measures built on, rather than substituted for, measures to reduce financial stability risks nationally.
Given many changes to lenders’ policies, practices and pricing are still relatively recent, it is too early to say whether further action might be needed to preserve the resilience of the banking system. We remain open to taking additional steps if needed, but from my perspective the best outcome will be if lenders themselves maintain a healthy dose of common sense in their lending practices, and reduce the need for APRA to do more.
Excellent speech from Lawrence Schembri, Deputy Governor, Canadian Association for Business Economics on house price trends. The speech, which is worth reading, contains a number of insightful charts. Australian data is included. He looks at both supply and demand issues, and touches on macroprudential. You can watch the entire speech.
I have highlighted some of the main points:
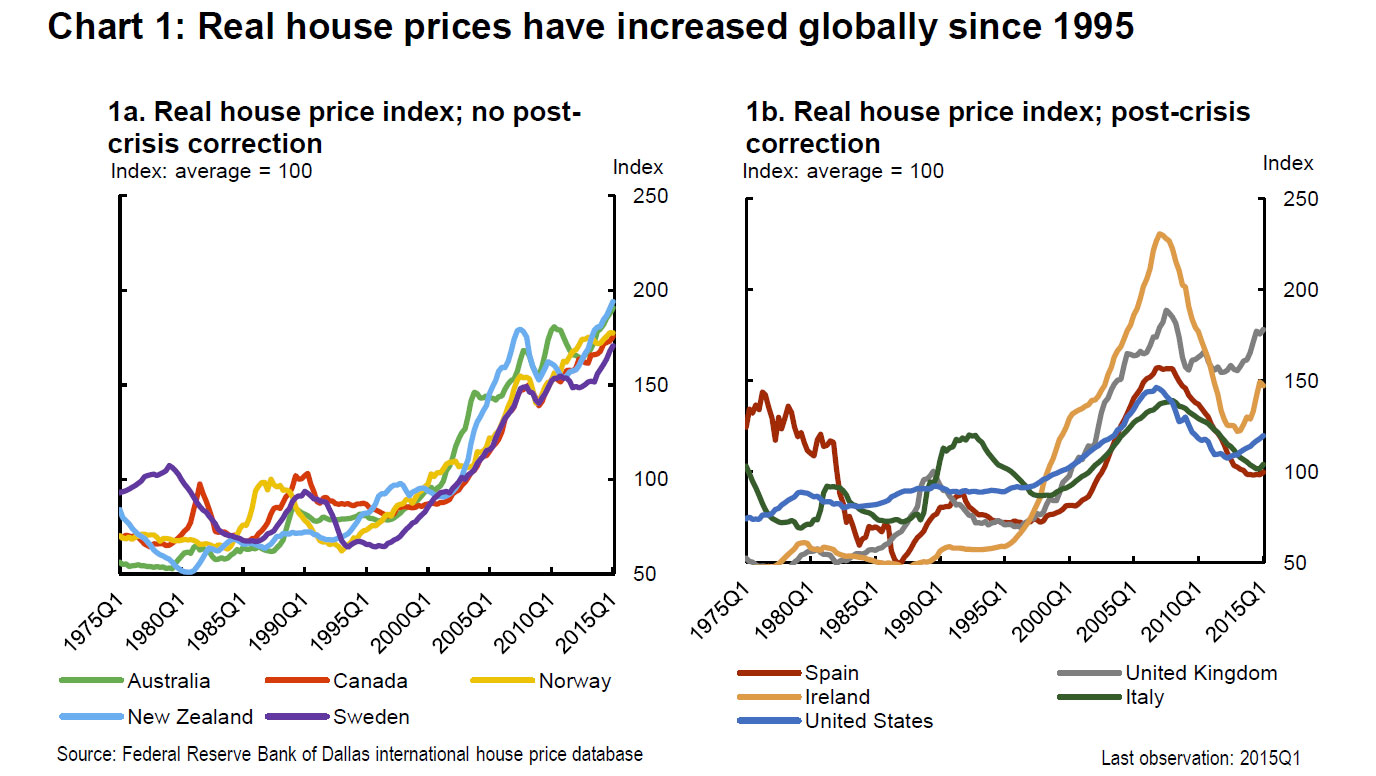
First, Chart 1 shows indexes of real house prices since 1975 for two sets of advanced economies. Chart 1a shows Canada and a set of comparable small, open economies (Australia, New Zealand, Norway and Sweden) with similar macro policy frameworks and similar experiences during and after the global financial crisis. In particular, they did not have sizable post-crisis corrections in house prices. For comparison purposes, Chart 1b shows a second set of advanced economies that did experience significant and persistent post-crisis declines in house prices.
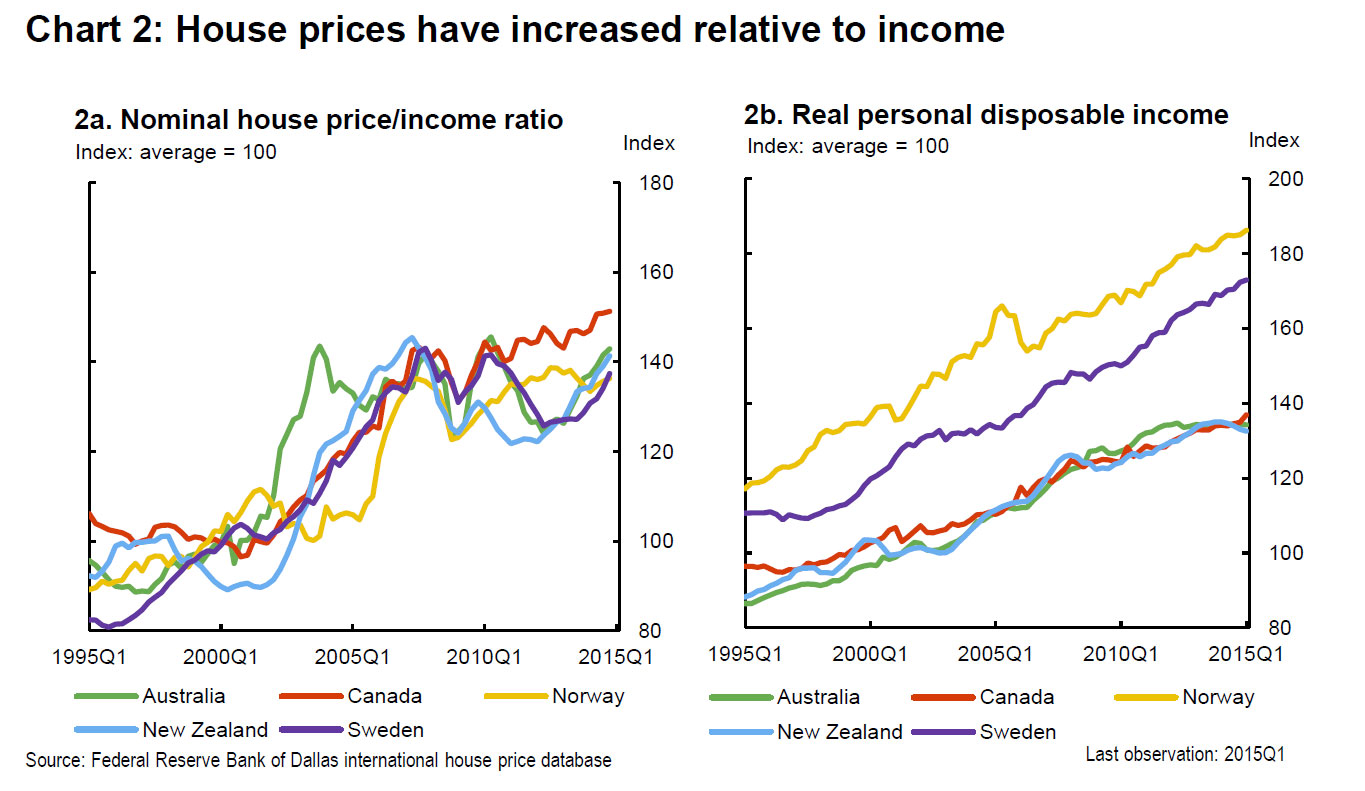
Since 1995, house prices in Canada and the set of comparable countries have increased faster than nominal personal disposable income (Chart 2a). During this period, all of these countries experienced solid income growth, with the strongest growth in Norway and Sweden (Chart 2b).
During the global financial crisis, these countries also experienced house price corrections. This caused the ratios of house prices to income to decline temporarily, after which they continued climbing.
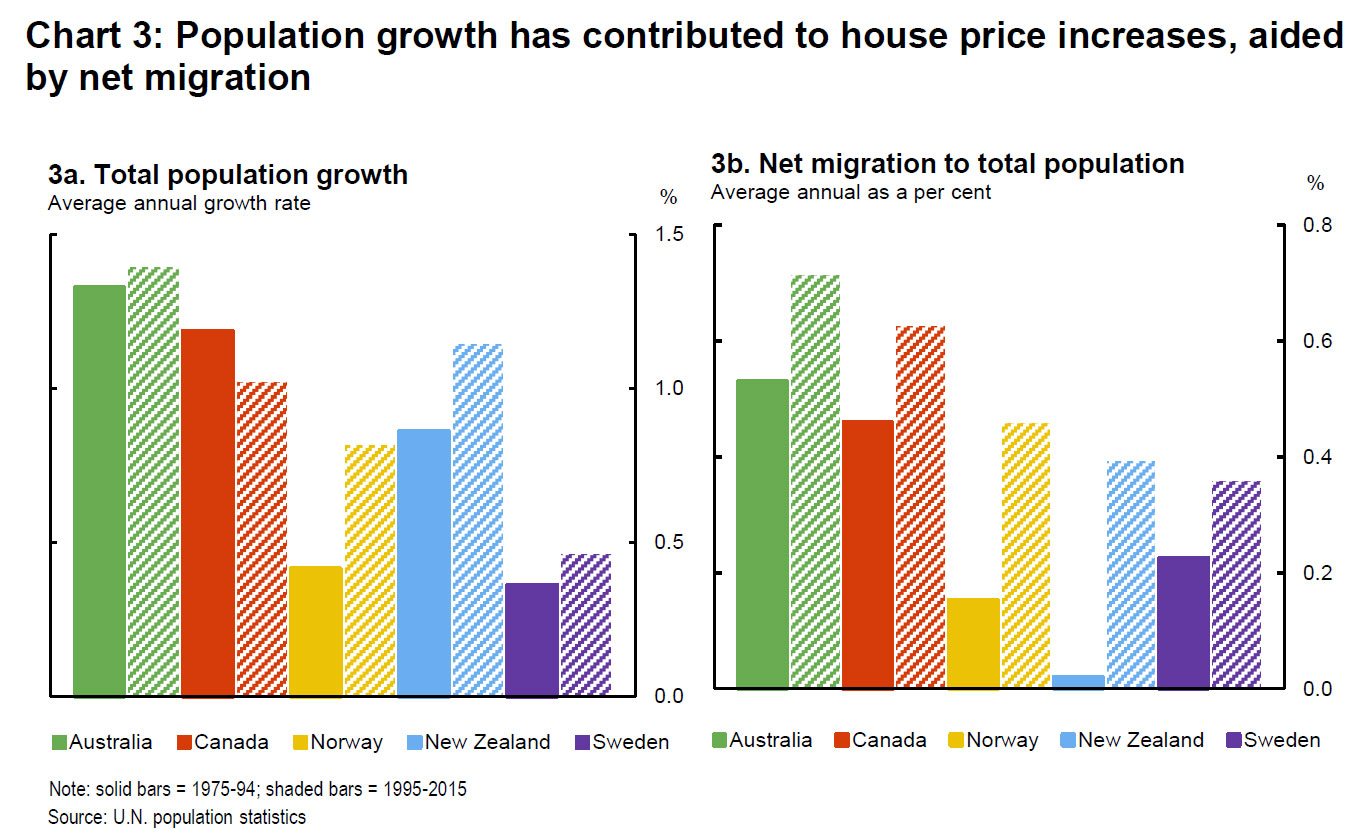
One of the factors that has affected population growth rates is migration. Net migration was highest in Australia and Canada over the entire sample. In addition, net migration increased importantly in all five countries in the second half of the sample period (Chart 3b)
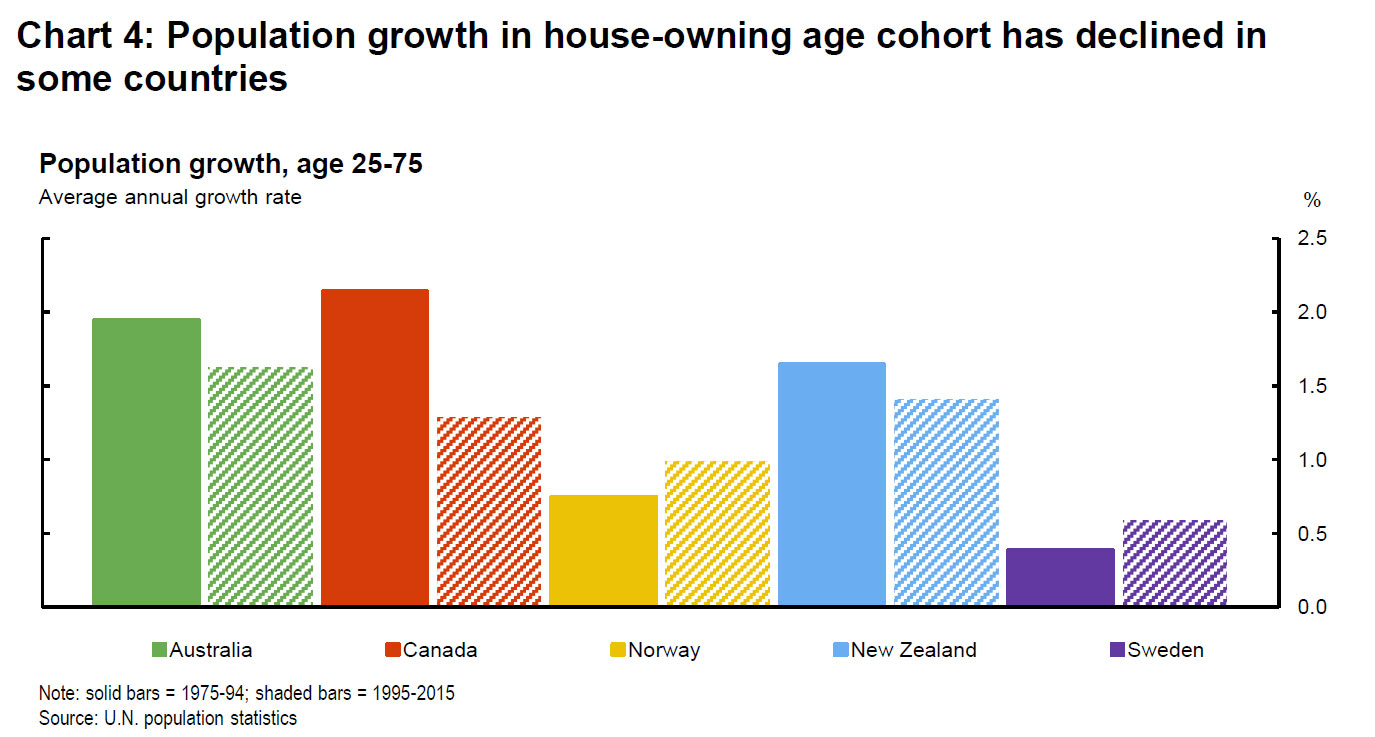
In Australia, Canada and New Zealand, the rate of population growth of the approximate house-owning cohort of those aged 25 to 75 declined in the second part of the sample period. This likely reflects the aging of their populations as the postwar baby boom generation moved from youth into middle age (Chart 4). Nonetheless, the growth rate of this cohort still remains well above 1 per cent for these three countries.
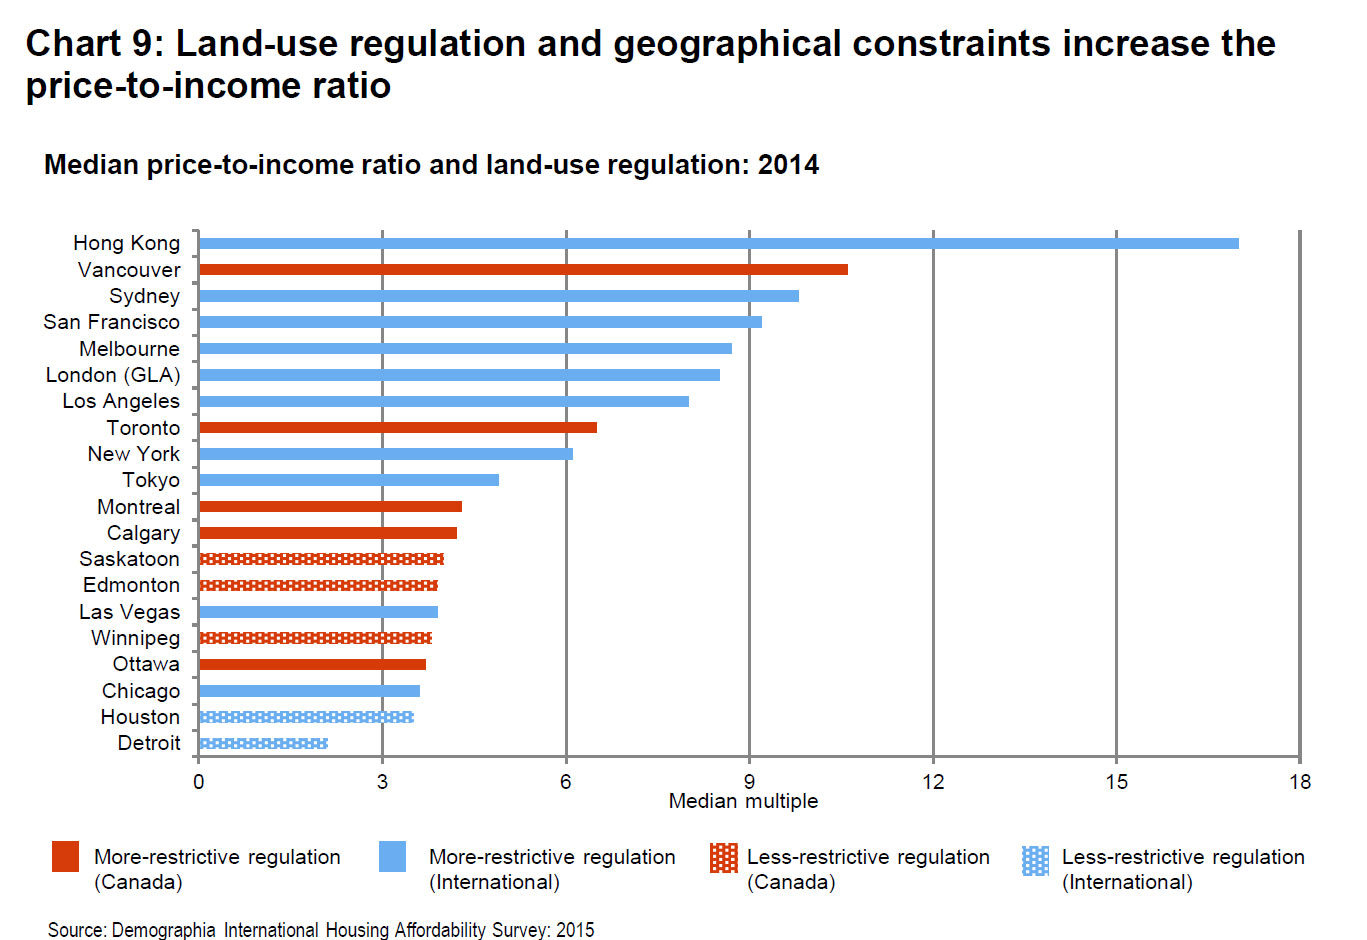
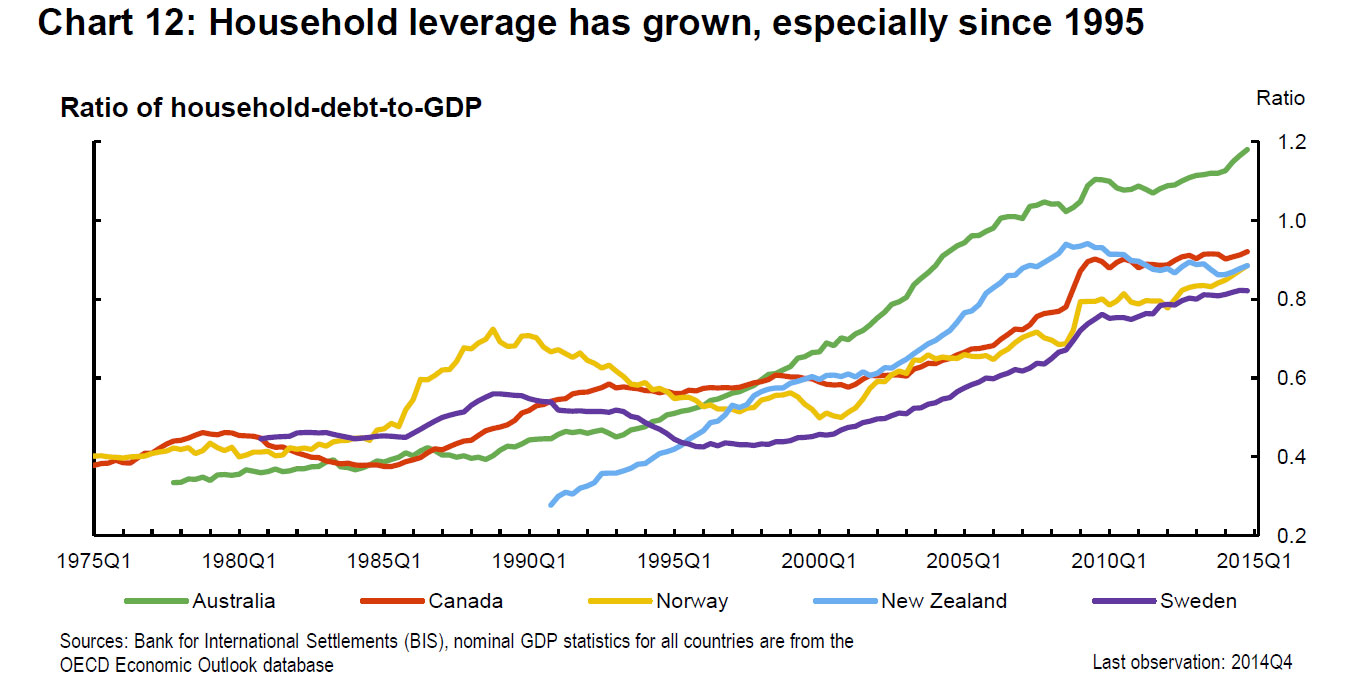
Chart 9 provides some suggestive evidence on the impact of land-use regulations on median price-to-income ratios. Many of the cities with higher ratios also have obvious geographical constraints—Hong Kong and Vancouver are good examples—so the two sources of supply restrictions likely interact to put upward pressure on prices.When we look at the post-crisis experiences of the countries in our comparison group, they have similar levels of household leverage, measured by household debt as a ratio of GDP (Chart 12). Household leverage has risen along with house prices, as households have taken advantage of low post-crisis interest rates. The one exception is New Zealand, where a modest degree of household deleveraging seems to have occurred. For Canada, the ratio of household debt to GDP has risen since 1975, although the growth of this ratio has notably declined since 2010. For Sweden and Norway, the ratio also grew at a modest pace in the post-crisis period. Note Australia has the highest ratios.
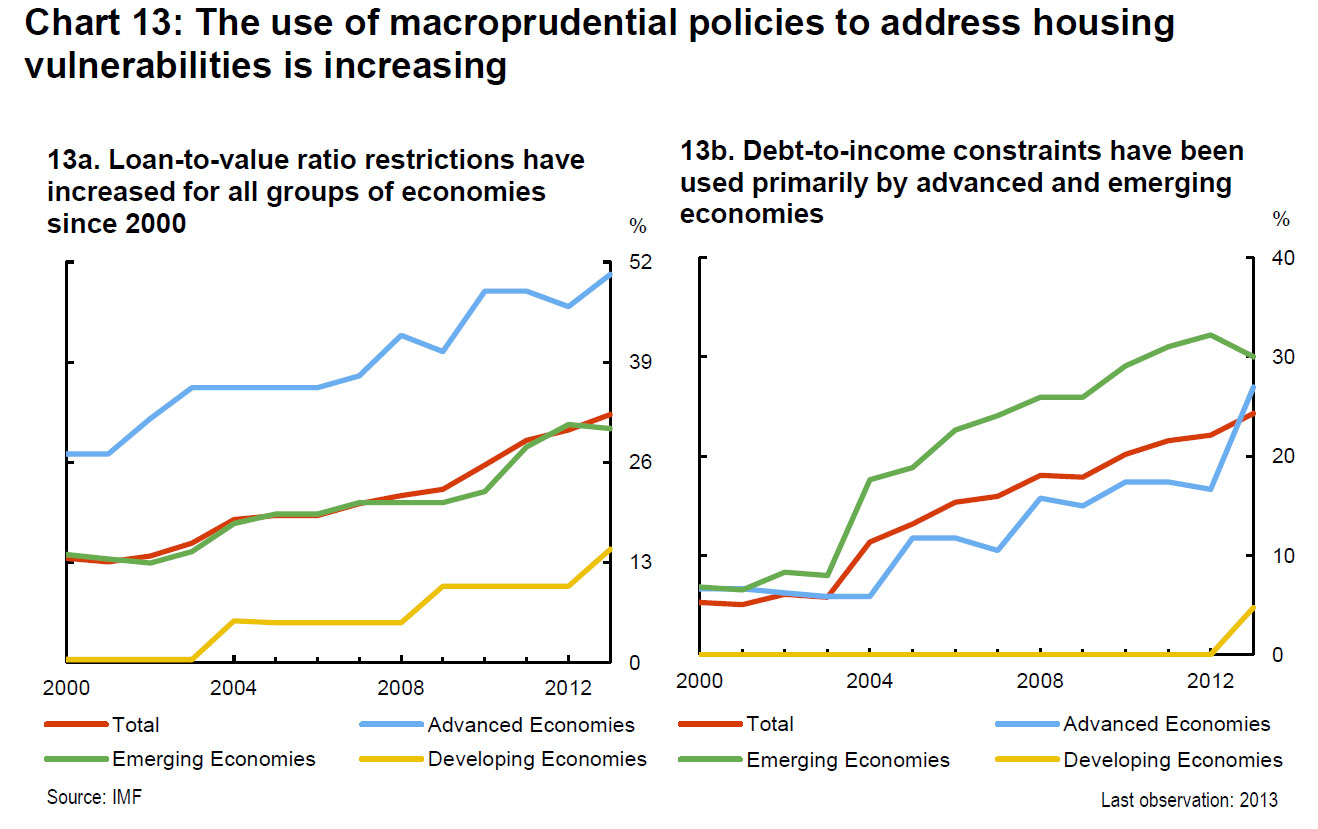
Charts 13a and b draw on recent work by the IMF, which shows that macroprudential policies in the form of maximum loan-to-value (LTV) or debt-to-income (DTI) ratios have tightened across a broad range of countries over the past 10 years. The IMF’s research, as well as that of other economists, has found evidence suggesting that the tightening has helped to: reduce the procyclicality of household credit and bank leverage; moderate credit growth;
improve the creditworthiness of borrowers; and lower the rate of house price growth.
The most effective macroprudential policies to date appear to have been the imposition of maximum LTV and DTI constraints. Increased capital weights on bank holdings of mortgages have also had an impact. While long-term evidence on these instruments is not yet available, permanent measures that address structural regulatory weaknesses and that are relatively straightforward to implement and supervise will likely be the most effective over time.
Interesting to note that in Canada, they have had four successive rounds of macroprudential tightening, primarily in terms of the rules for insured mortgages. The maximum amortization period for insured loans has been shortened from 40 years to 25. LTV ratios have been lowered to 95 per cent for new mortgages, and 80 per cent for refinancing and investor properties. These latter two changes effectively eliminate new insurance for refinancing and investor properties. Qualification criteria such as limits on the total debt-service ratio and the gross debt-service ratio, as well as requirements for qualifying interest rates, have also been tightened.
Conclusion
Let me conclude with a few key points from the mountain of facts, graphs and analysis that I have reviewed with you today. As I mentioned at the outset, the purpose of my presentation is to help provide more context for an informed discussion about housing and house prices given their importance to the Canadian economy and the financial system.
First, real house prices have been rising relative to income in Canada and other comparable countries for about 20 years. There are many possible explanations, mostly from the demand side, but also from the supply side.
Second, in terms of demand, demographic forces, notably migration and urbanization, have played a role in the evolution of house prices, as have improving credit conditions through lower global real long-term interest rates and financial liberalization and innovation. There are, of course, other demand factors that warrant more data and analysis, including the impacts of foreign investment and possible preference shifts.
Third, in terms of supply, the constraints imposed by geography and regulation have decreased housing supply elasticity, especially in urban areas. This reduced supply elasticity has interacted with demand shifts toward more urbanization to push up house prices in major cities.
Fourth, the credible and effective macro and financial policy frameworks in place in Canada and the other countries considered here have contributed to a high degree of macroeconomic and financial stability. Consequently, in the face of a protracted global recovery, their countercyclical policies successfully underpinned domestic demand in the post-crisis period. The resulting strength in the housing market has increased household imbalances, but the risks stemming from these vulnerabilities have been well managed by complementary macroprudential policies.
The experience in these countries therefore suggests that macroprudential policies that address structural weaknesses in the regulatory framework are best suited for mitigating such financial vulnerabilities. They reduce tail risks to financial stability and enhance the overall resilience of the financial system.