BIS Warnings Must Be Heeded

The 85th Annual Report from the Bank for International Settlements has just been released. This is an important document because in its economic chapters the authors attempt to get to grips with some of the critical issues creating uncertainty in the global economy and the financial system.  Here is a summary of the main arguments.

Chapter I: Is the unthinkable becoming routine?

Globally, interest rates have been extraordinarily low for an exceptionally long time, in nominal and inflation-adjusted terms, against any benchmark. Such low rates are the most remarkable symptom of a broader malaise in the global economy: the economic expansion is unbalanced, debt burdens and financial risks are still too high, productivity growth too low, and the room for manoeuvre in macroeconomic policy too limited. The unthinkable risks becoming routine and being perceived as the new normal. This malaise has proved exceedingly difficult to understand. The chapter argues that it reflects to a considerable extent the failure to come to grips with financial booms and busts that leave deep and enduring economic scars. In the long term, this runs the risk of entrenching instability and chronic weakness. There is both a domestic and an international dimension to all this. Domestic policy regimes have been too narrowly concerned with stabilising short-term output and inflation and have lost sight of slower-moving but more costly financial booms and busts. And the international monetary and financial system has spread easy monetary and financial conditions in the core economies to other economies through exchange rate and capital flow pressures, furthering the build-up of financial vulnerabilities. Short-term gain risks being bought at the cost of long-term pain. Addressing these deficiencies requires a triple rebalancing in national and international policy frameworks: away from illusory short-term macroeconomic finetuning towards medium-term strategies; away from overwhelming attention to near-term output and inflation towards a more systematic response to slowermoving financial cycles; and away from a narrow own-house-in-order doctrine to one that recognises the costly interplay of domestic-focused policies. One essential element of this rebalancing will be to rely less on demand management policies and more on structural ones, so as to abandon the debt-fuelled growth model that has acted as a political and social substitute for productivity-enhancing reforms. The dividend from lower oil prices provides an opportunity that should not be missed. Monetary policy has been overburdened for far too long. It must be part of the answer but cannot be the whole answer. The unthinkable should not be allowed to become routine.

BIS-85-1Chapter II: Global financial markets remain dependent on central banks

Accommodative monetary policies continued to lift prices in global asset markets in the past year, while diverging expectations about Federal Reserve and ECB policies sent the dollar and the euro in opposite directions. As the dollar soared, oil prices fell sharply, reflecting a mix of expected production and consumption, attitudes to risk and financing conditions. Bond yields in advanced economies continued to fall throughout much of the period under review and bond markets entered uncharted territory as nominal bond yields fell below zero in many markets. This reflected falling term premia and lower expected policy rates. The fragility of otherwise buoyant markets was underscored by increasingly frequent bouts of volatility and signs of reduced market liquidity. Such signs were perhaps clearest in fixed income markets, where market-makers have scaled back their activities and market-making has increasingly concentrated in the most liquid bonds. As other types of players, such as asset managers, have taken their place, the risk of “liquidity illusion” has increased: market liquidity appears ample in normal times, but vanishes quickly during market stress.

BIS-85-2 Chapter III: When the financial becomes real

Plummeting oil prices and a surging US dollar shaped global activity in the year under review. These large changes in key markets caught economies at different stages of their business and financial cycles. The business cycle upswing in the advanced economies continued and growth returned to several of the crisis-hit economies in the euro area. At the same time, financial downswings are bottoming out in some of the economies hardest-hit by the Great Financial Crisis. But the resource misallocations stemming from the pre-crisis financial boom continue to hold back productivity growth. Other countries, less affected by the crisis, notably many EMEs, are experiencing different challenges. The shift in global conditions has coincided with slowing output growth and peaks in domestic financial cycles. There is the danger that slowing growth in EMEs could expose financial vulnerabilities. Better macroeconomic management and more robust financial structures, including longer debt maturities and reduced exposure to currency risk, have increased resilience. But the overall amount of debt has increased and the shift from banks to capital market funding could raise new risks.

BIS-85-3Chapter IV: Another year of monetary policy accommodation

Monetary policy continued to be exceptionally accommodative, with many authorities easing or delaying tightening. For some central banks, the ultra-low policy rate environment was reinforced with large-scale asset purchase programmes. In the major advanced economies, central banks pursued significantly divergent policy trajectories, but all remained concerned about the dangers of inflation running well below inflation objectives. In most other economies, inflation rates deviated from targets, being surprisingly low for some and high for others. The deviation of inflation from expected levels and questions surrounding the sources of price changes underscore an incomplete understanding of the inflation process, especially regarding its medium- and long-term drivers. At the same time, signs of growing financial imbalances around the globe highlight the risks of accommodative monetary policies. The persistence of those policies since the crisis casts doubt on the suitability of current monetary policy frameworks and suggests that resolving the tension between price stability and financial stability is the key challenge. This puts a premium on accounting for financial stability concerns much more systematically in monetary policy frameworks.

BIS-85-4Chapter V: The international monetary and financial system

The suitable design of international monetary and financial arrangements for the global economy is a long-standing issue. A key shortcoming of the existing system is that it tends to heighten the risk of financial imbalances, leading to booms and busts in credit and asset prices with serious macroeconomic consequences. These imbalances often occur simultaneously across countries, deriving strength from international spillovers of various types. The global use of the dollar and the euro allows monetary conditions to affect borrowers well beyond the respective issuing economies. Many countries also import monetary conditions when setting policy rates to limit interest rate differentials and exchange rate movements against the major currencies. The global integration of financial markets tends to reinforce these dynamics, by allowing common factors to drive capital flows and a common price of risk to move bond and equity prices. Policies to keep one’s own house in order by managing financial cycles would help to reduce such spillovers. In addition,
central banks need to better internalise spillovers, not least to avoid the effects of their actions spilling back into their own economies. Moving beyond enlightened self-interest would require international cooperation on rules constraining domestic policies.

BIS-85-5Chapter VI: Old and new risks in the financial landscape

Risks in the financial system have evolved against the backdrop of persistently low interest rates in advanced economies. Despite substantial efforts to strengthen their capital and liquidity positions, advanced economy banks still face market scepticism. As a result, they have lost some of their traditional funding advantage relative to potential customers. This adds to the challenges stemming from the gradual erosion of interest income and banks’ growing exposure to interest rate risk, which could weaken their resilience in the future. By contrast, EME banks have so far benefited from market optimism amid buoyant conditions that may be masking the build-up of financial imbalances. For their part, insurance companies and pension funds have faced ballooning liabilities and muted asset returns. Asset-liability mismatches are weakening institutional investors and threaten to spill over into the real economy. As these investors offload risks onto their customers and banks retreat from traditional intermediation, asset managers are taking on an increasingly
important role. Regulatory authorities are carefully monitoring the financial stability implications of the growing asset management sector.

BIS-85-6

Does Easing Monetary Policy Increase Financial Instability?

An IMF working paper “Does Easing Monetary Policy Increase Financial Instability?” looks at the interaction between monetary and macro-prudential policies.

Using modelling, they show that that real interest rate rigidities have a different impact on financial stability depending on the sign of the shock hitting the economy. In response to positive shocks to the risk-free interest rate, real interest rate rigidity acts as an automatic macro-prudential stabilizer. This is because higher debt today associated with lower interest rates (relative to the flexible interest rate case) is offset by lower interest repayments, resulting in higher net worth and lower probability of a crisis in the future. In contrast, when the risk-free rate is hit by a negative shock, real interest rate rigidity leads to a relatively higher crisis probability through the same mechanisms working in reverse (borrowing and consumption are relatively lower today, but they are offset by relatively higher debt service tomorrow, resulting in lower future net-worth and higher crisis probability).

In addition, they show that when the interest rate is the only policy instrument to address both the macroeconomic and the financial friction, and a shock that lowers interest rates hits the economy, a policy trade-off emerges. This is because the two frictions require interventions of opposite direction on the same instrument. Other instruments, however, may be at the policy-maker’s disposal in order to achieve and maintain financial stability.

An implication of their analysis is that the weak link in the U.S. policy framework in the run up to the Global Recession was not excessively lax monetary policy after 2002, but rather the absence of an effective regulatory framework aimed at preserving financial stability.

Note that IMF Working Papers describe research in progress by the author(s) and are published to elicit comments and to encourage debate. The views expressed in IMF Working Papers are those of the author(s) and do not necessarily represent the views of the IMF, its Executive Board, or IMF management.


Supervisory Stress Testing of Large Systemic Financial Institutions – The Fed

Interesting speech by Fed Vice Chairman Fischer on supervisory stress testing of large systemic financial institutions.

Stress testing has become a cornerstone of a new approach to regulation and supervision of the largest financial institutions in the United States. The Federal Reserve’s first supervisory stress test was the Supervisory Capital Assessment Program, known as the SCAP. Conducted in 2009 during the depths of the financial crisis, the SCAP marked the first time the U.S. bank regulatory agencies had conducted a supervisory stress test simultaneously across the largest banking firms. The results clearly demonstrated the value of simultaneous, forward-looking supervisory assessments of capital adequacy under stressed conditions. The SCAP was also a key contributor to the relatively rapid restoration of the financial health of the U.S. banking system.

The Fed’s approach to stress testing of the largest and most systemic financial institutions has evolved since the SCAP, but several key elements persist to this day. These elements include, first, supervisory stress scenarios applicable to all firms; second, defined consequences for firms deemed to be insufficiently capitalized; and third, public disclosure of the results.

The Fed has subsequently conducted five stress test exercises that built on the success of SCAP, while making some important improvements to the stress test processes. The first key innovation was the development of supervisory models and processes that allow the Fed to evaluate independently whether banks are sufficiently resilient to continue to lend to consumers and to businesses under adverse economic and financial conditions. This innovation took place over the course of several exercises and was made possible by the extensive collection of data from the banks. These data have allowed supervisors to build models that are more sensitive to stress scenarios and better define the riskiness of the firms’ different businesses and exposures.

The second innovation since the SCAP was the use of the supervisory stress test as a key input into the annual supervisory evaluation of capital adequacy at the largest bank holding companies. The crisis demonstrated the importance of forward-looking supervision that accounted for the possibility of negative outcomes. By focusing on forward-looking post-stress capital ratios, stress testing provides an assessment of a firm’s capital adequacy that is complementary to regulatory capital ratios, which reflect the firm’s performance to date. Although we view this new approach to capital assessment as a significant improvement over previous practices, we are aware that the true test of this new regime will come only if another period of significant financial or economic stress were to materialize–which is to say that we will not have a strong test of the effectiveness of stress testing until the stress tests undergo a real world stress test. The same comment, mutatis mutandis, applies to the overall changes in methods of bank regulation and supervision made since September 15, 2008.

Third, supervisory stress testing has been on the leading edge of a movement toward greater supervisory transparency. Since the SCAP, the Fed has steadily increased the transparency around its stress testing processes, methodologies, and results. Before the crisis, releasing unfavorable supervisory information about particular firms was unthinkable–for fear of setting off runs on banks. However, the release of the SCAP results helped to calm markets during the crisis by reducing uncertainty about firm solvency. Indeed, only one of the 10 firms deemed to have a capital shortfall was unable to close the identified gap on the private markets. Our experience to date has been that transparency around the stress testing exercise improves the credibility of the exercise and creates accountability both for firms and supervisors. That said, too much transparency can also have potentially negative consequences, an idea to which I will turn shortly.

With the benefit of five years of experience, the Fed is continuing to assess its stress testing program, and to make appropriate changes. Examples of such changes to date include the assumption of default by each firm’s largest counterparty and the assumption that firms would not curtail lending to consumers and businesses, even under severely adverse conditions. As part of that assessment process, we are also currently seeking feedback from the industry, market analysts, and academics about the program.

Supervisory stress testing is not a static exercise and must adapt to a changing economic and financial environment and must incorporate innovations in modeling technology. Work is currently underway on adapting the stress testing framework to accommodate firms that have not traditionally been subject to these tests. The Dodd-Frank Act requires the Fed to conduct stress tests on non-bank financial institutions that have been designated as systemically important by the FSOC–the Financial Stability Oversight Council. Three of the currently designated financial institutions are global insurance companies. While distress at these firms poses risks to financial stability, particularly during a stressful period, certain sources of risk to these firms are distinct from the risks banking organizations face. A key aspect of this ongoing work includes adapting our current stress testing framework and scenarios to ensure that the tests for non-bank SIFIs–systemically important financial institutions–are appropriate.

Another area where work continues–and will likely always continue–is the Fed’s ongoing research aimed at improving our ability to estimate losses and revenues under stress. Supervisors have both to develop new approaches that push the state of the art in stress testing and to respond as new modeling techniques are developed or as firm activities and risk concentrations evolve over time. For example, forecasting how a particular bank’s revenue may respond to a severe macroeconomic recession can be challenging, and we continue to seek ways to enhance our ability to do so.

Supervisory stress testing models and methodologies have to evolve over time in order to better capture salient emerging risks to financial firms and the system as a whole. However, the framework cannot simply be expanded to include more and more aspects of reality. For example, incorporating feedback from financial system distress to the real economy is a complex and difficult modelling challenge. Whether we recognize it or not, the standard solution to a complex modeling challenge is to simplify–typically to the minimum extent possible–aspects of the overall modelling framework. However, incorporating feedback into the stress test framework may require simplifying aspects of the framework to a point where it is less able to capture the risks to individual institutions. Even so, one can imagine substantial gains from continued research on stress testing’s role in macroprudential supervision and our understanding of risks to the financial system, such as knock-on effects, contagion, fire sales, and the interaction between capital and liquidity during a crisis.

Finally, let me close by addressing a question that often arises about the use of a supervisory stress test, such as those conducted by the Fed, with common scenarios and models. Such a test may create the possibility of, in former Chairman Bernanke’s words, a “model monoculture,” in which all models are similar and all miss the same key risks. Such a culture could possibly create vulnerabilities in the financial system. At the Fed we try to address this issue, in part, through appropriate disclosure about the supervisory stress test. We have published information about the overall framework employed in various aspects of the supervisory stress test, but not the full details that banks could use to manage to the test. This–making it easier to game the test–is the potential negative consequence of transparency that I alluded to earlier.

We also value different approaches for designing scenarios and conducting stress tests. In the United States, in addition to supervisory stress testing, large financial firms are required to conduct their own stress tests, using their own models and stress scenarios that capture their unique risks. In evaluating each bank’s capital planning process, supervisors focus on how well banks’ internal scenarios and models capture their unique risks and business models. We expect firms to determine the risks inherent to their businesses, their risk-appetite, and to make business decisions on that basis.

RBNZ Updates On Basel III

The NZ Reserve Bank today published an article in the Reserve Bank Bulletin that describes the Reserve Bank’s implementation of the Basel III capital requirements. It is one of the clearest articulation of Basel III that we have read, and is recommended to those seeking to get to grips with the complexity of the evolving capital requirements. In addition, you can read our article on Basel IV (the next iteration) here.

The GFC highlighted several shortcomings in the policies and practices of some financial institutions, particularly in North America and Europe, and in the regulatory requirements for banks in respect of capital. In the lead-up to the GFC, some financial institutions were highly leveraged (that is, their assets were funded by high levels of debt as compared to equity), with capital that proved insufficient to absorb the losses that they incurred. In several countries, governments provided funds to support failing banks, effectively protecting holders of certain capital instruments from bearing losses, which came at a cost to taxpayers. The complexity of capital rules, interaction with national accounting standards, and differences in application resulted in inconsistencies in the definition of regulatory capital across jurisdictions. Further, insufficient capital was held in respect of certain risks. This made it difficult for the market to assess the true quality of banks’ regulatory capital and led some market participants to turn to simpler solvency assessment methods.

The BCBS responded with new requirements for bank capital, collectively known as Basel III, which built on the existing frameworks of Basel I and Basel II. Basel III strengthens the minimum standards for the quality and quantity of banks’ capital, and aims to reduce bank leverage and improve the risk coverage of the Basel Capital Accords. One of the purposes of Basel III is to make it more likely that banks have sufficient capital to absorb the losses they might incur, thus reducing the likelihood that a bank will fail, or that a government will be called on to use taxpayer funds to bail out a bank. Basel III also introduced an international standard on bank liquidity. Overall, these requirements increase resilience in the financial sector and reduce the probability of future systemic collapses of the financial sector.

The RBNZ Bulletin article explains the rationale behind the Basel III capital requirements, identifies and discusses their significant features, explains how the Reserve Bank has applied the requirements in New Zealand, and examines the development of the New Zealand market for instruments meeting the Basel III definition of capital.

The changes to the Capital Accord brought into effect by Basel III included: enhancing the requirements for the quality of the capital base;increasing the minimum amount of capital required to be held against risk exposures; requiring capital buffers to be built up in good times that can be drawn down in times of economic stress; introducing a leverage ratio requirement; and enhancing the risk coverage of the capital framework. Draft international minimum standards for liquidity were also proposed for the first time as part of the Basel III package. The liquidity requirements are not discussed in this article. The Basel III capital standards have been widely adopted worldwide. The Reserve Bank has largely adopted the Basel III capital requirements. As New Zealand banks were well capitalised at the time Basel III was issued, the Reserve Bank was able to put the Basel III capital requirements in place in New Zealand ahead of the timetable set by the BCBS for Basel III implementation.


When monetary policy reaches its limits, what of fiscal policy?

From The Conversation. In a recent address to the Economic Society of Australia, the Reserve Bank Governor Glenn Stevens hit the nail on the head when he remarked that “monetary policy alone can’t deliver everything we need and expecting too much from it can lead, in time, to much bigger problems”.

What was particularly important in this address was the (implicit) suggestion that the answer goes hand in hand with another question; what should we expect from fiscal policy?

Though at first sight it might appear to be a rather tenuous link, a decent review of the taxation system and more generally of the revenue side of the fiscal equation, may be a big help in taking some of the burden off monetary policy from its current constraints.

Stevens is not alone in suggesting that too much might be being expected of central bankers in promoting growth and reducing unemployment. Similar sentiments have come from former Federal Reserve Chairman, Ben Bernanke.

It is useful to distinguish two aspects to the question of whether we expect too much of monetary policy. The first is whether we can expect it to work when the economy is on the downswing in the same degree as when it is on the upswing. In particular, can we expect an easing of monetary policy to stimulate growth as effectively as a tightening of monetary policy can choke it off.

Central banks for the most part have a brief of keeping inflation within a certain range and, with that done, to assist in keeping the economy’s growth rate near to trend; in the best of worlds, consistent with full employment.

Expectations about what more accommodating monetary policy can do for a sluggish economy have at times had to take a reality check here and in other parts of the world. Bringing interest rates down and making the assets side of bank balance sheets more liquid via “quantitative easing” can stimulate the real economy only to the extent that the binding constraint on spending by consumers and business is a financial one.

But in an environment where producers expect sluggish or even falling domestic or export demand, one would also expect to see sluggish investment demand, regardless of interest rates or the willingness of banks to lend. In other words, slow growth in demand may well mean expected rates of return from investment in new plant are revised down as much as interest rates.

As Stevens noted in his address, lower interest rates may not help consumption expenditure much either in present circumstances, since household sector’s debt burden means that it “has the least scope [compared with government and corporations] to expand their balance sheets to drive spending”.

And, as plenty of commentators have noted, injections of liquidity and easing credit conditions may be channelled into financial assets which don’t have significant stimulatory effects on the real side of the economy, which is where we need it for growth and reduced unemployment.

Some have even argued that a lengthy period of easy monetary policy has adverse distributional effects benefiting owners of stock and property. However the precise distributional effects of seem rather complex and less than clear cut, and will depend in part on whether or not accommodatory monetary policy stimulates the economy and hence employment growth.

The second and perhaps broader aspect related to expectations about what monetary policy can and should do is that it is often asked to effectively make use of a limited toolbox to deal with conflicting objectives. One could be forgiven for thinking that in this country we have only one macro policy instrument – interest rates – to both control inflation and manipulate growth in economic activity.

The obvious elephant in the room here is fiscal policy.

In his address Stevens actually raises an old and interesting idea about fiscal policy: that it can have a stimulatory role perfectly consistent with “sound financing” (to borrow a perverted phrase with which Keynes’ was forced to do battle); where stimulatory expenditure and any increased debt are on the capital or investment side of the budget.

Such fiscal stimulus may even have what some economists refer to as a “crowding-in” effect: a positive impact on expectations about growth, as Stevens notes. This idea also provides a bulwark against the nonsense about fiscal contraction or consolidation (as it’s euphemistically called) being necessary to stimulate the economy.

The caution here from the Governor is also sound it seems; that capital expenditure is not overnight, so the confidence boost is probably more important for the short-term than the actual direct impact on government expenditure.

In any case, if fiscal policy in general and government expenditure in particular is to come back into its own as a macro policy instrument, reform of the revenue base and thus the tax system is paramount.

But note here, a significant driver of tax reform should be the sustainable funding of an expenditure side which fulfils its macro economic role as a generator of demand growth and its social role in generating infrastructure.

Tax reform should not be seen exclusively as code for a lower taxes, this being an end, the means to which to point of is government withdrawing from its expenditure responsibilities. Unfortunately, this latter view seems to dominate much discussion in this country.

From a macro policy standpoint, looking at tax or more appropriately at the revenue side of the fiscal equation may well have a positive spin-off for monetary policy, leaving it to focus, if that is the continued wish of the political masters, on inflation.

And if one is worried about complex adverse distributional effects of monetary policy, expenditure on infrastructure, done properly, would surely help redress inequality by lifting the social wage.

Author: Graham White, Associate Professor, School of Economics at University of Sydney

Net Stable Funding Ratio Disclosure Standards – BIS

The Bank for International Settlements has released the template to be used by banks to report their Net Stable Funding Ratio (NSFR). This is a further layer of regulation designed to bolster financial stability.  Supervisors will give effect to the disclosure requirements set out in this standard by no later than 1 January 2018. Banks will be required to comply with these disclosure requirements from the date of the first reporting period after 1 January 2018. The disclosure requirements are applicable to all internationally active banks on a consolidated basis but may be used for other banks and on any subset of entities of internationally active banks to ensure greater consistency and a level playing field between domestic and cross-border banks. The disclosure of quantitative information about the NSFR should follow the common template developed by the Committee.

The fundamental role of banks in financial intermediation makes them inherently vulnerable to liquidity risk, of both an institution-specific and market nature. Financial market developments have increased the complexity of liquidity risk and its management. During the early “liquidity phase” of the financial crisis that began in 2007, many banks – despite meeting the capital requirements then in effect – experienced difficulties because they did not prudently manage their liquidity. The difficulties experienced by some banks arose from failures to observe the basic principles of liquidity risk measurement and management.

In 2008, the Basel Committee on Banking Supervision responded by publishing Principles for Sound Liquidity Risk Management and Supervision (the “Sound Principles”), which provide detailed guidance on the risk management and supervision of funding liquidity risk. The Committee has further strengthened its liquidity framework by developing two minimum standards for funding liquidity. These standards aim to achieve two separate but complementary objectives. The first objective is to promote the short-term resilience of a bank’s liquidity risk profile by ensuring that it has sufficient high-quality liquid assets (HQLA) to survive a significant stress scenario lasting for 30 days. To this end, the Committee published Basel III: The Liquidity Coverage Ratio and liquidity risk monitoring tools. The second objective is to reduce funding risk over a longer time horizon by requiring banks to fund their activities with sufficiently stable sources of funding in order to mitigate the risk of future funding stress. To achieve this objective, the Committee published Basel III: The Net Stable Funding Ratio. The NSFR will become a minimum standard by 1 January 2018. This ratio should be equal to at least 100% on an ongoing basis. These standards are an essential component of the set of reforms introduced by Basel III and together will increase banks’ resilience to liquidity shocks, promote a more stable funding profile and enhance overall liquidity risk management.

This disclosure framework is focused on disclosure requirements for the Net Stable Funding Ratio (NSFR). Similar to the LCR disclosure framework,4 this requirement will improve the transparency of regulatory funding requirements, reinforce the Sound Principles, enhance market discipline, and reduce uncertainty in the markets as the NSFR is implemented.

It is important that banks adopt a common public disclosure framework to help market participants consistently assess banks’ funding risk. To promote the consistency and usability of disclosures related to the NSFR, and to enhance market discipline, the Committee has agreed that internationally active banks across member jurisdictions will be required to publish their NSFRs according to a common template. There are, however, some challenges associated with disclosure of funding positions under certain circumstances, including the potential for undesirable dynamics during stress. The Committee has carefully considered this trade-off in formulating the disclosure framework contained in this document.

The disclosure requirements set out in this document are applicable to all internationally active banks on a consolidated basis but may be used for other banks and on any subset of entities of internationally active banks to ensure greater consistency and a level playing field between domestic and cross-border banks.

Banks must publish this disclosure with the same frequency as, and concurrently with, the publication of their financial statements (ie typically quarterly or semi-annually), irrespective of whether the financial statements are audited.

Banks must either include the disclosures required by this document in their published financial reports or, at a minimum, provide a direct and prominent link to the completed disclosure on their websites or in publicly available regulatory reports. Banks must also make available on their websites, or through publicly available regulatory reports, an archive (for a suitable retention period as determined by the relevant supervisors) of all templates relating to prior reporting periods. Irrespective of the location of the disclosure, the minimum disclosure requirements must be in the format required by this document (ie according to the requirements in Section 2).

Macroprudential Case Studies

The IMF just released a working paper “Experiences with Macroprudential Policy—Five Case Studies” which discusses the implementation of macroprudential policies, mainly to attempt to manage the housing sector at a time of rising prices and high levels of bank lending.

The paper presents case studies of macroprudential policy in five jurisdictions (Hong Kong SAR, the Netherlands, New Zealand, Singapore, and Sweden). The case studies describe the institutional framework, its evolution, the use of macroprudential tools, and the circumstances under which the tools have been used. In all cases macroprudential tools have been used to address risks in the housing market. In addition, some of them have moved to enhance the resilience of their banks to more general cyclical and structural risks.

In all the cases reviewed, the macroprudential tools have been used primarily to address risks in the real estate sector. Partly for this reason, the loan-to-value (LTV) limit was the most popular macroprudential tool, used in the five cases. Some jurisdictions have used multiple tools to help the effectiveness of the measures. For instance, Hong Kong SAR and Singapore have used the debt service–to-income (DSTI) ratio and taxes applied to real estate transactions along with the LTV ratio. Sweden and Hong Kong SAR also have imposed additional capital requirements for mortgages.

To enhance the resilience of the banking system, some authorities in these five cases also have used, or plan to use, additional macroprudential tools to address risk in the time and structural dimensions. Most of these measures were adopted in response to the global financial crisis. New Zealand, for instance, moved quite quickly compared to other countries and imposed liquidity requirements to contain bank funding risks, and gradually increased the requirement. Sweden did the same in 2013. Banks in both countries rely heavily on wholesale funding. Countercyclical capital buffers will take effect in Sweden in the Fall of 2015 and in Hong Kong SAR in phases beginning 2016, while the Netherlands intends to impose them too. Furthermore, systemically important institutions will have to hold additional capital buffers starting in 2015 in Sweden and 2016 in Hong Kong SAR and the Netherlands.

It is too early to gauge the full impact of the measures that have been undertaken. In addition, some measures will only take effect in the future. Nevertheless, there is some early evidence that the implementation of macroprudential measures have enhanced banking system resilience and helped reduce the build-up of housing sector leverage in the cases reviewed. For instance, LTV ratios declined in Hong Kong SAR, New Zealand, and Singapore following the adoption of LTV limits. House prices growth was also affected. For example, the rate of growth of house prices peaked in New Zealand following the imposition of a cap on LTVs. House prices also leveled off in Hong Kong SAR under the combined weight of macroprudential tools and taxes, with the taxes appearing to have a more immediate impact.

CONCLUDING REMARKS
Increasing attention has been given to the field of macroprudential policy following the global financial crisis. This paper reviews the use of macroprudential policy in five economies (Hong Kong SAR, the Netherlands, New Zealand, Singapore, and Sweden). All these jurisdictions actively implemented macroprudential policy measures following the global financial crisis. The analysis shows that each jurisdiction reviewed adopted an institutional framework for macroprudential policy suited to their own circumstances. The evidence reviewed confirms that “one size does not fit all,” and that it is possible to conduct macroprudential policy with a heterogenous set of institutional frameworks. In all cases, most of the macroprudential tools used were directed at containing risks arising from a booming housing market (for e.g., LTV and DSTI ratio limits). Some of the cases studied also took steps to enhance the resilience of the banking system to more general cyclical and structural risks (for e.g., liquidity requirements and additional capital requirement for systemically important institutions). While there is some early evidence that the measures taken have enhanced banking system resilience, it is still early to determine their full impact.

Note: The views expressed in this Working Paper are those of the author(s) and do not necessarily represent those of the IMF or IMF policy. Working Papers describe research in progress by the author(s) and are published to elicit comments and to further debate.

Structural Features of Australian Residential Mortgage-backed Securities

The RBA has published a paper on Structural Features of Australian Residential Mortgage-backed Securities. It provides a useful overview of the securitisation market in Australia, which is one important element in product funding. We have summarised some of the key points.

A residential mortgage-backed security (RMBS) is a collection of interrelated bonds that are secured by a dedicated pool of residential mortgages (the ‘mortgage collateral pool’). The payments of principal and interest on these bonds are funded from the payments of principal and interest made on the underlying mortgage collateral by the mortgagors. Historically, RMBS have provided an alternative to bank deposits as a source of funding for residential mortgages. This has been particularly important for smaller authorised deposit-taking institutions (ADIs) and non-ADIs that have limited access to deposit funding or term funding markets.

Securitisation-SchematicBy allowing smaller institutions to raise funding in the capital markets, RMBS promote competition between lenders in the residential mortgage market. After increasing steadily in the early 2000s, issuance of Australian RMBS to third-party investors fell in the wake of the global financial crisis when these securities were adversely affected by a loss of confidence in the asset class globally despite the low level of mortgage defaults in Australia. The market has recovered somewhat over the past couple of years.

RMBS-June-2015RMBS have been an eligible form of collateral in repurchase agreements (repos) with the RBA since 2007. During the height of the global financial crisis, RMBS formed a significant part of the RBA’s repo collateral and hence played an important role in the RBA’s response to the crisis. Currently, RMBS form the largest class of securities held under the RBA’s repos, although unlike the earlier episode, this has been in response to innovations in the payments system. From 1 January 2015, the RBA has provided a Committed Liquidity Facility (CLF) to eligible ADIs as part of Australia’s implementation of the Basel III liquidity standards. In total, the CLF provides ADIs with a contractual commitment to $275 billion of funding under repos with the RBA, subject to certain conditions. Given that RMBS are eligible collateral that could be provided to the RBA were the CLF to be utilised, they represent a substantial contingent exposure for the RBA and, hence, understanding RMBS is particularly important in terms of managing the RBA’s balance sheet.

While discussions of RMBS often focus on the mortgage collateral pool, as all payments to investors are made from the cash flows generated from this pool, the structural features of RMBS play an equally  important part in determining the risks facing the holders of these securities. The ‘structure’ of an RMBS refers to the number and size of the interrelated bonds of the RMBS, the rules that determine how payments are made on these bonds and various facilities that support these payments.

This article provides a summary of the structural features typically found in Australian RMBS and how these have evolved over the past decade.

One element of note is tranching.

Securitisation-Tranching-June-2015In summary, tranching enhances one part of the RMBS liability structure at the expense of another, by reducing credit and prepayment risk on the senior notes, while increasing these risks for the junior notes. Since 2005, there has been an increase in the degree of tranching in Australian RMBS. The average number of notes in an RMBS has increased from three in 2005 to four in 2015, with most of the increase occurring after 2008. The increase has been concentrated in the junior notes (which are typically rated below AAA), with the average number of such notes increasing by 1.5 per RMBS. The increase has been more pronounced in RMBS issued by non-ADIs.

The higher number of tranches for RMBS issued by non-ADIs reflects the need for non-ADI sponsors to fund their mortgage lending fully through RMBS issuance. This has led RMBS issued by non-ADIs to be structured with a larger number of tranches with different characteristics that appeal to a broad range of investor risk appetites.

The structures of Australian RMBS have evolved over time. Australian RMBS have generally become more structured over the past 10 years, especially since the global financial crisis: the tranching of both credit and prepayment risk has increased; the use of principal allocation mechanisms that vary over the life of the RMBS has become more widespread; bullet notes have been added; and various external and internal support facilities have continued to be used.

The increased structuring, which has developed to address changing market conditions, does not necessarily create more risk for investors, especially if they are provided with transparent and complete information about RMBS structures. Indeed, there has been a significant increase in the size of the credit enhancement provided to the most senior notes through the subordination of junior notes, with the increase in excess of the requirements of the credit rating agencies. The reliance on external credit support from LMI has also declined.

Understanding RMBS structures is essential to the effective risk management and valuation of RMBS because the RMBS structure determines how the risks generated from the securitised mortgages are borne by each particular RMBS note. Given the importance of RMBS as collateral in the RBA’s repurchase agreements, the RBA has a keen interest in understanding RMBS structures.

The RBA’s reporting requirements for repo-eligible asset-backed securities, which come in effect from 30 June 2015, will provide standardised and detailed information, not only on the mortgages backing RMBS, but also on the RMBS structures, including their cash flow waterfalls.


Wage Growth Decline

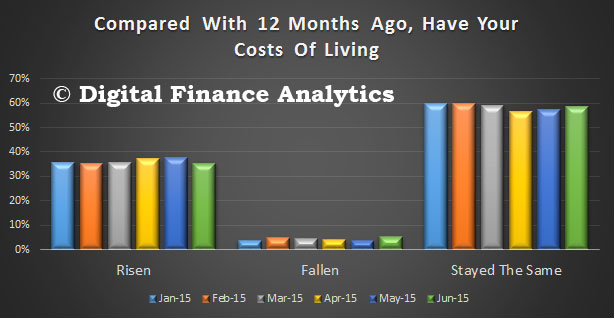
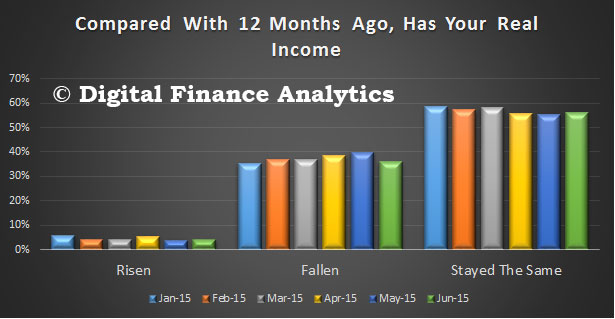
The RBA published a paper on The Decline in Wage Growth. In real terms wages are static or falling for many, and we note from our own surveys that as a result, households are under increasing stress, because costs of living continue to rise. In fact the recent cuts in the mortgage rate as the cash rate has fallen, as effectively got people off the hook. This would reverse quickly if rates started to rise, because the average mortgage is bigger now, and held for longer. But whats behind the decline? We summarise the discussions.


The rate of wage growth has important implications for the macroeconomy. Wages are the largest source of household income and the largest component of business costs, and so have significant implications for consumer price inflation. Wage growth has declined markedly in recent years to the lowest pace since at least the late 1990s, according to the wage price index.

Wage-Price-Trend-2015Wage measures with a longer history suggest that this has been the longest period of low wage growth since the early 1990s recession. Across these measures, the rate of annual wage growth has declined to around the pace of inflation, about 2–3 per cent. The slowing in wage growth has occurred alongside faster growth in labour productivity. This has also helped to moderate growth in labour costs for firms, beyond the impact of lower wage growth. Accordingly, growth in the labour cost of producing a unit of output (unit labour costs, or ULCs) has also declined markedly since 2012. Indeed, the level of ULCs has been little changed for more than three years – the longest such period since the early 1990s.

Even accounting for temporarily lower inflation expectations, real wage growth from the perspective of consumers has declined markedly, to around zero.

Real-Wage-Growth-2015The recent low wage growth has not been unique to Australia. Internationally, wage growth has been lower than forecast for several developed economies in recent years, including some where labour markets have tightened considerably. Various factors have been proposed to explain this weakness, including secular trends that have been in place for some time and have also resulted in a general decline in the labour share of income. However, the decline in wage growth in Australia stands out, with the extent of the forecast surprise for Australia particularly large in the context of OECD countries in recent years

Wage-Growth-OECD-2015Several factors appear to explain much of the decline in Australian wage growth. There has been an increase in spare capacity in the labour market, and expectations of future consumer price inflation have declined to be a bit below average. Inflation in output prices in recent years has been particularly subdued, in large part owing to the lower terms of trade. More generally, the decline in the terms of trade and fall in mining investment in recent years mean that the economy requires a lower ‘real’ exchange rate, which has been in part delivered by low wage growth. A statistical model indicates that these factors do not fully explain the extent of decline in wage growth, suggesting that other factors, such as an increase in the flexibility of wages to market conditions, may also have contributed.


A range of related factors appear to explain much of the decline in wage growth in Australia in recent years. Below-average growth in economic activity has translated into subdued growth in labour demand, which has resulted in an increase in spare capacity in the labour market. At the same time, expectations for consumer price inflation have moderated to be below average. The decline in the terms of trade and falls in mining investment appear to have played a particularly important role, weighing on economic activity and placing pressure on firms to contain costs. This has partly unwound the relatively strong inflation in Australian unit labour costs over the period of the mining boom, which was part of the economy’s adjustment to the domestic income boost from the higher terms of trade. Altogether, the result has been an adjustment in Australia’s relative labour costs, improving cost competitiveness against other advanced economies. In effect, this has assisted in bringing about some adjustment of the real exchange rate. Statistical estimates suggest that these factors explain much, but not all, of the episode, meaning there may also have been some other forces at play including an improvement in the flexibility of wages.

While a large wage adjustment has taken place, wage growth is widely expected to remain low. Evidence from the Bank’s liaison with businesses, alongside surveys of firms and union officials, suggest that the general pace of wage growth is not expected to pick up over the year ahead. One further factor that may continue to weigh on wage growth is a ‘pent-up’ adjustment. Reports through the Bank’s business liaison in recent years have indicated that many firms and employees have been reluctant to bargain for wage growth below expected inflation of 2–3 per cent. Accordingly, wage outcomes of 2–3 per cent have been relatively common over the past couple of years among liaison contacts. Outcomes lower than this, which would imply a fall in real consumer wages, are generally seen to have a negative effect on worker morale and productivity, as well as on the retention of quality staff. So while the decline in wage growth has been large, it might have been larger still if not for this element of rigidity in real wage growth. Accordingly, a degree of ‘pent-up’ downward pressure on wage growth might remain for a time, even if labour market conditions more generally were to improve.

Bank Fees $12 Billion in 2014

The RBA just published the results of its annual bank fee survey, based on data from 16 institutions covering 90% of the Australian banking sector. Last year, overall fees rose 2.8% to $12 billion compared with 2.6% the previous year. The rise is a combination of rises in unit prices, and volumes. Households fees rose 1.5% to $4,141 million, and business grew 3.5% to $7,791 million. The data does not include wealth management, broker, loan mortgage insurance, or other fees across financial services and the non-bank sector.

Looking in more detail at households, higher fee income reflected growth in credit card and personal lending fees, whereas fee income from housing lending and deposit accounts declined.

Household-Fees-2014Fee income from credit cards, which represents the largest component of fee income from households, increased by 5.9 per cent. You can read our previous analysis of the credit card business here.

Total deposit fee income decreased slightly in 2014, following a modest increase in 2013. The decrease in fees from household deposits was broad based across most types of fees on deposit accounts. In particular, account-servicing and transaction fee income, as well as some fee income on other non-transaction accounts (e.g. break fees on term deposit accounts) declined notably. This decrease was the result of fewer customers incurring these fees rather than a decrease in the level of fees, as well as customers shifting to lower fee products. However, this was partially offset by an increase in income from more frequent occurrences of exception fees (such as overdrawn fees and dishonour fees) and foreign exchange conversion fees being charged on deposit accounts involving such transactions.

Total fee income from housing loans decreased in 2014, with all components of housing loan fee income decreasing, including exception fees. This was due to a combination of fewer instances of penalty fees being charged, and lower unit fees as a result of strong competition between banks in the home lending market. Similar to 2013, there was a decrease in fee income from housing lending despite strong growth in such lending. Several banks again reported waiving fees on this type of lending for some customers.

Fees to business rose, across both small and large businesses.

Business-Fees-By-Coy-Size-2014Growth was driven by increases in merchant service fee income and, to a lesser extent, fee income from loans. Business fee income from deposit accounts and bank bills declined over 2014.

The increase in merchant service fees was mainly attributable to an increase in utilisation of business credit cards and a slight increase in some merchant unit fees. Merchant fee growth was approximately evenly spread across both small and large businesses. The increase in loan fee income was mainly from an increase in account-servicing and exception fees from small businesses, which was a result of higher lending volumes (including through the introduction of some new lending products). Fee income from loans to large businesses increased slightly due to a higher volume of prepayment fees (though this was mostly offset by declines in other fee income from large businesses).

The increase in exception fee income from business loans was also mainly from small businesses, mostly in the form of honour fees (fees charged in association with banks honouring a payment despite insufficient funds in the holder’s account).

Fee income from business deposits continued to decline in 2014, with most of the decrease resulting from lower account-servicing and transaction fees, particularly for small businesses (small businesses account for the majority of business deposit fee income). The decrease was the result of a combination of lower volume growth and customers shifting to lower fee products.

Business-Fees-By-Type-2014  We observe that the “fee wars” appears to be over now (triggered by NAB a few years ago), and we expect to see subtle rises in fees as bank margins come under increasing pressure. Also, small business bears the brunt of the charges across a number of categories, and we expect this to continue, because the sector is under less pressure from a bank competitive standpoint, and many SME’s have no where else to go.