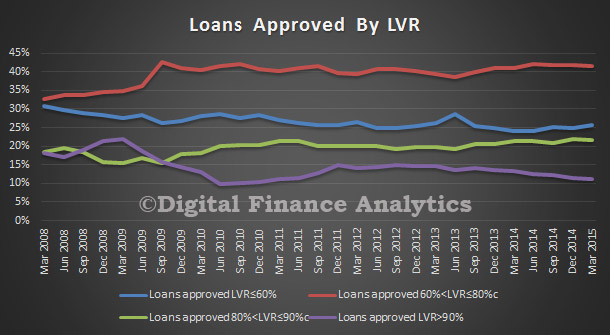
RBNZ Announces New LVR Restrictions on Auckland Housing

New Zealand’s financial system is sound and operating effectively, but faces significant risks, Reserve Bank Governor, Graeme Wheeler, said today when releasing the Bank’s May Financial Stability Report.

Mr Wheeler identified three systemic risks facing the New Zealand financial system.

“Auckland’s median house price is 60 percent above its 2008 level, and house prices in Auckland have been rising rapidly since late last year. This reflects ongoing supply constraints and increased demand, driven by record net immigration, low interest rates and increasing investor activity. Prices in the Auckland region have become very stretched, increasing the risk of financial instability from a sharp correction in prices.

“A second area of risk for the financial system relates to the dairy sector, which is experiencing a sharp fall in incomes due to lower international prices. Many highly leveraged farms are facing negative cash-flows, and the risks will become more pronounced if low milk prices persist beyond the current season.

“The third key risk arises from the current very easy global financial conditions. Low interest rates are encouraging investors into riskier assets in the search for yield. Prices of both financial and real assets are becoming overextended in many markets. There is an increasing risk that the current benign conditions unwind in a disorderly fashion, disrupting the cost and availability of funding for the New Zealand financial system.”

LVR Restrictions

In response to the growing housing market risk in Auckland, the Reserve Bank is today announcing proposed changes to the loan-to-value ratio (LVR) policy. The policy changes, proposed to take effect from 1 October, will:

• Require residential property investors in the Auckland Council area using bank loans to have a deposit of at least 30 percent.

• Increase the existing speed limit for high LVR borrowing outside of Auckland from 10 to 15 percent, to reflect the more subdued housing market conditions outside of Auckland.

• Retain the existing 10 percent speed limit for loans to owner-occupiers in Auckland at LVRs of greater than 80 percent.

“We are proposing these adjustments to the LVR policy to more directly target investor activity in the Auckland region, where house prices relative to incomes and rent are far more elevated than elsewhere in New Zealand.

“The objective of this policy is to promote financial stability by reducing the rate of increase in Auckland house prices, and to improve the resilience of the banking system to a potential downturn in the Auckland housing market.”

Mr Wheeler emphasised that while the new measures aim to moderate housing demand, policies to ease housing supply constraints in Auckland remain the key to addressing the region’s housing imbalances over the longer term.

Deputy Governor, Grant Spencer, said that the Bank will issue a consultation paper in late May, providing further details and seeking feedback on the new LVR proposals.

“Prior to the proposed introduction of the policy in October, we expect banks to observe the spirit of the restrictions and not seek to expand high-LVR investor lending in Auckland.

“Given the importance of encouraging residential construction activity in Auckland, and consistent with the existing LVR policy, the proposed LVR restrictions will not apply to loans to construct new houses or apartments.

“Consistent with the LVR measures, the Reserve Bank is establishing a new asset class for bank loans to residential property investors. Banks will be expected to hold more capital against this asset class to reflect the higher risks inherent in such lending.

“Following a lengthy consultation process, we have decided that a residential property investor loan will be defined as any retail mortgage secured on a residential property that is not owner-occupied.”

A summary of submissions received in response to the consultation will be released later this month, and details will be provided on the implementation of the new asset class, including on the proposed capital treatment of residential investor loans.

The new asset class will take effect from 1 October 2015 for new lending, with a further phase-in period of nine months for the reclassification of existing loans.

“Given the broader risks facing the financial system, it is crucial that banks maintain their capital and liquidity buffers and apply prudent lending standards. Later this year the Reserve Bank will be reviewing bank capital requirements in light of global and domestic developments affecting the safety of the banking system,” Mr Spencer said.

Investor Loans Still Hot – ABS

The ABS released their housing finance data to March 2015. Pretty common story, with the trend estimate for the total value of dwelling finance commitments excluding alterations and additions rising 0.8%. Owner occupied housing commitments rose 0.8% and investment housing commitments rose 0.8%.  In trend terms, the number of commitments for owner occupied housing finance rose 0.4% in March 2015.

In trend terms, the number of commitments for the purchase of established dwellings rose 0.7%, while the number of commitments for the construction of dwellings fell 1.4% and the number of commitments for the purchase of new dwellings fell 0.1%. The growth in investor property loans continued, with more than half in March (excluding refinance). Refinancing also grew in value and in percentage terms, from 18% of all loans a year ago, to over 20%, stimulated by ultra low rates.

Housing-FinanceMarch2015Looking at the First Time Buyer data, in original terms, WA had the highest share of FTB, and NSW the lowest.

FTBCountByStateMarch2015The percentage of FTB compared with all dwellings is relatively static.

FTBMarch2015However, if we overlay the DFA survey data on first time buyers who are going straight to investment property, this continues to rise, and pushes the true number of FTB higher. We continue to see a rotation away from owner occupation to investor first time buyers.

All-FTBMarch2015


Bank of England Maintains Bank Rate at 0.5%

The Bank of England’s Monetary Policy Committee at its meeting on 8 May voted to maintain Bank Rate at 0.5%. The Committee also voted to maintain the stock of purchased assets financed by the issuance of central bank reserves at £375 billion.  The Committee’s latest inflation and output projections will appear in the Inflation Report to be published at 10.30 a.m. on Wednesday 13 May. At the same time, an open letter from the Governor to the Chancellor of the Exchequer will be published, following the release of data for CPI inflation of 0.0% in March.

The previous change in Bank Rate was a reduction of 0.5 percentage points to 0.5% on 5 March 2009. A programme of asset purchases financed by the issuance of central bank reserves was initiated on 5 March 2009. The previous change in the size of that programme was an increase of £50 billion to a total of £375 billion on 5 July 2012.

The Bank will continue to offer to purchase high-quality private sector assets on behalf of the Treasury, financed by the issue of Treasury bills, in line with the arrangements announced on 29 January 2009 and 29 November 2011.

Credit Losses At Australian Banks Are All About Lending Standards – RBA

A very timely paper from David Rodgers at the Economic Research Department RBA. An analysis of credit losses in the banking system highlights the importance of lending standards, and that although up to now higher risks lay in the business sector, lending standards in the household sector, especially with the concentration on housing lending,  are critically important (and we would add in the light of current household debt ratios, see the earlier post). A rise in unemployment on par with that in the early 1990s could be expected to have a more severe influence on household credit losses, given the large rise in household indebtedness over the intervening period. A corollary of this rise in household indebtedness is the greater share of banks’ lending now made up by housing and personal lending. These considerations suggest that any weakening in lending standards in these areas could have a larger systemic impact than in the past.

Credit risk – the risk that borrowers will not repay their loans – is one of the main risks that financial intermediaries (such as banks) face. Credit risk has been the underlying driver of most systemic banking crises in advanced economies over recent decades. As credit risk materialises and borrowers fail to make repayments, banks are forced to recognise the reduction in current and future cash inflows this represents. These ‘credit losses’ reduce a bank’s profitability and can affect capital. In extreme cases, credit losses can be large enough to reduce a bank’s capital ratio below regulatory requirements or minimum levels at which other private sector entities are willing to deal with a bank, so can cause banks to fail.

This paper explores the historical credit loss experience of the Australian banking system. It does so using a newly compiled dataset covering the bank-level credit losses of larger Australian banks over 1980 to 2013. Portfolio-level credit loss data – data that break losses down by type of lending (e.g. business, housing and personal lending) – are available for a broad range of banks only from 2008 onwards, so this paper mainly uses total loan portfolio data. This paper provides the first narrative account of banking system credit losses in Australia that includes both the early 1990s and global financial crisis episodes.

Credit losses in Australian banking in the post-deregulation period have been concentrated in two episodes: the very large losses around the early 1990s recession and the smaller losses during and after the global financial crisis. They have a close temporal relationship with the economic cycle, peaking close to troughs in GDP during downturns. A narrative account attributes the key roles indriving credit losses to business sector conditions such as business indebtedness and commercial property prices. The available data on portfolio-level losses indicate that elevated losses during these downturns stemmed from banks’ lending to businesses, rather than their lending to households. Data available from 2008 onwards indicate losses on housing loans barely rose (from very low levels) during the global financial crisis, even though housing prices and employment fell noticeably in some geographical areas.One of the main contributions of this paper is an econometric panel-data model that properly controls for bank-level portfolio composition. This model indicates business sector conditions, rather than household sector conditions, have been the driver of domestic credit losses over the period studied. The relevant business sector conditions – interest burden, profitability and commercial property prices – are indicators of the ability of this sector to service its debts and of the value of the collateral behind these debts. As a corollary, the model indicates that most losses over the past three decades were incurred on banks’ business lending, and household losses were largely unresponsive to economic conditions in that period. Unlike past work, these results are consistent with the narrative account of credit losses in Australian banking.

Descriptive accounts attribute the scale of losses during the early 1990s to poor lending standards, and the data support this. One piece of evidence, based on quantile regressions, indicates that changes in macro-level conditions have had very different impacts upon banks with similar portfolios (in terms of the shares of business, housing and personal lending). Most compellingly, standard models cannot explain the extremely high credit losses experienced at some state government-owned banks in the early 1990s. Given the anecdotal evidence that these banks had below-average lending standards, this is consistent with the conclusion that poor lending standards have caused the very worst credit loss outcomes over recent decades.

These conclusions have practical implications for stress testing. The credit loss models in this paper that use least squares estimation, and include bank-level variables, are unable to explain, and so unlikely to predict, the very worst credit loss outcomes. Many stress-testing exercises use similar (and in some cases simpler) econometric models (see, for example, IMF (2012)). As the worst credit loss outcomes are the most relevant when stress testing, this suggests that alternative models are needed. Covas, Rump and Zakrajsek (2013) show that a type of quantile regression (quite different to that in this paper) can provide out-of sample forecasts that encompass the credit losses experienced by the US banking system during the global financial crisis. In an Australian context, Durrani, Peat and Arnold (2014) show that allowing variation in credit risk outcomes across banks, rather than applying the same average risk parameters to all banks, can lead to significantly larger loss estimates. Stress-testing models could also be improved by incorporating better data on lending standards. The Federal Reserve collects and makes use of loan-level data on borrower characteristics in its annual stress tests of the largest US banks (Board of Governors 2014). This captures some aspects of the risk profile of borrowers; more work is probably needed to make it possible to systemise and accurately record banks’ lending standards.

The historical experience of credit losses at Australian banks this paper describes should help to guide overall understanding of the credit risk they currently face. It supports a continued focus on the analysis of the financial health of the business sector (one output of this work is a chapter of the Reserve Bank’s semiannual Financial Stability Review). As another example, credit loss measures appear to peak before asset performance measures, potentially providing an early signal of future improvement in financial system stability.

The lack of a historical relationship between household sector conditions and credit losses should be used cautiously in contemporary debates on the riskiness of housing lending. It indicates that the macroeconomic shocks experienced by the household sector during the past three decades have been small relative to the lending standards in place for housing lending over this period. Future macroeconomic shocks may, however, have a larger impact on households. There have been, for example, no large nationwide falls in house prices during recent decades. In addition, a rise in unemployment on par with that in the early 1990s could be expected to have a more severe influence on household credit losses, given the large rise in household indebtedness over the intervening period. A corollary of this rise in household indebtedness is the greater share of banks’ lending now made up by housing and personal lending. These considerations suggest that any weakening in lending standards in these areas could have a larger systemic impact than in the past.

RBA Statement on Monetary Policy Lowers Growth

The RBA released their statement on monetary policy May 2015, today. In it there is no signal about future interest rate movements, but growth forecasts were lowered, to 2% in June 2015. Beyond that, the economy is now expected to grow to 3.25% in the year ended December 2016 (previously 4%). They expect unemployment to rise further to a peak of 6.5%. Inflation is expected to rise later in 2015, a little, but still within the target band. In an investigation into the cycle of dwelling investment, they find that on balance, strength in dwelling investment is likely to be sustained, supported by low interest rates and relatively strong population growth. However, difficulties in obtaining the necessary production inputs, especially suitable land with development approval in some parts of the country, are likely to limit the extent of any further pick-up in dwelling investment growth above what is currently expected.

Growth of Australia’s major trading partners was around its long-run average in 2014. It appears to have eased slightly in the early months of 2015. Commodity prices have been quite volatile over recent months, notably iron ore and oil prices, which have rebounded somewhat from recent lows. Even so, prices of Australia’s key commodity exports overall have declined since the beginning of 2015 and are well down on levels of a year ago. In large part, the declines reflect growth in the supply of commodities globally, although an easing of growth in China’s demand for some key commodities has also played a role. While there has been a further fall in Australia’s terms of trade, the Australian dollar has appreciated by around 3 per cent against the US dollar and in trade-weighted terms since the previous Statement. In China, economic growth has eased further. The Chinese property market remains a source of weakness in the economy and this is flowing through to weaker demand for steel and other construction related products. Indicators for Japanese economic activity have been somewhat mixed early this year, though labour market conditions remain tight and there are tentative signs that wage growth will rise, which is expected to underpin a pick-up in domestic price pressures. Economic growth in the rest of east. Asia looks to have slowed a little in the March quarter.

Growth in the US economy moderated in the March quarter, largely reflecting the temporary effects of disruptions related to severe weather and industrial action in west coast ports. Meanwhile, the US labour market has continued to improve and wage growth has picked up. Economic activity in the euro area is recovering at a gradual pace.

Despite slightly weaker-than-expected conditions early in 2015, growth of Australia’s major trading partners is expected to remain around its long-run average pace in 2015 and 2016. Growth will continue to be supported by very stimulatory monetary policies in most parts of the world. Core inflation rates are below many central banks’ targets. The Federal Open Market Committee is not expected to start increasing the US policy rate until the second half of 2015, while the People’s Bank of China has recently taken steps to boost liquidity and has adopted a more accommodative monetary policy stance more generally. The European Central Bank and the Bank of Japan continue to expand their balance sheets in line with their previously announced policies. Accordingly, finance remains readily available amid very favourable pricing conditions, notwithstanding the sharp rise in sovereign yields in recent days. Also, the low oil price is providing support to Australia’s trading partners, most of which are net oil importers.

The available data suggest that the domestic economy continued to grow at a below-trend pace in the March quarter. Dwelling investment and resource exports appear to have continued growing strongly and there is evidence that the growth of household consumption has been gaining some momentum over the past six months or so. However, investment in the mining sector is declining noticeably and non-mining business investment remains subdued.  Moreover, indicators of nonmining business investment intentions suggest that a significant pick-up is not in prospect over the next year or so.

Conditions in the established housing market remain strong, especially in Sydney and to a lesser extent in Melbourne. Outside these cities, however, housing price growth has declined. Forward-looking indicators, including building approvals, suggest that dwelling investment overall will continue to grow strongly over coming quarters. Housing credit growth has been little changed at a pace that is around the long-term growth of household income. Growth of housing credit for investors remains close to 10 per cent on an annual basis, with no sign of growth either increasing or decreasing in the period ahead. Very low interest rates and increasing housing prices helped to support a pick-up in the growth of household consumption over 2014. More recent retail sales data suggest that consumption growth maintained its pace into the early months of 2015. Measures of consumer sentiment remain a little below average.

Export volumes continue to increase, aided in the March quarter by the absence of substantial weather-related disruptions to mining and shipping operations across the country. Resource export volumes are expected to continue growing as new production capacity for iron ore and liquefied natural gas comes on line over 2015. However, the decline in commodity prices in recent quarters has put pressure on higher-cost producers in the iron ore and coal sectors. While the substantial declines recorded in mining investment have been much as expected, producers have responded to lower  commodity prices with further cost-cutting. Some smaller, higher-cost producers of iron ore and coal in Australia have announced the curtailment of production, although the affected mines accounted for only a relatively small share of Australian production in 2014.

Non-mining business investment has remained subdued even though many of the conditions for a recovery have been in place for some time. Access to funding does not appear to be constraining business decisions; lending rates on the outstanding stock of business (and housing) loans have continued to edge lower and business credit growth has been picking up. Also, surveys suggest that business conditions in the non-mining sector are close to average. However, forward-looking measures of business confidence remain a bit below average and non-residential building approvals are relatively subdued. Business liaison suggests that firms have spare capacity and are still waiting to see a more substantial improvement in demand conditions before they commit to major new investment projects. In line with that, surveys of investment intentions do not indicate that there will be much of a pick-up in non-mining capital investment over the next year or so.

There continues to be excess capacity in the labour market, though the most recent labour force data suggest that employment growth has increased over the past six months or more, to be above the rate of population growth. The participation rate has picked up slightly, and the unemployment rate has been stable at about 6¼ per cent since mid 2014. Forward-looking indicators of labour demand, which had picked up somewhat over the past year, have been little changed over recent months and point to modest growth of employment over coming months.

Consumer price inflation declined over the past year, reflecting substantial falls in fuel prices and the repeal of the carbon price, although the recent rebound in fuel prices should add to headline inflation somewhat in the near term. Measures of underlying inflation remained around ½–¾ per cent in the March quarter and 2¼–2½ per cent over the past year. Domestic cost pressures are generally well contained, partly because of the extended period of low growth of wages, with the result that non-tradables inflation was about 1 percentage point below its decade average over the year to March. Consumer prices related to housing increased by marginally more than their historical average, driven by inflation in new dwelling costs, which in turn reflects the strength of dwelling investment. Tradables inflation (excluding volatile items and tobacco) has picked up in response to the depreciation of the Australian dollar over the past two years or so.

Growth in the Australian economy is expected to continue at a below-average pace for a little longer than earlier anticipated and to pick up gradually to an above-average pace over 2016/17. The key forces shaping the outlook are much as they have been for some time. Recent data suggest that consumption growth has continued to pick up gradually, supported by very low interest rates and relatively strong population growth. Forwardlooking indicators continue to suggest that dwelling investment will continue to grow strongly in the near term. The momentum building in household demand will, in time, provide some impetus to nonmining business investment, even though indicators of investment intentions suggest that non-mining business investment is not likely to pick up over coming quarters, as had been expected at the time of the February Statement. Export growth is also expected to continue making a substantial contribution to GDP growth. Mining investment, fiscal consolidation and the falling terms of trade are expected to impart an offsetting restraint on growth over the next couple of years at least. The profile for GDP growth implies that there will be excess capacity in the labour market for longer than previously thought. The unemployment rate is expected to rise gradually and peak a little later than envisaged in the February Statement, before gradually declining towards the end of the forecast period. Wage growth is not expected to increase much from its current low levels over the next two years or so. As a result, domestic labour cost pressures are likely to remain well contained and underlying inflation is expected to be consistent with the inflation target throughout the forecast period.

The risks to the outlook for the global economy appear roughly balanced, other than for China where risks remain tilted to the downside. Weakness in the Chinese property market and constraints on the ability of local governments to fund infrastructure projects continue to represent key sources of uncertainty for China’s economic growth and its demand for commodities. Any significant change in the demand for steel in China would affect the prices of iron ore and coking coal. Also, if high cost producers of iron ore in China were to curtail production significantly, this would place upward pressure on prices.  Developments in China and their impact on commodity prices are also likely to affect the outlook for the exchange rate, which is another important consideration for the forecasts for the domestic economy. Further depreciation of the exchange rate seems both likely and necessary, particularly given the significant declines in key commodity prices, although increasingly divergent monetary policies in the major economies are also likely to have an important bearing on exchange rate developments.

Domestically, the forecasts embody a further gradual pick-up in consumption growth and decline in the saving ratio. However, if households respond to changes in interest rates and asset prices to the same degree as they did prior to the global financial crisis, this would support higher consumption growth and imply a lower saving ratio than embodied in the forecasts. Alternatively, if households are less inclined to bring forward their consumption than has been factored into the forecasts, perhaps because they do not wish to increase their leverage, consumption growth would be weaker and the saving ratio higher than forecast.

Business investment remains a significant source of uncertainty. Mining investment is expected to fall significantly, but the size of the fall and the impact of lower-than-expected commodity prices remain uncertain. There are also significant risks to the forecasts for non-mining investment. While the latest capital expenditure survey implies a weaker profile for non-mining business investment over the next year than currently forecast, the first estimate of investment intentions for 2015/16 is subject to considerable uncertainty and the survey covers only about half of actual non-mining business investment. Moreover, many of the preconditions for a recovery in non-mining business investment are in place, so it is possible that the recovery could begin earlier or be stronger than currently forecast. The adjustment to the decline in the terms of trade and mining investment over recent years has resulted in a rise in the  unemployment rate and a pronounced decline in wage growth in the economy. The unemployment rate is expected to rise a little further from here, before it begins to decline. It is possible that employment growth will be stronger than expected and the unemployment rate will not increase to the extent anticipated, although this could probably only be achieved with ongoing moderation in wage growth.

The Reserve Bank Board reduced the cash rate by 25 basis points at its February meeting. At its March and April meetings, the Board kept the cash rate steady, but indicated that further easing may be appropriate. Over that period, incoming data have generally provided more confidence that growth in household expenditure is gaining some momentum, consistent with the forecasts presented in the February Statement. However, other information, including the forward-looking indicators of investment, suggested that overall growth will remain below trend for longer than had previously been expected. Accordingly, the economy is likely to be operating with a degree of spare capacity for some time yet and domestic cost pressures are expected to remain subdued and inflation well contained. The Board noted that although financial conditions are very accommodative, the exchange rate continues to offer less assistance than would normally be expected in achieving balanced growth in the economy. It also noted that while housing price growth is very strong in Sydney, it has declined across much of the rest of the country, and there has been little change to the growth of housing credit in recent months. The Bank is working with other regulators to assess and contain risks that may arise from the housing market.

At its May meeting the Board judged that, under these circumstances, it was appropriate to reduce the cash rate by a further 25 basis points to provide some additional support to economic activity. This could be expected to reinforce recent encouraging trends in household demand and is consistent with achieving the inflation target. The Board will continue to assess the outlook and adjust policy as needed to foster sustainable growth in demand and inflation outcomes consistent with the inflation target over time.

APRA Finalises New Disclosure Requirements for ADIs

The Australian Prudential Regulation Authority (APRA) has today released a response to submissions paper and final versions of Prudential Standard APS 110 Capital Adequacy and Prudential Standard APS 330 Public Disclosure, which incorporate new disclosure requirements for a limited number of authorised deposit-taking institutions (ADIs). These standards take effect from 1 July 2015. In most cases, the first set of disclosures will be based on September 2015 reporting dates.

With regard to capital, the Prudential Standard requires an authorised deposit-taking institution (ADI) to maintain adequate capital, on both a Level 1 and Level 2 basis, to act as a buffer against the risk associated with its activities. An ADI must have an Internal Capital Adequacy Assessment Process (ICAAP) that must: (a) be adequately documented, with the documentation made available to APRA on request; and (b) be approved by the Board initially, and when significant changes are made.

An ADI must, on an annual basis, provide a report on the implementation of its ICAAP to APRA (ICAAP report). A copy of the ICAAP report must be provided to APRA no later than three months from the date on which the report has been prepared.

APRA will determine prudential capital requirements (PCRs) for an ADI. The PCRs, expressed as a percentage of total risk-weighted assets, will be set by reference to Common Equity Tier 1 Capital, Tier 1 Capital and Total Capital. PCRs may be determined at Level 1, Level 2 or both.

The minimum PCRs that an ADI must maintain at all times are:

(a) a Common Equity Tier 1 Capital ratio of 4.5 per cent;
(b) a Tier 1 Capital ratio of 6.0 per cent; and
(c) a Total Capital ratio of 8.0 per cent.

APRA may determine higher PCRs for an ADI and may change an ADI’s PCRs at any time.

From 1 January 2016, an ADI must hold a capital conservation buffer above the PCR for Common Equity Tier 1 Capital. The capital conservation buffer is 2.5 per cent of the ADI’s total risk-weighted assets, unless determined otherwise by APRA. The sum of the Common Equity Tier 1 PCR plus the capital conservation buffer determined by APRA will be no less than 7.0 per cent of the ADI’s total risk-weighted assets. Any amount of Common Equity Tier 1 Capital required to meet an ADI’s PCRs for Tier 1 Capital or Total Capital, above the amount required to meet the PCR for Common Equity Tier 1 Capital, is not eligible to be included in the capital conservation buffer.

From 1 January 2016, APRA may require an ADI to hold additional Common Equity Tier 1 Capital, of between zero and 2.5 per cent of total risk-weighted assets, as a countercyclical capital buffer. An ADI with credit exposures in geographic locations outside Australia must calculate any countercyclical capital buffer requirement as the weighted average of the buffers that are applied by the regulatory authorities in jurisdictions in which the ADI has exposures. APRA will inform ADIs of any decision to set, or increase, the level of the countercyclical capital buffer up to 12 months before the date from which it applies. Any decision by APRA to decrease the level of a countercyclical capital buffer will take effect immediately.

An ADI or authorised NOHC (as applicable) must obtain APRA’s written approval prior to making any planned reduction in capital, whether at Level 1 or Level 2.

An ADI or an authorised NOHC (as applicable) must notify APRA, in accordance with section 62A of the Banking Act, of any breach or prospective breach of the capital requirements contained in this Prudential Standard and inform APRA of any remedial actions taken or planned to deal with the breach.


IMF Regional Economic Outlook Update

The IMF released their Regional Economic Outlook for Asia Pacific to April 2015 today. China’s growth is predicted to fall, Australia’s to rise a little, on a comparative basis, our banks hold lower capital than many across the region, and the IMF stress the importance of macroprudential measures to reign in house prices, and fiscal stimulus to support economic growth. A few selected highlights:

Asynchronous monetary policies in major advanced economies in response to divergent cyclical conditions have contributed to large and rapid exchange rate realignments. Robust growth and the prospect of higher interest rates in the United States, coupled with the start of quantitative easing in the euro area and further monetary stimulus in Japan, have caused the value of the major reserve currencies to diverge sharply. While the dollar has gained substantially against most other currencies, rising about 9½ percent on a trade-weighted basis since the end of June 2014, the yen has fallen by about 10½ percent in nominal effective terms over the same period, and the euro has been broadly unchanged.

Against this backdrop, a number of Asia and Pacific currencies have appreciated in nominal effective terms since mid-2014. This reflects somewhat greater stability of Asian currencies relative to the dollar than implied by the share of the United States in these countries’ gross trade. In contrast, the currencies of commodity exporting Australia, Malaysia, and New Zealand have depreciated in nominal effective terms
(Figure 1.7).

IMF-Exchange-May-2015Changes in real effective exchange rates have been broadly in line with changes in their nominal counterparts. However, using weights based on domestic value added in exports, appreciations of most Asian currencies have been less pronounced, suggesting a more modest erosion

Bank balance sheets have strengthened across most of Asia. Bank profitability has been high in many countries and, together with injections of new Basel III–compliant equity, has contributed to an increase in Tier 1 capital (Figure 1.23). Note that Australia is at the lower end of Tier 1.

IMF-Capiital-Ratios-2015

While still outperforming most other large economies, China’s growth rate is expected to continue to edge lower over the medium term as rebalancing proceeds. Growth is projected to ease to 6.8 percent in 2015 and to 6.3 percent in 2016 as the correction in the residential and related sectors continues to drag on investment.

The downturn in the global commodity cycle will continue to affect Australia’s economy, with related investment coming off historic highs. However, supportive monetary policy and a weaker exchange rate will underpin nonresource activity, helping to edge up growth in 2015 to 2.8 percent, rising to 3.2 percent in 2016 (broadly unchanged from projections in the October 2014 WEO).

In Australia and New Zealand, consumers gain from the oil price windfall while forgone mining receipts and royalties have a negative effect on mining companies and the fiscal accounts.

In addition to strong microprudential supervision and regulation, protecting financial stability will require proactive use of macroprudential policies to increase resilience to shocks and contain the buildup of systemic risk associated with changes in financial conditions. In fact, greater reliance on macroprudential policies may be needed where the fi nancial cycle is not well synchronized with the real economy cycle (Australia, Hong Kong SAR, Korea), which may be more likely in the presence of strong unconventional monetary policies in the major economies. To avert overheating or overinvestment in real estate that could threaten the stability of financial systems, eliminating the preferential tax treatment of real estate (for example, by raising taxes on real estate capital gains) and tightening regulations on credit financing for real estate development and purchase (for example, imposing binding loan-to-value limits and debt-service-to-income ceilings) are advised. Macroprudential policies and capital flow measures should not substitute for appropriate macroeconomic policy reactions to volatile capital flows and asset price swings.

On the other hand, fiscal stimulus, or a slower pace of consolidation, may be appropriate for economies facing temporary adverse terms-of-trade shifts or where output is below the full-capacity level (Australia, Korea). But care should be taken to ensure that stimulus is reversed during cyclical upturns and to avoid conflating weaker potential growth with a temporary growth dip.

High Liquidity Creation and Bank Failures

An IMF working paper published today entitled “High Liquidity Creation and Bank Failures”, suggests that regulators may want to consider incorporating liquidity creation into their early warning systems and subject high liquidity creators to additional oversight to either prevent bank failure or impose an orderly winding-down of the bank and limit taxpayer losses.

Identifying vulnerabilities which may lead to bank failure is a persistent challenge to regulators of financial systems and market analysts. Regulators seek timely warning of bank failures for an efficient deployment of monitoring resources and for enhancing regulation enforcement, and shareholders and taxpayers want to avoid substantial resolution costs as well as reduce the time involved in loss resolution.

Two hypotheses in the literature on bank fragility explain bank failures: the “Weak Fundamentals Hypothesis” (WFH) and the “Liquidity Shortage Hypothesis” (LSH). Under the WFH, poor bank fundamentals foreshadow an impending bank failure and CAMELS components are often used as the basis for an early warning system. Bank failures are thus information-based, as decaying capital ratios, reduced liquidity, deteriorating loan quality, and depleted earnings signal an increased likelihood of bank failure. In contrast, the LSH assumes that banks are solvent institutions but fragility is due to the irrational behavior of uninformed depositors who are unable to distinguish between liquidity and solvency shocks. According to this hypothesis, bank vulnerability to crises stems from the financing of illiquid assets with liquid liabilities. When exposed to an external shock and under the sequential servicing constraint, first-in-line depositors seek to withdraw all their deposits and, as the bank’s ability to meet deposit withdrawals declines, liquidity shortages become pronounced and the probability of failure increases.

The WFH focuses on asset risk to explain bank fragility and bank risk under the LSH arises from the liability side of the balance sheet. In this paper, we propose that bank vulnerability may result from the interaction between both asset and liability risks. Using new measures on liquidity creation, we postulate that banks’ vulnerability to failure may resultfrom a proliferation in the core activity of liquidity creation. We propose the “High Liquidity Creation Hypothesis” (HLCH) to explain bank failures, complementing the WFH (which identifies banks with weak fundamentals) and the LSH (which focuses on the inability of banks to meet liquidity commitments). According to the HLCH, a bank’s vulnerability increases when the core output measured by liquidity creation reaches high levels compared to other banks’ activities in the system.

To test this, we need a banking system that witnessed a number of bank failures which are unrelated to economic business cycles or triggered by adverse exogenous shocks. In Russia, over 200 banks failed between 2000 and 2007 and many of those failures were not associated with the business cycle. Thus, the banking system in Russia provides a natural field experiment to test as we are able to isolate the reasons for bank fragility independently from exogenous events.

To gauge the impact of high liquidity creation on the probability of bank failures, we perform logit regressions with bank random effects. We use different thresholds to define high liquidity creation in a given quarter, based on the distribution of the entire liquidity creation in the banking system. Our findings confirm the hypothesis that high liquidity creation increases the probability of bank failure, and the results are robust to several validity checks. Rather than suggesting an absolute cut-off value, we propose to screen financial intermediaries based on their liquidity creation ranking in the system. The identification of high liquidity creators allows regulators to at least place these banks on the watch list for enhanced oversight in view of reducing the number of failures in the system and strengthening incumbent institutions.

We propose a screening procedure of banks, ranking them based on their liquidity creation in the system. Specifically, we define high liquidity creators as banks with a liquidity creation level in a given quarter that exceeds the 90th percentile of the distribution. When liquidity creation becomes high, the probability of failure for such a bank increases significantly more than for other banks. Our results are robust to alternative measures of liquidity creation and definitions of bank failure, and controlling for bank location, market concentration, and regulatory changes. They are also in line with the theoretical predictions of Allen and Gale (2004) and empirical results for the U.S. (Berger and Bouwman, 2011).

The HLCH has two main implications. First, it suggests that liquidity creation by banks can be counterproductive when it becomes high. Liquidity creation above a certain threshold increases the probability of bank failure, eventually leading to the disappearance of the high liquidity-creating institution and even a reduction in the volume of aggregate liquidity creation in the economy. Therefore, regulatory authorities may need to give more attention to the liquidity-creating activities by banks when identifying vulnerabilities in the financial system. Second, our main finding provides insight for regulatory authorities to predict bank failures. Specifically, regulators may want to consider incorporating liquidity creation into their early warning systems and subject high liquidity creators to additional oversight to either prevent bank failure or impose an orderly winding-down of the bank and limit taxpayer losses.

Did Abolishing Negative Gearing Push Up Rents? – ABC Fact Check

ABC Fact Check investigates whether abolishing negative gearing in 1985 caused rents to surge. During the period negative gearing was abolished rents notably increased only in Sydney and Perth. Other factors, including high interest rates and the share market boom, were also contributors to rent increases at the time.

As property prices continue to rise across Australian capital cities, in particular Sydney, the debate around how to address housing affordability problems has intensified.

Sydney house prices have jumped more than 6 per cent since the beginning of the year, increasing pressure on first home buyers.

The Reserve Bank has raised concerns that “ongoing strong speculative demand” from property investors will exacerbate the run-up in housing prices and raise the risk of big price falls.

Negative gearing, a tax deduction for rental property investors, is an area of contention.

But Treasurer Joe Hockey says if negative gearing is abolished, there could be other serious consequences.

“If you abolish negative gearing on investment properties, there’s a strong argument that rents would increase,” Mr Hockey said on the ABC’s Q&A.

Mr Hockey said that in the 1980s, when negative gearing was briefly removed, there was a backlash from investors who increased rents to “replace the lost income” negative gearing had provided.

“The net result was you saw a surge in rents,” he said.

Mr Hockey has made similar claims a number of times in the past two months. On April 28 he said: “If you were to remove negative gearing you would see an increase in rents and I think that hurts lower income Australians who may be renting those homes.”

However, during the period that negative gearing was abolished real rents notably increased only in Sydney and Perth – where rental vacancies were at extremely low levels.

This is inconsistent with arguments that negative gearing was a significant factor, with negative gearing likely to have a uniform impact on rents in all capital cities.

At the same time, high interest rates and the share market boom of the mid 1980s increased consumer demand for rental properties, encouraged existing investors to pass on high mortgage costs to renting consumers, and discouraged additional investors from investing in the rental property market.

While the rent increases in two cities did coincide with the temporary removal of negative gearing tax deductions, it is unlikely that change had a substantial impact on rents in any major capital city in Australia.

Mr Hockey’s claim doesn’t stack up.

Link to the ABC video

RBA Rate Cut Increases Need for Greater Macro-Prudential Response – Fitch

Fitch Ratings says the Reserve Bank of Australia’s (RBA) recent interest rate cut is likely to lead to a strengthened macro-prudential response from the Australian Prudential Regulatory Authority (APRA) for the Australian banking system, although implementation will probably remain targeted and occur on a bank-by-bank basis.

Today’s rate cut is likely to further fuel the Australian property market, particularly in Sydney, at a time when the authorities are trying to take the steam out of the market. Macro-prudential tools allow the regulator to influence banks’ risk appetite, preserving asset quality and limiting potential losses in the event of an economic shock. The Australian banking system benefits from strong loss absorption capacity given the banks’ sound profit generation and provision levels, as well as adequate capitalisation. These strengths could be undermined by further increases in property prices and household debt, given mortgages form the largest asset class for Australian banks.

APRA has targeted certain higher risk areas such as investor mortgages, indicating growth in excess of 10% per annum would trigger closer regulatory monitoring and may lead to tougher capital requirements. In addition, APRA could use a set of other macro-prudential tools which may include a combination of debt-servicing requirements, additional capital requirements and/or loan-to-value ratio (LVR) restrictions, depending on each lender. Given the existence of lenders’ mortgage insurance (LMI), which mitigates the banks’ risk of higher LVR mortgages, debt-servicing requirements and higher capital requirements on a bank-by-bank basis are likely to be the preferred options.

Growing risks in the housing market and the banks’ mortgage portfolios could be exacerbated if further macro-prudential scrutiny is not forthcoming. The recent interest rate cut may lead to further house price appreciation, especially in cities such as Sydney and Melbourne, where there has been greater investor activity over the past 12 to 18 months. The first rate cut in February 2015 was followed by increased activity in these housing markets. The growth in house prices exceeded lending growth up to the end of 2014, but this trend could reverse as interest rates are at historical lows. At the same time, it makes borrowers vulnerable to a potential increase in interest rates in the medium term. Australia has one of the highest household debt levels globally, and if low interest rates contribute to higher credit growth, it could drive up household indebtedness from already historically high levels.

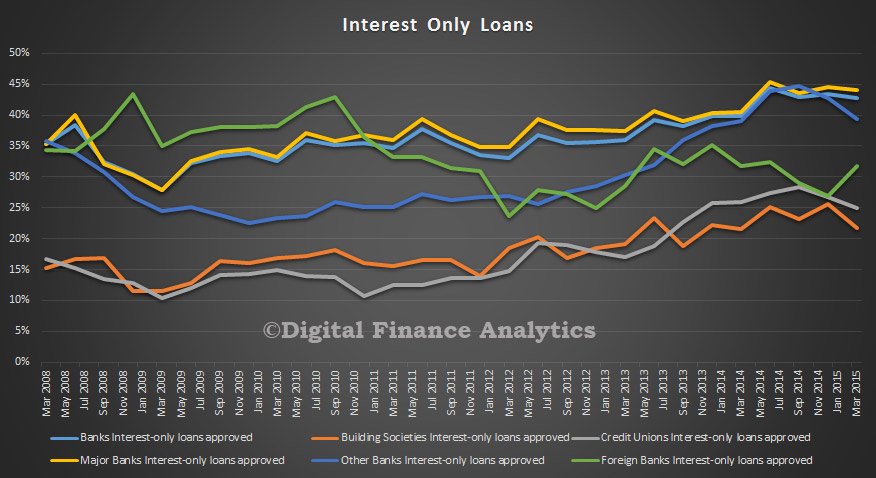
Falling interest rates may also result in further growth in potentially higher-risk loan types, such as interest-only and investor loans. These loan types already represent a high proportion of new approvals for Australian banks, as shown in Fitch’s “APAC Banks: Chart of the Month, February 2015”. The proportion of new interest-only mortgages is higher than new investor mortgages, suggesting that owner-occupiers are increasing the use of these types of loans at a time when historically-low interest rates should encourage borrowers to pay off debt. Serviceability testing at Fitch-rated Australian banks may provide some offset to this risk, with loans assessed on a principle and interest basis and at interest rates well above the prevailing market rate.